Introduction
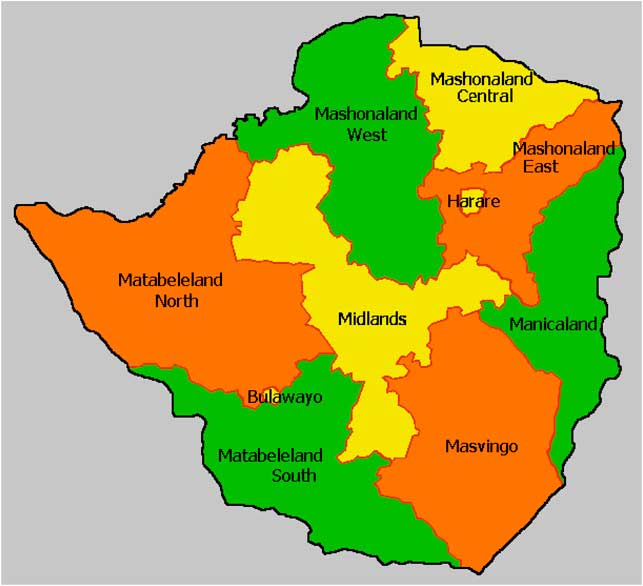
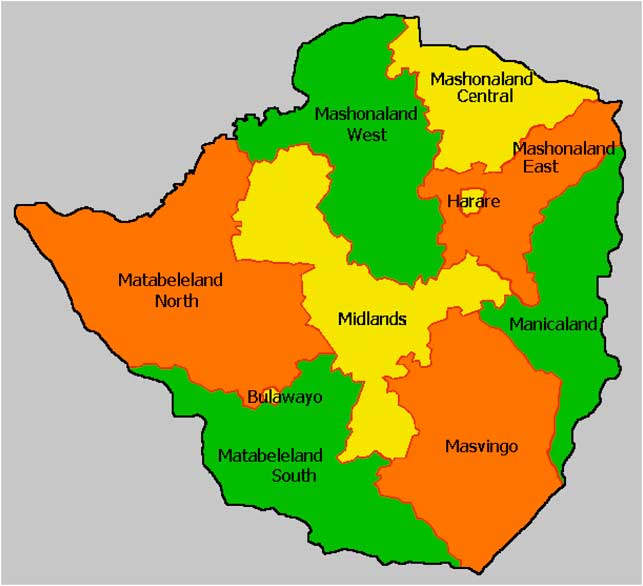
Zimbabwe, a southern African country with a population of 15,603,000 people, has one of the worst HIV epidemics in the world with an estimated prevalence in 2014 of 16.7% among 15- to 49-year-olds (UNAIDS, 2015a; WHO, 2017); this was down from a peak prevalence of 27.7% in 1997 (UNAIDS, 2015b). However, a reduction in prevalence reported nationally could be obscuring the spatial prevalence and the temporal dynamics of the HIV epidemic at a sub-national level. Zimbabwe is made up of ten regions (Fig. 1). Gonese et al. (Reference Gonese, Mapako, Dzangare, Rusakaniko, Kilmarx, Postma and Mugurungi2015) found striking variations in the change of prevalence amongst males and females across different Zimbabwean provinces. Over a 6-year period in Zambia, regions changed from being among the highest HIV prevalence areas to becoming one of the lowest, and vice versa (Kandala et al., Reference Kandala, Brodish, Buckner, Foster and Madise2011). Another study found greater significant declines in HIV prevalence among young urban women compared with young rural women in Zambia (Sandoy et al., Reference Sandøy, Kvåle, Michelo and Fylkesnes2006). Cuadros and Abu-Raddad (Reference Cuadros and Abu-Raddad2014) found that areas with low HIV prevalence in several sub-Saharan countries had experienced further sharp declines, thus driving a national reduction in prevalence. However, prevalence has continued to rise or remain steady in some areas of sub-Saharan Africa with high HIV prevalence. Therefore, consideration of the spatio-temporal dynamics of the HIV epidemic at sub-national level is important as this could guide effective and targeted service delivery as well as intervention planning for the future.
Map of Zimbabwe showing its ten regions.
The current study aimed to investigate the sub-regional changes in HIV prevalence in Zimbabwe over the 5- to 6-year period between 2005–06 and 2010–11. Thus, the study contributes to the Zimbabwe National HIV and AIDS Strategic Plan II (ZNASPII), which aims to promote the equitable distribution and delivery of services countrywide (National AIDS Council, 2011).
Methods
Data collection
Data were from two successive Zimbabwe Demographic and Health Surveys (ZDHS) from 2005–06 and 2010–11. The DHS are funded by the United States Agency for International Development (USAID). They are a well-established source of population-level data with information about knowledge and behaviour regarding HIV/AIDS and other sexually transmitted infections. The objectives, organization, sample design and questionnaires used in the two Zimbabwe DHS are described elsewhere (Central Statistics Office, 2006). In brief, a random sample of men aged 15–59 and women aged 15–49 was selected in both surveys. Three different questionnaires were used to obtain socio-demographic data from participating households. Capillary blood samples were collected on filter paper card for laboratory testing of HIV in each household. The protocol used for collection and analysis of blood specimens was based on an anonymous linked protocol that allows for HIV test results to be merged with an individual’s sociodemographic data without identifying the individual concerned. In this study, HIV status was linked to a limited number of socio-demographic variables including respondent’s sex, age, place of residence, education level, wealth index and region of residence. (Table 1). The main variable investigated to have an impact on HIV status was the respondent’s geographic location, i.e. region of residence at the time of the survey (Fig. 1), in addition to various control variables such as socio-demographic variables known to be associated with HIV status. Age of the respondent at the time of survey was included as an indicator of the birth cohort. Other socio-demographic covariates were sex (female vs male), wealth index (poorest vs poorer, middle, richer and richest), education of the respondent (no education vs primary, secondary and higher education) and place (locality) of residence (rural vs urban).
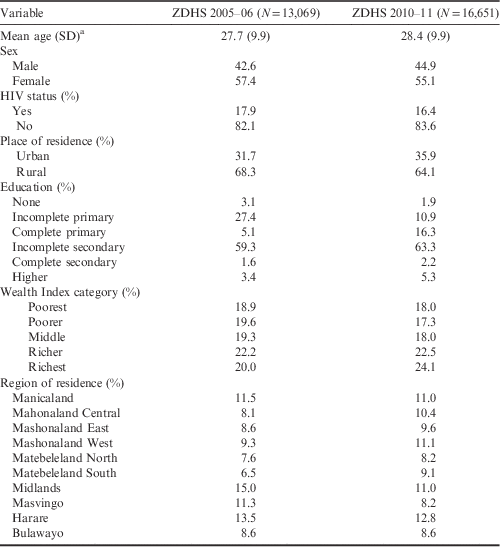
Baseline characteristics of the study respondents, ZDHS 2005–06 and 2010–11
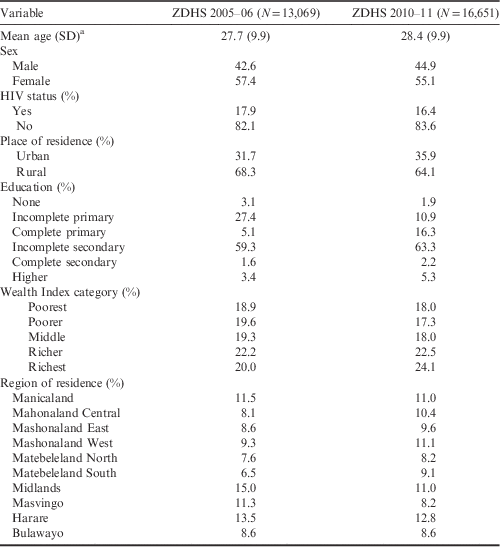
Data expressed as mean (standard deviations) or as percentages.
a Age ranges from 15 to 59 years.
Statistical analysis
The study applied a unified approach by exploring the spatial patterns in the prevalence of HIV infection at the regional level and possible non-linear effects within a simultaneous, coherent regression framework using a geo-additive semi-parametric mixed model. The model was also able to quantify the spatial autocorrelation of HIV infection in Zimbabwe arising from the population’s mobility. The model employed a fully Bayesian approach using Markov Chain Monte Carlo (MCMC) techniques for inference and model checking (Fahrmeir & Lang, Reference Fahrmeir and Lang2001; Kandala et al., Reference Kandala, Ji, Cappuccio and Stones2008). The response variable was defined as y i =1 if HIV sero-positive and y i =0 otherwise. The standard measure of effect was the Posterior Odds Ratio (POR). Although this estimation process is used less frequently in the literature, the estimated PORs produced can be interpreted in the same way as ordinary logistic models. The model and statistical techniques utilized have been described in more detail elsewhere (Kandala et al., Reference Kandala, Brodish, Buckner, Foster and Madise2011).
The model was implemented using the BayesX (version 2.0.1) software package (Brezger et al., Reference Brezger, Kneib and Lang2005), which permits Bayesian inference, based on MCMC simulation techniques (University of Munich, Munich, Germany). The statistical significance of apparent associations between potential risk factors and the prevalence of HIV was explored using chi-squared and Mann–Whitney U-tests, as appropriate. Multivariate analysis was used to evaluate the significance of the posterior odds ratio determined for the fixed non-linear effects and spatial effects.
Results
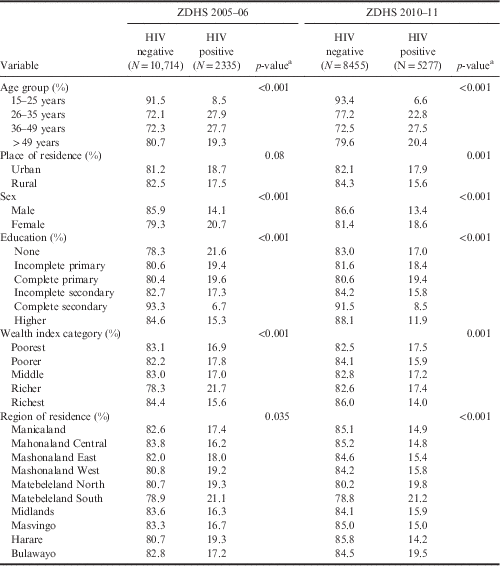
The distribution of respondents by socio-demographic variables and HIV status in the two successive ZDHS is shown in Tables 1 and 2. The overall HIV prevalence for 2005–06 was 17.9%, and it was higher among females (20.7%) than in males (14.1%). Urban areas had a higher prevalence (18.8%) than rural areas (17.5%), but the difference was not significant in the bivariate analysis. The 15–25 age group had the lowest prevalence (8.5%), and the prevalence rose markedly to 27.9% and 27.7% amongst the 26–35 and 36–49 age groups respectively, before declining to 19.3% in those aged 50 years and over. As education level increased, HIV rates decreased from 21.6% in the ‘no education’ group to 17.3% in the ‘incomplete secondary education’ group. Prevalence was 6.7% in people with complete secondary education. Prevalence rose again to 15.3% in people with education higher than secondary school. Wealth index was also a significant predictor of HIV rates, and as wealth index increased so did HIV prevalence, with a rise from 16.9% in the poorest group to 21.7% in the richer group, after which there was a sharp decrease to 15.6% in the richest group.
Baseline characteristics of the study respondents by HIV status, ZDHS 2005–06 and 2010–11
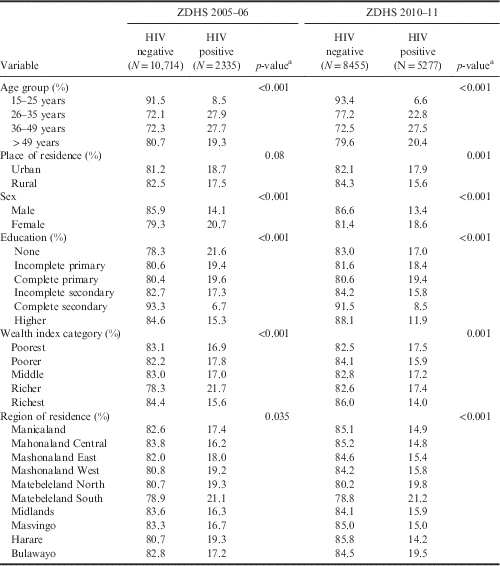
Data expressed as mean (standard deviation) or as percentages.
a p-value comparison across HIV-positive and HIV-negative cases using the chi-squared test for categorical variables.
Matebeleland South (21.1%), Harare (19.3%), Matebeleland North (19.3%), Mashonaland West (19.1%) and Mashonaland East (18%) had the highest prevalences of HIV in 2005, exceeded the national prevalence level. The lowest prevalence was in Mashonaland Central (16.2%) and Midlands (16.3%).
The 2010–11 data show a decline in overall HIV prevalence to 16.4%. Similar to the 2005 data, HIV prevalence was higher in females (18.6%) compared with males (13.4%). However, there was a reduced gap in prevalence between males and females due both to a reduction in the proportion of infected females and a decrease in the proportion of infected males. The lowest prevalence was also noted in the 15–25 age groups (6.6%). This rose to 22.8% in the 26–35 age groups before reaching a peak at 27.5% amongst the 36–49 age groups. Prevalence then declined to 20.4% in the 50 year and over group. In 2010–11, those with no secondary education still had the highest rates of HIV, but individuals with no or incomplete primary education (17.0% and 18.4% respectively) had lower rates of HIV compared with individuals with complete primary education, who had the highest HIV rate amongst the education groups (19.4%). By 2010–11 the gap between urban and rural areas had widened and reached significance: urban areas (17.9%) had a higher HIV prevalence than rural areas (15.6%). The relationship between wealth and HIV rates had also changed, as the HIV prevalence in the richer group had decreased from 21.7% to 17.4%, whereas the HIV rate in the poorest group had increased from 16.9% to 17.5%, and was now the group with highest HIV risk.
Matebeleland North and Matebeleland South remained areas with the highest HIV prevalence with this staying more or less constant at 21.2% and 19.8% respectively. All other regions except Bulawayo showed a decrease in prevalence. In Bulawayo, there was an increase in prevalence to 19.5%, changing it from one of the lower prevalence areas to one of the highest. Although the Midlands region experienced a decrease in prevalence, it went from being one of the lowest to becoming a relatively high-prevalence area. Harare, which was among the highest prevalence areas in 2005, in 2010–11 had become the lowest prevalence area (14.2%). The HIV prevalences in Matebeleland South, Matebeleland North and Bulawayo were higher than the national average.
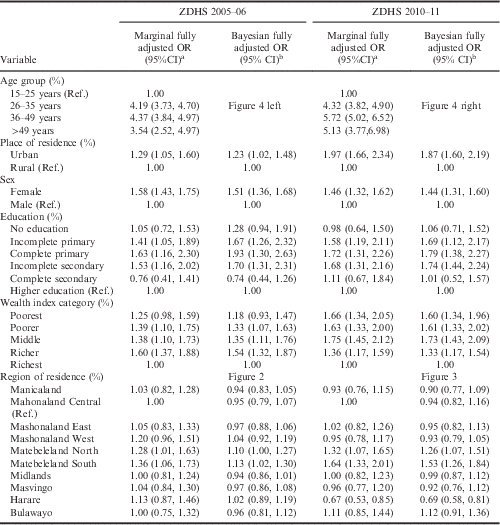
Table 3 shows the results of the multivariate analysis using Bayesian geo-additive regression analyses, i.e. adjusting for many confounding factors (including geographic location), indicating that trends in HIV prevalence had changed over time, which is consistent with the unadjusted results. The analysis showed that in 2005–06 HIV rates were highest among females, individuals who were 36–49 years old, those with complete primary education and those in the richer wealth index category. In 2010–11, females, individuals who were 36–49 years old, those with complete primary education, those living in urban areas and in the middle wealth category had the highest rates of HIV. After adjusting for other factors, Matebeleland South and Matebeleland North still had consistently higher HIV prevalence rates across the provinces of Zimbabwe. However, rates across many provinces changed in different directions. The most drastic changes were seen in Harare and Mashonaland West, where HIV rates decreased extensively. Harare became the province with the lowest HIV burden in 2011, while Mashonaland West dropped from the third highest rate to number eight. Conversely, Bulawayo had a higher burden of HIV in 2011 compared with 2005, becoming the province with the third highest HIV rate. Rates in Masvingo and Manicaland remained relatively consistent at moderate HIV levels.
Unadjusted and fully adjusted odds ratios of HIV status across selected covariates, ZDHS 2005–06 and 2010–11
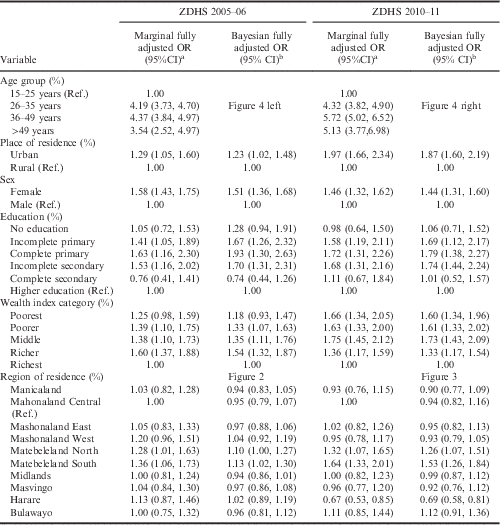
Rank of marginal OR in 2005–06: Matebeleland South (1), Matebeleland North (2), Mashonaland West (3), Harare (4), Mashonaland East (5), Masvingo (6), Manicaland (7), Midlands (8), (9), Mahonaland Central (10).
Rank of marginal OR in 2010–11: Matebeleland South (1), Matebeleland North (2), Bulawayo (3), Mashonaland East (4), Midlands (5), Mahonaland Central (6), Masvingo (7), Mashonaland West (8), Manicaland (9), Harare (10).
a Marginal fully adjusted odds ratio (OR) from standard logistic regression models and ranked from the highest to the lowest OR. Mahonaland Central is taken as reference because of its low HIV prevalence in both 2005 and 2011.
b Spatially adjusted posterior odds ratio (POR) obtained from the Bayesian geo-additive regression mixed model after controlling for non-linear effect of age, categorical variables and the region of residence (spatial effects: see also Figs 2 and 3).
Ref., reference category.
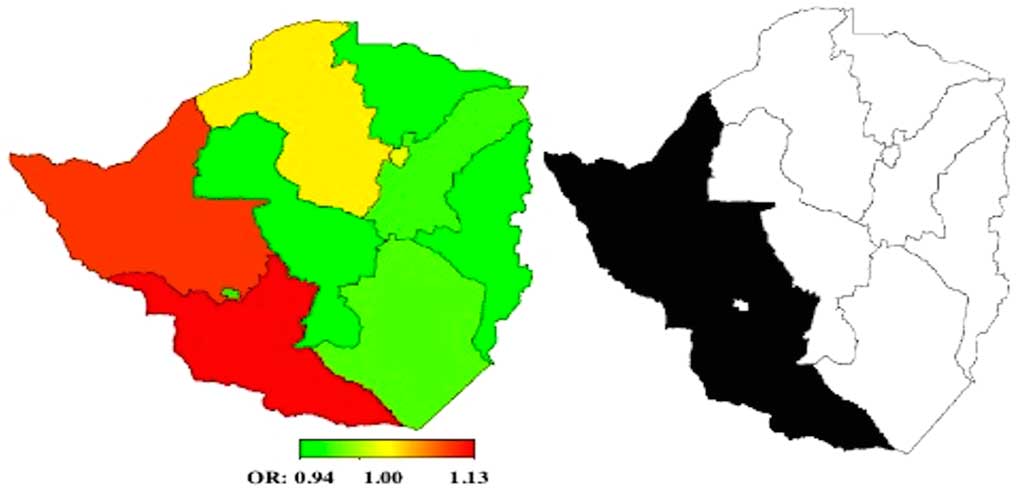
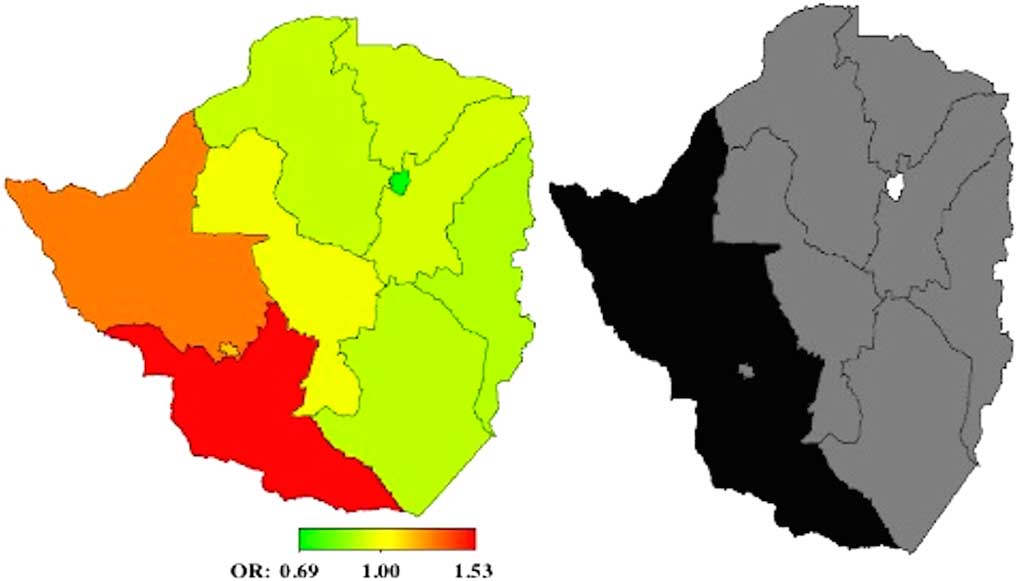
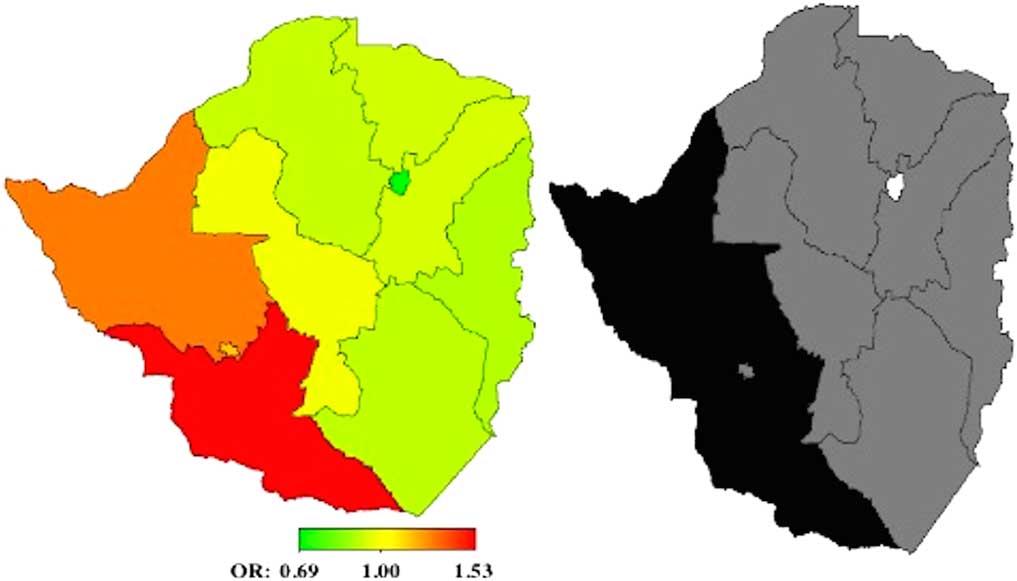
Two important observations emerged from the province-specific net spatial patterns of HIV, which included the total residual spatial patterns of the province (i.e. the sum of the structured and unstructured spatial patterns) (Figs 2 and 3). Statistically significant higher HIV rates of 10% and 13% (POR of 1.10 and 1.13) were found in the western provinces (Matebaland North and South, respectively) in 2005 (Fig. 2), and in 2011 (Fig. 3) of 26% and 53% (POR 1.26 and 1.53) (Figs 2 and 3). Secondly, trends in the remaining provinces changed over time, from a significant negative association to no association (Figs 2 and 3). Most of the provinces had lower HIV rates in 2005, with the exception of Mashonaland West (POR of 1.04; Fig. 2). By 2011, this had changed, and there was no spatial association for any of the remaining provinces, with the exception of Harare, which still had a negative association with HIV rates (POR of 0.69; Fig. 3). Over and above the impact of the fixed effects, there appeared to be a higher risk of HIV in the western districts (Matebelaland North and South) that was consistent over time.
Left: total residual spatial effects of the risk of HIV/AIDS at region level in Zimbabwe in 2005–06. Shown are the posterior odds ratios. Right: corresponding posterior probabilities at 90% nominal level.
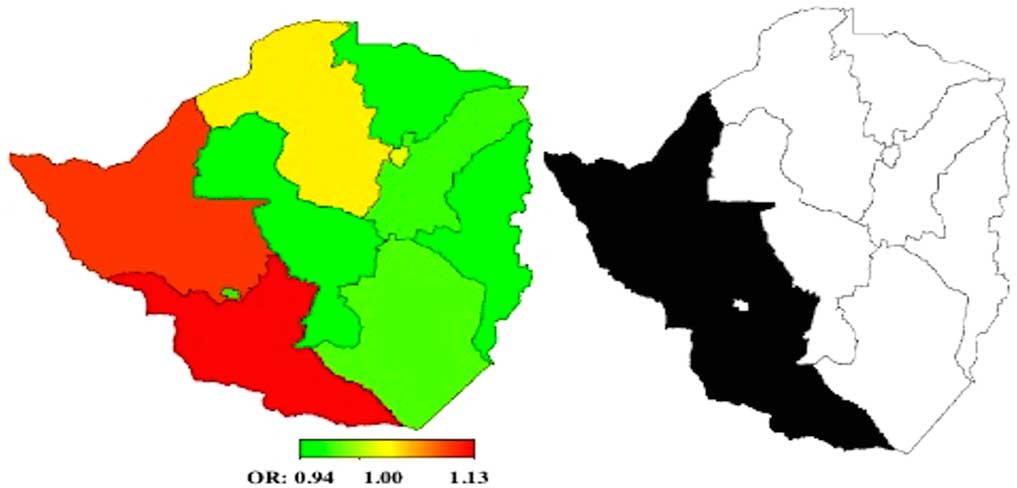
Left: total residual spatial effects of the risk of HIV/AIDS at region level in Zimbabwe in 2010–11. Shown are the posterior odds ratios. Right: corresponding posterior probabilities at 90% nominal level.
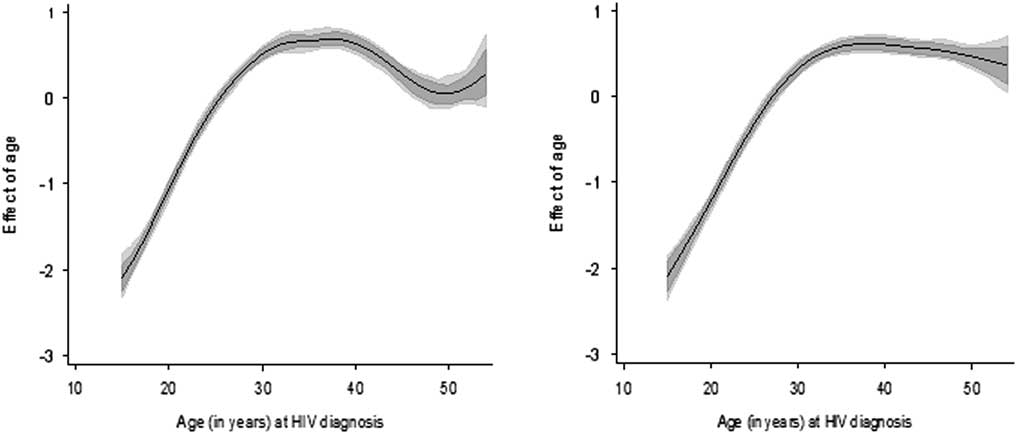
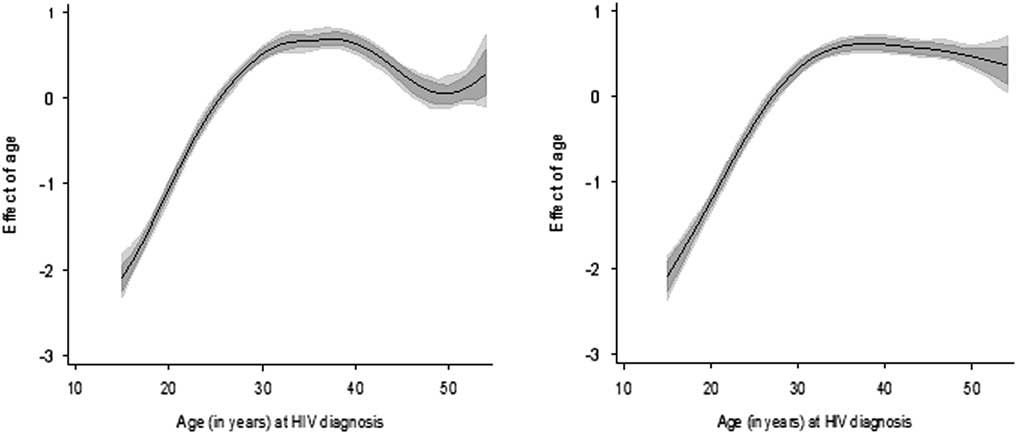
The estimated non-linear effects of age at HIV diagnosis were plotted as PORs of the risk of HIV against age. Figure 4 shows the PORs together with the 95% point-wise credible intervals. There was a non-linear relationship between the risk of HIV and age during both periods. As expected, in 2005 the likelihood of infection increased with age reaching a peak at around 35 years and then decreasing slightly until 50 years before rising again thereafter (Fig. 4, left-hand panel). In 2011, the likelihood of infection was similar and increased with age until 50 years (male only), then it levelled off (for males only) and no longer increased compared with 2005 (Fig. 4, right-hand panel). It should be pointed out that the age range for females was 15–49 and that for males was 15–59, so the above comparison for age 50 and above only refers to male respondents.
Estimated non-linear (logit) effects of respondent’s age on the risk of HIV/AIDS at the time of HIV/AIDS diagnosis in 2005–06 (left) and 2010–11 (right). Shown are the posterior logit within the 95% and 80% credible intervals (ZDHS, 2005–06 and 2010–11). Note that for females age ranges from 15 to 49 and for males from 15 to 59.
Discussion
This study investigated inequalities in HIV prevalence at the provincial level in Zimbabwe using Bayesian methods and a nationally representative household sample. The analysis took into account the effects of both individual- and regional-level measures of social inequality in order to gain insight into the influences of socioeconomic, demographic and geographical factors on HIV prevalence in the country.
The results show that HIV rates in Zimbabwe reduced over time to 16.4% in 2010–11, which is higher than the figure of around 15% reported in other studies (Zimbabwe National Statistics Agency, 2012; Glory, Reference Glory2014). This could be because the estimate was unweighted and included individuals aged over 50, while previous studies only included individuals aged 15–49 years. The marginal difference in reported values is statistically insignificant.
The most striking spatial change found in this study was that Harare in 2005 had the third highest HIV rate of all the Zimbabwean provinces, but by 2010–11 it had the lowest. This could be attributed to the success of interventions in this urban area. Conversely, Bulawayo had the lowest HIV rate in 2005 but by 2010–11 had the third highest rate. Therefore, the spatial findings from the 2010–11 data generally indicate that HIV rates progressively increased from the south-western regions to the north-eastern regions.
Over time, the highest HIV rates were found in females, the 26–49 year cohort and in individuals with no secondary education. Females are usually at higher risk of HIV due to early age of intercourse, economic factors (such as poverty and exposure to sex trafficking) as well as cultural factors where they may have less power to demand protective measures or refuse sex (Duffy, Reference Duffy2005; Karim et al., Reference Karim, Sibeko and Baxter2010). Another possible explanation for the higher risk of HIV observed among females may be the large mucosal surface of the vagina, which is more prone to injury and infection than the penis.
It is vital to tailor HIV prevention efforts to women to reduce the burden of the epidemic. Individuals aged 26–49 had higher rates of HIV compared with other groups, which may be because this is the group that has the resources, opportunity and access to a social network to engage in risky sexual behaviour.
The relationship between wealth index category and HIV rates changed between 2005 and 2010–11; whilst the richer group had higher HIV rates in 2005, in 2010–11 the poorest group had the highest risk. This could be due to the loss of household income and assets due to HIV so that those in the richer wealth category moved to the poorer category (Parkhurst, Reference Parkhurst2010). Previous findings have shown that the decline in HIV incidence has largely been in the top of the wealth index category (Lopman et al., Reference Lopman, Lewis, Nyamukapa, Mushati, Chandiwana and Gregson2007). Those in the poorest wealth index category are also less likely to have had a secondary education and possibly less access to health education and promotion materials. A systematic review found that HIV prevalence falls more consistently among highly educated groups than the less educated, even when overall population prevalence is falling (Hargreaves et al., Reference Hargreaves, Bonell, Boler, Boccia, Birdthistle, Fletcher and Glynn2008). Furthermore, people in the lower wealth index group might have fewer available resources to put health promotion recommendations into practice. For instance, transmission of the HIV virus through breast-feeding can be prevented by substituting breast milk with formula milk. However, the poor may not have access to clean water and may be unable to afford formula milk.
At the individual level, people in the richer wealth category are possibly at higher risk of HIV due to opportunity and the social network available for engagement in risky sexual behaviours, whilst people in the poorest group might be at increased risk due to early sexual debut and transactional sex (Fenton, Reference Fenton2004; Shelton et al., Reference Shelton, Cassell and Adetunji2005; Parkhurst, Reference Parkhurst2010). Thus, HIV infection risk in the higher wealth category is based on risky behaviour related to wealth, and risk in the poorer group is based on risky behaviour related to poverty (Parkhurst, Reference Parkhurst2010). Therefore, it is important for policymakers to move beyond the assumption that HIV infection is strictly related to poverty or wealth and instead focus on addressing HIV risk factors and contributing factors unique to each group (Parkhurst, Reference Parkhurst2010).
Consistent with the situation in other African countries (Dyson, Reference Dyson2003), urban dwellers in Zimbabwe are at higher risk of HIV compared with rural dwellers, and the gap between the two has increased over time. Some studies have shown this to be partly the result of successful interventions in rural compared with urban settings (Orne-Gliemann et al., Reference Orne‐Gliemann, Mukotekwa, Perez, Miller, Sakarovitch, Glenshaw and Dabis2006). Industrialized cities with developed infrastructure encourage migration from rural to urban areas causing higher density of the population and increasing contact and transmission with HIV (Voeten et al., Reference Voeten, Vissers, Gregson, Zaba, White, de Vlas and Habbema2010). Migration also increases the level of commercial sex work in urban settings (Bloom & Canning, Reference Bloom and Canning2003; Kalipeni et al., Reference Kalipeni, Oppong and Zerai2007).
HIV rates in Zimbabwe over time have remained spatially distributed, with consistently highest rates in Matebeleland South and Matebeleland North. The reasons for the higher rate of HIV infection in specific provinces have not been extensively studied in Zimbabwe. One possibility for the high HIV trends across both Matebeleland provinces is the higher prevalence of poverty in these regions (Zimbabwe National Statistics Agency, 2013). Equally, Harare had the lowest rate of HIV prevalence in 2010–11 and also had lower levels of poverty than other provinces. This possible association between poverty and HIV rates also fits with the findings in this study where in 2010–11 individuals in the poorest wealth categories had the highest rates of HIV. Conversely, Bulawayo had the second lowest rate of poverty yet had one of the highest HIV prevalence rates compared with other regions, and Mashonaland Central had one of the lowest HIV rates in 2005 but is a region with high poverty levels (Sandoy et al., Reference Sandøy, Kvåle, Michelo and Fylkesnes2006). Another hypothesis is that Matebeland South and North have higher HIV rates as they share borders with the districts of Botswana that have the highest HIV rates (Kandala et al., Reference Kandala, Campbell, Rakgoasi, Madi-Segwagwe and Fako2012). Therefore, migration between the areas may increase HIV rates in the Matebeleland provinces.
The major strength of this study was that it used a nationally representative household survey to investigate and explain inequalities in HIV rates accounting for individual, household and regional factors. Furthermore, Bayesian methodology was applied, which quantifies observable and non-observable risk factors of HIV whilst taking into account the auto-correlation in the data that exists between neighbouring geographic locations as people with HIV interact. A limitation of the study is that the data were cross-sectional, which means a causal association between HIV prevalence and its risk factors could not be inferred. Likewise, there was a time lag between exposure to HIV and its detection. Therefore, a risk factor during the time period it was analysed may not necessarily inform the exposure to HIV infection during the earlier years. Finally, other factors that were not included in the model analysis, such as condom use and number of sexual partners, may also contribute to the inequality in HIV prevalence.
This study was an extensive investigation into the spatial variation in HIV infection rates in Zimbabwe in 2005–06 and 2010–11. The study showed a significant geographic pattern of HIV infection, with the highest prevalence being around the south-western provinces of Zimbabwe, especially Matabeleland South and North. There is a need to investigate the reasons why these regions are at greater risk of HIV infection so that they can be targeted with HIV intervention programmes. The HIV distributions provided by this study can be used by policymakers to plan and implement HIV/AIDS interventions across Zimbabwe for the efficient allocation of resources to those at greatest risk.
Acknowledgments
The authors thank the Demographic and Health Survey Programme (Macro International) for providing the dataset and Caroline Gallimore, the Associate Editor, for providing useful comments and suggestions to improve the clarity of the paper.
Ethical Approval. The study protocol conforms to the ethical guidelines of the 1975 Declaration of Helsinki as reflected in a priori approval by the institution’s human research committee. Ethical approval was granted by the Ethics Committee of the National Statistical Office of Zimbabwe.
Conflicts of Interest. The authors have no conflicts of interest to declare.
Funding. This study was supported through the DELTAS Africa Initiative SSACAB (Grant No. DEL-15-005). The DELTAS Africa Initiative is an independent funding scheme of the African Academy of Sciences (AAS) Alliance for Accelerating Excellence in Science in Africa (AESA) and is supported by the New Partnership for Africa’s Development Planning and Coordinating Agency (NEPAD Agency) with funding from the Wellcome Trust (Grant No. 107754/Z/15/Z) and the UK government. The views expressed in this publication are those of the authors and not necessarily those of the AAS, NEPAD Agency, Wellcome Trust or the UK government.