1. Introduction
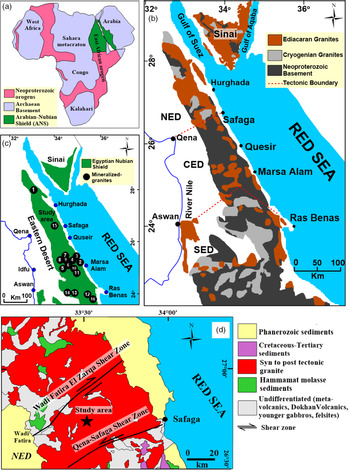
The East African Orogen (EAO), formed by the closure of the Mozambique Ocean, characterizes the most extensive Gondwana-forming orogen (Fig. 1a; Kusky et al. Reference Kusky, Abdelsalam, Stern and Tucker2003; Jacobs & Thomas, Reference Jacobs and Thomas2004; Abu Sharib et al. Reference Abu Sharib, Maurice, Abd El-Rahman, Sanislav, Schulz, Bottros and Bakhit2019). The northern part of the EAO is represented by the Arabian–Nubian Shield (ANS; Fig. 1a). The EAO basement consists of high-grade metamorphic units in the Mozambique belt, to the south, and of low-grade metamorphic units of volcanic, plutonic and sedimentary origins in the ANS, to the north (Cox et al. Reference Cox, Lewis, Collins, Halverson, Jourdan, Foden, Nettle and Kattan2012). The ANS represents a large tract of juvenile crust in northeast Africa and Arabia, which was formed during the Neoproterozoic East African orogenic cycle (c. 850–550 Ma; Johnson et al. Reference Johnson, Halverson, Kusky, Stern and Pease2013; Yeshanew, Reference Yeshanew2017). The tectonic evolution of the ANS follows the break-up of Rodinia (∼850 Ma; Stern, Reference Stern1994) during the Cryogenian (850–635 Ma) and Ediacaran (635–541 Ma) periods. The older Cryogenian crust consists of four main units: (i) metavolcano-sedimentary rocks, (ii) dismembered ophiolitic nappes and ophiolitic mélange, (iii) metagabbro–diorite complexes and (iv) quartz diorite–trondhjemite–tonalite–granodiorite intrusions. During the Ediacaran, these units were intruded by felsic A-type granite intrusions. The Pan-African orogenic shield rocks of eastern Egypt were intruded by several anorogenic within-plate granitic complexes, including Mount Abu-Kharif of Cambrian age (522 Ma; Abdel-Rahman, Reference Abdel-Rahman2006).
(a) Geographical distribution of the East African Orogen (EAO) in Africa and Arabia. The northern part of the EAO is represented by the Arabian–Nubian Shield (ANS) (modified after Abu Sharib et al. Reference Abu Sharib, Maurice, Abd El-Rahman, Sanislav, Schulz, Bottros and Bakhit2019). (b) Distribution map of the Egyptian Cryogenian (850–635 Ma) and Ediacaran (635–541 Ma) granites within the Neoproterozoic basement of the Eastern Desert and Sinai (after El-Bialy, Reference El-Bialy and Hamimi2020). NED, CED and SED represent Northern Eastern Desert, Central Eastern Desert and Southern Eastern Desert, respectively. (c) Location map of the most important mineralized-granitic intrusions in the Eastern Desert of Egypt: 1. Hawashia (Nb, Zr, Y); 2. Igla (Sn, W, Be, Li); 3. Abu Dabbab (Nb, Ta, Sn); 4. Nuweibi (Nb, Ta, Sn); 5. El Mueilha (F, Sn, W); 6. Humr Waggat (Nb, Ta, F); 7. Umm Naggat (Sn, Nb, Ta); 8. Umm Samra (U, W, Nb. Ta); 9. Ineigi (Sn, F); 10. Zabara (Be, Mo, W, Sn); 11. Nugrus (Be); 12. El Gharabiya; 13. Nikeiba (U); 14. Humr Akarem (Mo, Nb, Sn, Bi, F); 15. Abu Kharif (W); 16. Um Desi (Mo). (d) Simplified geological map showing location of the Abu Kharif area between the two mega-shear zones Qena–Safaga and W Fatira El Zarqa (modified after Abd El-Wahed and Abu Anbar, Reference Abd El-Wahed and Abu Anbar2009).

Stern and Hedge (Reference Stern and Hedge1985) subdivided the Eastern Desert into three terranes: the Northern (NED), Central (CED) and Southern Eastern Desert (SED) based on distribution of rock types and their absolute ages (Fig. 1b). The NED is characterized by an abundance of post-orogenic felsic granite intrusions, Dokhan volcanics and molasse-type sediments of the Hammamat Group. Metavolcanics, volcanogenic metasediments and diorite–granodiorite–trondhjemite intrusives are also recorded in a few areas of the NED (Eliwa et al. Reference Eliwa, Ramadan and Nosair2014). In the CED, ophiolitic mélanges and arc assemblages predominate, while the SED is characterized by a high proportion of Cryogenian granites and a relatively high abundance of gneisses and migmatites (El Bahariya, Reference El Bahariya2018; Stern, Reference Stern2018; Stern & Ali, Reference Stern, Ali and Hamimi2020).
Based on field relations, tectonic and geochronological studies, the Egyptian granites have been subdivided into older (≈27 % by volume) and younger (≈30 % by volume) granites, crystallized during a Cryogenian orogenic stage (850–635 Ma) and an Ediacaran orogenic stage (635–541 Ma), respectively (e.g. El-Sayed, Reference El-Sayed1998; Akaad & Abu El-Ela, Reference Akaad and Abu El-Ela2002; El-Bialy & Hassen, Reference El-Bialy and Hassen2012; Stern, Reference Stern2018; Stern & Ali, Reference Stern, Ali and Hamimi2020). The predominance of granitic rocks in the Egyptian shield increases northward (Fig. 1b). The Cryogenian granite intrusions are formed by either fractional crystallization of mafic crustal-derived melts generated by melting of the amphibolitic lower crust (Moghazi, Reference Moghazi1999; Farahat et al. Reference Farahat, Mohamed, Ahmed and El-Mahallawi2007; El-Mahallawi & Ahmed, Reference El-Mahallawi and Ahmed2012; Basta et al. Reference Basta, Maurice, Bakhit, Azer and El-Sobkyf2017) or by fractional crystallization of mantle-derived mafic magma with assimilation (Eliwa et al. Reference Eliwa, Ramadan and Nosair2014; El-Bialy & Omar, Reference El-Bialy and Omar2015). The Ediacaran granite intrusions have geochemical characteristics of highly fractionated calc-alkaline I-type granites and A-type granites of alkaline affinity (El-Sayed, Reference El-Sayed1998; El-Sayed et al. Reference El-Sayed, Furnes and Mohamed1999; Abd El-Ghaffar & Ramadan, Reference Abd El-Ghaffar and Ramadan2018). They are formed by either fractional crystallization of crustal magma (Moghazi et al. Reference Moghazi, El-Sayed, Arslan and Hosny2004; Farahat et al. Reference Farahat, Mohamed, Ahmed and El-Mahallawi2007; Farahat & Azer, Reference Farahat and Azer2011; Ali et al. Reference Ali, Moghazi, Maurice, Omar, Wang, Wilde, Moussa, Manton and Stern2012; El-Bialy & Omar, Reference El-Bialy and Omar2015; Lindh et al. Reference Lindh, Abu El‑Rus, Mohamed, Persson and Scherstén2019; Mohamed et al. Reference Mohamed, Ali, Sedki and Abdel Khalik2019) or by melting of oceanic crust and magma mixing of juvenile mantle-derived magma with felsic crustal melts (Farahat et al. Reference Farahat, Zaki, Hauzenberger and Sami2011; Ali et al. Reference Ali, Ismail, Nutman, Bennett, Jones and Buckman2016; Abdel-Rahman, Reference Abdel-Rahman2021).
Rare metals such as W, Mo, Sn, Ta, Nb, U, Th, REE and other mineralization in the Nubian Shield are commonly associated with the post-collision Ediacaran A-type granites and have a spatial connection with fault zones (Helba et al. Reference Helba, Trumbull, Morteani, Khalil and Arslan1997; Moghazi et al. Reference Moghazi, Iaccheri, Bakhsh, Koto and Ali2015). Sixteen localities of mineralized granites have been discovered and/or mined in the Eastern Desert of Egypt (Fig. 1c). The geological importance of the Abu Kharif area lies in the occurrence of contrasting granitic magmas of granodiorite, monzogranite and alkali riebeckite granite. In addition, the monzogranite is tungsten-bearing granite.
In this paper we present new whole-rock major, trace and rare earth element data for samples collected from the different granite rock types in the Abu Kharif area. These data precisely constrain the magmatic suites and allow us to investigate the tectonic setting, petrogenesis and magma source of these granites. Additionally, some samples of the studied granite intrusions contain high W contents while other granitic samples are barren. Thus, the effective mechanism for the formation of tungsten mineralization and the factors controlling the distribution of W are also discussed.
2. Geological setting and W-mineralization
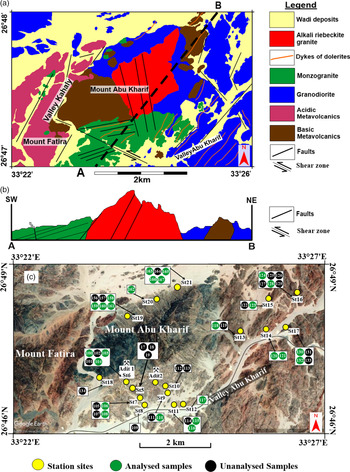
The Abu Kharif area lies in the Northern Eastern Desert of Egypt at 33° 21′–33° 28′ E, 26° 47′–26° 50′ N (Fig. 2a). The area is covered by different magmatic units including metavolcanics, granodiorite, monzogranite and alkali riebeckite granite (Fig. 2a, b). All these rocks, except the alkali riebeckite granite, are commonly intruded by dolerite dykes and quartz veins. The intrusive contacts between the different granitic rocks as well as with the metavolcanic wall-rock units are sharp.
(a) Geological map of the Abu Kharif area. (b) Schematic cross-section diagram along A–B line showing the rock units and structural elements in the study area. (c) Satellite image (Google Earth) showing the different sites and sample locations in the study area.

The metavolcanic unit is interpreted as related to a Cryogenian subduction event, and consists of the oldest rock unit in the study area. They are heterogeneous, showing prominent variations in colour index, grain-size and proportions of the constituting mineral phases. They are composed of acidic (metadacite and metarhyolite) and basic (metabasalt) metavolcanic successions; the latter are weakly foliated at greenschist facies. Sharp contact is observed between the basic and acidic metavolcanics. Locally, the metavolcanics are associated with some interbeds and lenses of metapyroclastic rocks.
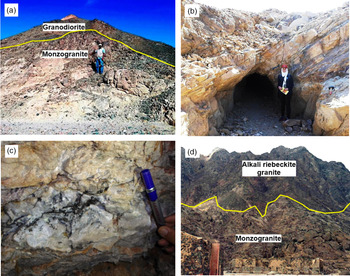
Granodiorite comprises the most abundant variety in the study area (Fig. 2a). It is a homogeneous, coarse-grained and equigranular rock. The investigated granodiorite displays most of the chemical and field characteristics of late-tectonic I-type granites described elsewhere in the Eastern Desert of Egypt (∼650 Ma; Moghazi, Reference Moghazi1999; El-Shazly & El-Sayed, Reference El-Shazly and El-Sayed2000). The granodiorite is dissected by dyke swarms of basic composition, although felsic varieties do exist. The rock surfaces are commonly exfoliated, which could be attributed to their coarse grain-size. Medium-grained massive and irregular rounded to sub-rounded mafic xenoliths of amphibolitic composition with an average diameter of a few tens of centimetres scale are scattered in sharp contacts against the host granodiorite. The granodiorite intrudes the metavolcanics at Valley Kahaly. It is intruded in sharp contacts by the monzogranite and the alkali riebeckite granite (Fig. 3a).
(a) Intrusive contact between the monzogranite and the granodiorite in the Abu Kharif area, looking N. (b) Mineralized quartz vein confined to NE intensively altered shear zone, northern ore zone, looking NE. (c) Wolframite mineralization nested in milky quartz vein that displays vuggy structure. (d) The alkali riebeckite granites intrude the monzogranites with sharp contact, looking SW.

The monzogranite lies to the south of Mount Abu Kharif (Fig. 2a). It clearly intrudes the metavolcanic and granodiorite rock units with mutual sharp contacts. The Ediacaran monzogranite has similar field, petrographical and chemical characters to the highly fractionated I-type post-orogenic intrusive granites (610–580 Ma; Moghazi, Reference Moghazi1999; Mahdy et al. Reference Mahdy, El Kalioubi, Wohlgemuth-Ueberwasser, Shalaby and El-Afandy2015; Sami et al. Reference Sami, Ntaflos, Farahat, Mohamed, Hauzenberger and Ahmed2018) distributed in the Eastern Desert of Egypt. It forms moderate to low smooth topography and is deeply weathered. Exfoliation structure and joints are common. The monzogranite is medium- to coarse-grained, and ranges in colour from whitish-pink to pale pink with joint sets oriented mainly N–S and NE–SW. It is characterized by the presence of oval-shaped, grey-color dioritic xenoliths with different dimensions. The dioritic xenoliths consist mainly of plagioclase and green actinolite, with secondary chlorite, ilmenite and apatite. The monzogranite is injected by a set of W-bearing quartz veins particularly at the south of Mount Abu Kharif (Fig. 3b, c).
The alkali riebeckite granite has a Cambrian age (522 ± 21 Ma; Abdel-Rahman, Reference Abdel-Rahman2006) dated in the Abu Kharif area. It is classified as A-type anorogenic intrusive plutons (El-Sayed, Reference El-Sayed1998; Abdel-Rahman, Reference Abdel-Rahman2006). The rough mountainous ridges of the alkali riebeckite granite show intrusive sharp contacts with most of the surrounding country rocks (Fig. 3d). The alkali riebeckite granite is leucocratic, medium- to coarse-grained, with pink to red colour. It is worth noting that this granite type is not dissected by any dykes and/or veins.
The tungsten mineralization in the Abu Kharif area occurs as wolframite-bearing quartz veins and dissemenated in the wall rock (Fig. 3b, c). The mineralized quartz veins and veinlets show variable thickness ranging from a few centimetres up to 3 m. They are confined to an area ∼350 m wide and 600 m long in the monzogranite pluton with average W content of 64.79 ppm. The surrounding alteration haloes show W content of 15.08 ppm, on average (El-Desouky, Reference El-Desouky2005). The quartz veins generally form steep walls and sharp contacts against the host monzogranite. The mineralized veins are clustered in two zones: the northern zone is highly mineralized with wolframite unlike the southern zone. The northern ore zone comprises around 15 quartz veins generally striking E–W and NE–SW with dip angles between 30 and 50°, towards either N–S or NW–SE (Fig. 3b). However, the southern zone includes a series of veins and veinlets striking to E–W and NE–SW and dipping at angles 30–40° to the N. The distribution of mineralized veins is controlled by the conspicuous NE–SW large-scaled and wide dextral shear zones (Fig. 1d) in addition to some minor fault predominated in the monzogranite. On the other hand, the NNW–SSE fault trend is cut through the alkali riebeckite granite (Fig. 2a, b).
Generally, the wolframite-bearing quartz veins and veinlets are fine- to medium-grained milky quartz which represents up to 95 % of the vein mode. The quartz occurs as large euhedral crystals (up to 3 × 1 cm) in addition to anhedral crystals filling cavities between the euhedral quartz crystals. Wolframite and sulphides occur as disseminated grains in the quartz veins, sometimes in the form of nests (Fig. 3c). These veins post-date the host granite intrusions and seem to be formed by Na-rich hydrothermal fluids (Abdel-Rahman, Reference Abdel-Rahman2006). The wolframite-bearing quartz veins are associated with extensive alkali alteration superposed by greisenization and silicification. Disseminated wolframite is present in alteration zones.
3. Petrography
3.a. Granodiorite
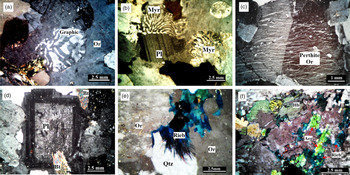
The granodiorite of equigranular texture consists of plagioclase (53 vol. %), quartz (15 vol. %), K-feldspar (13 vol. %), hornblende (9 vol. %), biotite (6 vol. %), with limited amounts of secondary chlorite, epidote and sericite. Accessory minerals are mainly titanite and apatite. Plagioclase has oligoclase composition (An15–20), commonly euhedral to subhedral tabular and prismatic crystals with grain-size up to 4.5 mm in length and 2 mm in width. Plagioclase crystals frequently display carlsbad twinning. The large plagioclase crystals are characterized by numerous inclusions of quartz and hornblende. Plagioclase crystals are commonly altered to sericite. Quartz exists as anhedral granular grains showing undulose extinction and cracks. Quartz occasionally occurs as small crystal inclusions in orthoclase, giving graphic and micrographic textures (Fig. 4a). K-feldspars are represented mainly by orthoclase, whereas microcline is rarely observed. K-feldspars are subhedral to anhedral tabular crystals with dimensions up to 1.4 mm in length and 0.6 mm in width. Myrmekitic texture appears at the contact between K-feldspars and plagioclase crystals (Fig. 4b). Biotite occurs as prisms or irregular tabular flakes up to 3 mm in diameter. Biotite is partially or completely altered to chlorite ± opaques along cleavage planes. Subhedral to anhedral hornblende crystals range in colour from brown to green and are medium- to fine-grained up to 2 mm in length and 1.4 mm in width. Sometimes hornblende is altered to chlorite and appears associated with epidote, titanite and iron oxides. Titanite is a relatively abundant accessory mineral and occurs as an alteration product of the iron oxides as well as rhombic-shaped primary magmatic titanite. Apatite occurs as short euhedral prismatic crystals enclosed in plagioclase, biotite and hornblende. Iron oxides are present as small irregular grains randomly scattered throughout the rock.
Photomicrographs of (a) graphic intergrowth texture of quartz in orthoclase (Or) (granodiorite), crossed-nicols (XPL); (b) myrmekitic texture (Myr) (granodiorite), Pl = plagioclase, XPL; (c) perthitic texture in orthoclase (Or) with carlsbad twinning (monzogranite), XPL; (d) zoned plagioclase crystal (Pl) altered to kaolinite and sericite in the core (monzogranite), Bt = biotite, XPL; (e) acicular riebeckite (Rieb) showing indigo blue interference colour (alkali riebeckite granite), Or = orthoclase, Qtz = quartz, XPL; (f) emerald green aegirine (Aeg) associated with riebeckite (Rieb) and hornblende (Hb) (alkali riebeckite granite), XPL.

3.b. Monzogranite
Monzogranite is leucocratic with porphyritic texture and is characterized by the presence of oval-shaped xenoliths of monzodioritic composition. Monzogranite consists of K-feldspar (39 vol. %), quartz (20 vol. %), plagioclase (28 vol. %) and a small amount of biotite (10 vol. %). Chlorite, sericite and epidote are secondary minerals, whereas accessories are titanite, zircon, apatite and iron oxide.
K-feldspar of perthitic texture (vein-, flame-like; Fig. 4c) is the most abundant mineral. The K-feldspar crystals are tabular and most of them are turbid and clouded with clay minerals and/or sericite. Plagioclase (An11–23) occurs as medium-grained subhedral crystals with an average of 2 mm in diameter. Most plagioclase crystals show well-developed albite and carlsbad twinning. Some zoned plagioclase crystals display a sieve texture where the cores are more altered than the rims to sericite (Fig. 4d). Quartz is subhedral to anhedral coarse-grained up to 5.5 mm in diameter. Quartz also occurs as fine-grained anhedral grains in the form of aggregates. Biotite commonly occurs as subhedral to anhedral flakes with zircon, apatite and muscovite inclusions, while some of the biotite grains are partially altered to chlorite.
3.c. Alkali riebeckite granite
The alkali riebeckite granite has an equigranular texture; it consists of K-feldspar (56 vol. %) and quartz (30 vol. %) with rare plagioclase (5 vol. %). Amphiboles are represented by riebeckite and hornblende (5 vol. %), while pyroxene exists in the form of aegirine (1 vol. %). Accessory minerals are zircon and iron oxides. K-feldspar occurs as coarse- and medium-grained subhedral crystals up to 6 mm in length and 3.5 mm in width. K-feldspar crystals display flame-, vein- and patch-like perthitic cross-hatched microcline. Sometimes, K-feldspar is intergrown in plagioclase, forming antiperthite. Quartz often occurs as coarse-grained anhedral crystals of oval and globular shapes and fills the interstitial spaces between K-feldspar grains. Riebeckite and hornblende are coarse-grained, subhedral to anhedral prismatic and strongly pleochroic. Some riebeckite crystals occur as acicular aggregates (Fig. 4e). Emerald green pleochroic grains of aegirine are present, associated with hornblende and riebeckite (Fig. 4f). Subhedral crystals of plagioclase show albitic composition (An10–15), and occur in prismatic form. Some twinned and zoned plagioclase crystals display sieve texture showing altered cores in contrast to the relatively fresh rims.
4. Geochemistry
4.a. Analytical techniques
Whole-rock chemical analyses of 26 representative samples (Fig. 2c), mostly from the least altered and fresh granites, were carried out in the Abu Kharif study area (eight samples of granodiorite, eight samples of monzogranite, nine samples of alkali riebeckite granite and one from a xenolith within monzogranite). Major oxides were analysed at the central laboratories of the Egyptian Mineral Resources Authority, Cairo, Egypt, using Philips X-ray fluorescence spectrometer (XRF) model PW2404 equipped with an Rh radiation tube operated at 40 kV and 70 mA and six analysing crystals (LIF-200, LIF-220, TIAP, Ge, PET, PXL). The analysed element concentrations were determined using Super Q and Semi Q software programs with 99.99 % accuracy and 96.7 % confidence limit. Loss-on-ignition (LOI) was calculated by heating 3 g of rock powder in a porcelain crucible at about 1000 °C for 4 hours. The difference between initial and final weights was used to compute the weight per cent total volatile content of the rock.
On the other hand, the trace and rare earth elements were analysed at the Acme analytical laboratories, Canada, using inductively coupled plasma mass spectrometry (ICP-MS). The accuracy and precision of the analytical results are in the range 1–3 % for major elements and less than 3 % for trace elements. The results of the chemical analyses are given in Tables 1, 2.
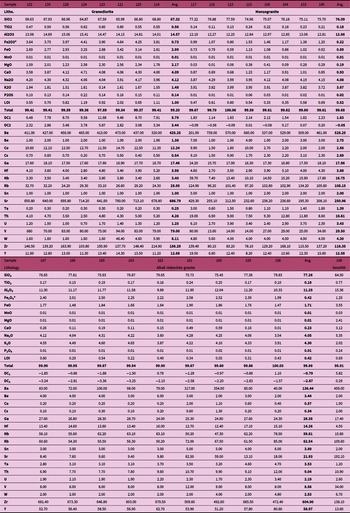
Major oxides (wt %) and trace-element (ppm) values of the Abu Kharif granitoid rock types

Fe2O3* = total iron as ferric; DC1 and DC2 = discrimination parameters of Agrawal (Reference Agrawal1995).
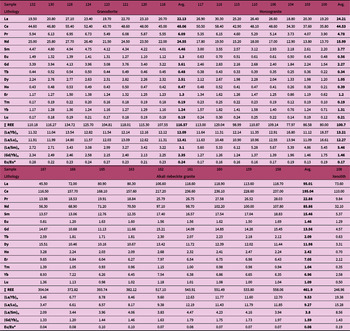
Rare earth elements (ppm) values of the Abu Kharif granitoid rock types

Eu/Eu* = [Eun/(Smn + Gdn)]/2.
4.b. Results
4.b.1. Major and trace elements
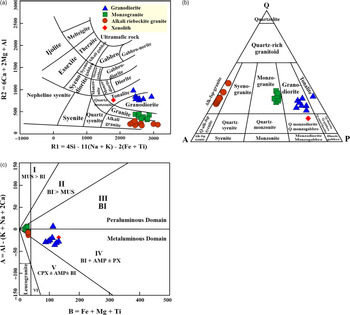
On the R1–R2 classification diagram (De la Roche et al. Reference De la Roche, Leterrier, Granclaude and Marchal1980), granites from the three intrusions plot in granodiorite, granite and alkali granite fields. Exceptions are two samples (# 124 and 108) which plot in tonalite fields (Fig. 5a). On the QAP ternary diagram of Streckeisen (Reference Streckeisen1974), the studied samples were plotted in the granodiorite, monzogranite and alkali–feldspar granite fields (Fig. 5b). The studied Abu Kharif granite rock types have low normative corundum contents (<1 %). The A-B multi-cationic diagram of Debon and Le Fort (Reference Debon and Le Fort1983) shows the distinct metaluminous character of all the granodiorite samples except for one sample which shows peraluminous affinity (Fig. 5c). On the other hand, the monzogranite samples vary from peraluminous to slightly metaluminous while the alkali riebeckite granite samples are metaluminous except for one sample (# 153) located in the peraluminous domain. According to the plotting position of monzogranite and alkali riebeckite granite, they form an aluminous association (leucogranite field), while the granodiorite forms a cafemic association (field IV) (Fig. 5c).
Geochemical classification of studied granite rock types. (a) The classification of the studied granite rock types using the parameters R1–R2 (De la Roche et al. Reference De la Roche, Leterrier, Granclaude and Marchal1980). (b) The QAP diagram (Streckeisen, Reference Streckeisen1976) showing the studied granite rock types according to their CIPW normative mineral compositions. Q = quartz, A = alkali feldspar and P = plagioclase feldspar, Alk-fsp-granite = alkali feldspar granite. (c) A–B multicationic diagram (Debon & Le Fort, Reference Debon and Le Fort1983). Each of the six sectors, I–VI, corresponds to a specific mineral composition. MUS = muscovite, BI = biotite, AMP = amphibole, PX = pyroxene and CPX = clinopyroxene.

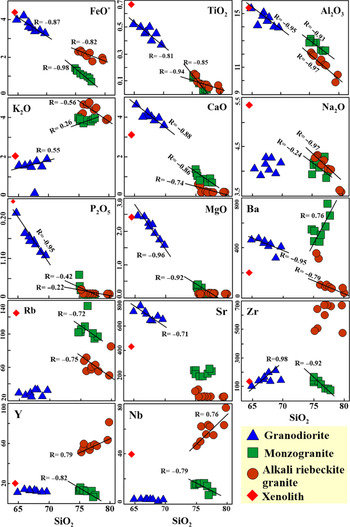
The studied granite types show some significant differences in major- and trace-element composition, particularly in the case of the granodiorite relative to the monzogranite and the alkali riebeckite granite (Tables 1, 2; Fig. 6). For all the granite rock types, the variation diagrams do not show continuous coherent trends for major- and trace-element concentrations (Fig. 6). Additionally, there is a compositional gap (69–74 wt % SiO2) between the granodiorite and both the monzogranite and the alkali riebeckite granite (Fig. 6).
Major- and trace-element Harker diagrams for the studied granodiorite, monzogranite and alkali riebeckite granite in the Abu Kharif area.

Major-elements Harker diagrams (Fig. 6) for the granodiorite, monzogranite and alkali riebeckite granite show that the Al2O3, FeO*, TiO2 and CaO oxides have well-defined negative correlation with SiO2. The Na2O versus SiO2 plot shows scattered trends for the granodiorite and a negative trend for the monzogranite and the alkali riebeckite granite. On the K2O versus SiO2 plot, the granodiorite and the monzogranite samples have a slightly positive correlation while the alkali riebeckite granite samples show a slightly negative trend (Fig. 6). The MgO versus SiO2 diagram shows that the granodiorite and the monzogranite samples correlated negatively with silica while there is no variation in the alkali riebeckite granite samples (Fig. 6). On the P2O5 versus SiO2 plot, the granodiorite samples have negative correlation, while the monzogranite and the alkali riebeckite granite are nearly unchanged with silica variation due to very low contents (Fig. 6).
For the trace elements, the variation diagrams of the granodiorite show that the elements Ba and Sr have negative correlation with silica while Zr has positive correlation (Fig. 6). On the other hand, Nb, Rb and Y values are nearly constant as silica increases (Fig. 6). For the monzogranite, Rb, Nb, Y and Zr are correlated negatively with SiO2 while Ba has a slightly positive correlation. The Sr–SiO2 plot shows a scattered trend (Fig. 6). Ba and Rb Harker diagrams for the alkali riebeckite granites display decreasing trends with increasing silica while Nb and Y diagrams have positive trends. On the other hand, Sr and Zr diagrams show scattered behaviour (Fig. 6). Additionally, many samples of the studied granite plutons contain high W contents. The average contents of W in the granodiorite, monzogranite and alkali riebeckite granite are 8.11 ppm, 4.3 ppm and 2.53 ppm, respectively (Table 2). One xenolith sample in monzogranite displays 6.7 ppm W content (Table 2).
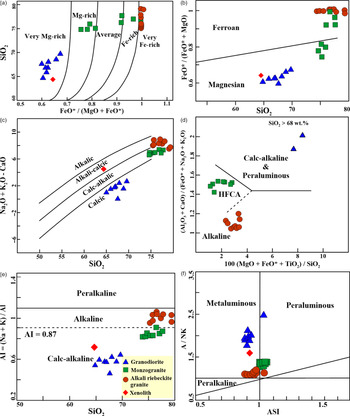
Following the classifications of Dewitt (Reference Dewitt, Jenney and Raynold1989) and Frost et al. (Reference Frost, Barnes, Collins, Arculus, Ellis and Frost2001) (Fig. 7a, b, respectively), the granodiorite is very Mg-rich while the monzogranite has a wide range between Mg-rich and Fe-rich except for one sample which plots in the field of very Fe-rich. On the other hand, the alkali riebeckite granite is characterized by high Fe# (0.99–1.00) and plots in the very Fe-rich field (Fig. 7a, b).
(a) SiO2 versus FeO*/(MgO + FeO*) classification diagram (Dewitt, Reference Dewitt, Jenney and Raynold1989). (b) FeO*/(FeO* + MgO) versus SiO2 diagram (Frost et al. Reference Frost, Barnes, Collins, Arculus, Ellis and Frost2001). The dividing line is after Frost and Frost (Reference Frost and Frost2008). (c) (Na2O + K2O – CaO) versus SiO2 diagram (Frost & Frost, Reference Frost and Frost2008). (d) (Al2O3 + CaO)/(FeO* + Na2O + K2O) versus 100 (MgO + FeO* + TiO2)/SiO2 diagram (Sylvester, Reference Sylvester1989). HFCA = highly fractionated calc-alkaline granites. (e) Agpatic index (AI) vs SiO2 diagram. The dashed line with AI = 0.87 (Liégeois & Black, Reference Liégeois, Black, Fitton and Upton1987) separates alkaline and calc-alkaline series. (f) Molar Al2O3/(Na2O + K2O) (A/NK) vs alumina saturation index (ASI) (ASI = Al2O3/(Na2O + K2O + CaO) (Zen, Reference Zen1986).

In the (Na2O + K2O − CaO) vs SiO2 diagram of Frost and Frost (Reference Frost and Frost2008), the granodiorite plots in the calcic field, whereas the monzogranite is restricted to the calc-alkalic field. On the other hand, the alkali riebeckite granite samples straddle the alkali–calcic and calc-alkaline fields (Fig. 7c). The alkaline affinity of the individual granitic series is indicated by the diagram of Sylvester (Reference Sylvester1989) which is used for rocks with SiO2 ≥ 68 wt % and discriminates between alkaline, calc-alkaline and highly fractionated calc-alkaline granites (Fig. 7d). In this diagram, two samples (# 132 and 118) of the granodiorite fall in the calc-alkaline field while the rest of the samples plot out of the diagram since they have SiO2 content less than 68 wt %. The monzogranite samples plot in the highly fractionated calc-alkaline granites field, and the alkali riebeckite granite samples plot in the alkaline field (Fig. 7d). According to the agpatic index (AI = Na + K/Al) of Liégeois and Black (Reference Liégeois, Black, Fitton and Upton1987), the monzogranite and the granodiorite samples have average agpatic indices (AIs) of 0.86 and 0.58, respectively, and are thus classified as calc-alkaline granites. The agpatic index of the alkali riebeckite granites (AI = 1.01) is in accordance with their alkaline affinity (Fig. 7e). On A/NK (A/NK = molar ratio (Al2O3/(Na2O + K2O)) versus alumina saturation index (ASI) diagram (Zen, Reference Zen1986), the granodiorite and the alkali riebeckite granite are metaluminous while the monzogranite samples plot at the boundary between the metaluminous and the peraluminous domains (Fig. 7f).
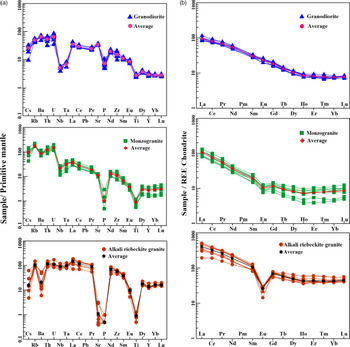
The studied samples are characterized by a left-inclined mantle-normalized diagram caused by the enrichment of both Pb and large-ion lithophile elements (LILEs) such as Rb, Th and U, along with depletion in the high-field strength elements (HFSEs) (Fig. 8a). The mantle-normalized spider diagram of the granodiorite is characterized by deep Nb–Ta negative anomalies and moderate to weak negative P and Ti anomalies (Fig. 8a). On the other hand, the monzogranite pattern is characterized by strong negative P anomalies and moderate Ti, Nb and Ba negative anomalies (Fig. 8a). Lastly, the multi-elements pattern of the alkali riebeckite granite is characterized by strong depletion in Sr, P and Ti concentrations and moderate depletion of Ba concentration (Fig. 8a).
(a) Primitive-mantle-normalized trace-element spider diagrams for the Abu Kharif granodiorite, monzogranite and alkali riebeckite granite. Chondrite-normalizing factors are from McDonough and Sun (Reference McDonough and Sun1995). (b) REE patterns for the Abu Kharif granite rock types. Normalization values are after McDonough and Sun (Reference McDonough and Sun1995).

4.b.2. Rare earth elements
The chondrite-normalized REE patterns of the three granite rock types (Fig. 8b) are characterized by higher light rare earth elements (LREE) abundances (average (La/Sm)n = 3.10 for granodiorite, 5.46 for monzogranite and 3.80 for alkali riebeckite granite) than for the heavy rare earth elements (HREE) (average (Gd/Yb)n = 2.35 for granodiorite, 1.46 for monzogranite and 1.59 for alkali riebeckite granite) (Fig. 8b; Table 2). The granodiorite is characterized by a smooth pattern with no Eu anomaly (Fig. 8b; Table 2). On the other hand, the monzogranite REE pattern shows a steeper slope compared to granodiorite and alkali riebeckite granite ((La/Yb)n = 13.21, 12.09 and 9.53, on average, respectively) (Fig. 8b). The alkali riebeckite granite pattern displays a stronger negative Eu anomaly than the monzogranite (average (Eu/Eu*) = 0.08, 0.17, respectively) (Fig. 8b). The alkali riebeckite granite samples have higher total REE contents than the granodiorite and the monzogranite samples (average ∑REE = 461.90 ppm, 116.58 ppm and 100.70 ppm, respectively).
5. Discussion
5.a. Granite types and tectonic environment
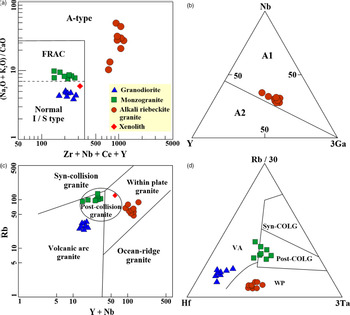
The granodiorite of the Abu Kharif area has petrological and geochemical characteristics of typical I-type granites (according to I-type described by Chappell & White, Reference Chappell and White1974; White & Chappell, Reference White and Chappell1983; Whalen et al. Reference Whalen, Currie and Chappell1987). However, the monzogranite and alkali riebeckite granite share some significant similarities to highly fractionated I-type and/or A-type granites. Both are characterized by high contents of SiO2, alkalis, Fe#, Rb, Nb and Y and low contents of MgO and CaO (Tables 1, 2). Nevertheless, the monzogranite plots entirely in the field of highly fractionated I-type granites defined by Sylvester (Reference Sylvester1989) and Whalen et al. (Reference Whalen, Currie and Chappell1987) (Figs. 7, 9a, respectively). On the other hand, the alkali riebeckite granite samples plot entirely in the field of A-type granite (Fig. 9b). Eby (Reference Eby1990, Reference Eby1992) subdivided the A-type magmas into two groups: A1, which represents differentiates of mantle-derived oceanic island basalts (anorogenic or rift zone magmas), and A2, which represents mainly crustal magmas of post-orogenic to anorogenic setting.
Granite type and tectonic discrimination diagrams for the studied samples of Abu Kharif granite rocks. (a) (Na2O + K2O)/CaO versus Zr + Nb + Ce + Y discrimination diagram (Whalen et al. Reference Whalen, Currie and Chappell1987). FRAC = fractionated I-type granites. (b) Y–Nb–3Ga (ppm) A-type granite discrimination ternary diagram (Eby, Reference Eby1992) showing the A1 nature of the studied alkali riebeckite granite. (c) Y + Nb versus Rb plot (Pearce et al. Reference Pearce, Harris and Tindle1984). The middle ellipse marks post-collision granites after Pearce (Reference Pearce1996). (d) Ternary Rb–Hf–Ta diagram (Harris et al. Reference Harris, Pearce, Tindle, Coward and Ries1986) for the Abu Kharif granitoid rocks. Syn-COLG (syn-collision granite); VA (volcanic arc granite); WP (within-plate granite); Post-COLG (post-collision granite).

On the primitive-mantle-normalized diagram (Fig. 8a), the granodiorite is characterized by enrichment of LILE relative to HFSE and negative Ta–Nb anomaly; these features were ascribed to volcanic arc granite (Pearce et al. Reference Pearce, Harris and Tindle1984) formed by subduction-related processes (Saunders et al. Reference Saunders, Tarney, Marsh, Wood and Panayioteu1980). Moreover, the low TiO2 concentration (<1 wt %) is consistent with volcanic-arc granite (Green, Reference Green1980). However, the monzogranite has higher Ta/Zr and Ta/Hf ratios (0.01 and 0.3, on average, respectively) than those of volcanic-arc intrusions (Harris et al. Reference Harris, Pearce, Tindle, Coward and Ries1986) as well as slightly higher K, Rb, Ba and Sr contents approaching those of collision granites from the Eastern Desert of Egypt (e.g. Moghazi, Reference Moghazi2002). The alkali riebeckite granite has Y/Nb < 1.2 (A1-subtype), suggesting its anorogenic environment (Eby, Reference Eby1992). The high Fe# (0.99–1.00) for the alkali riebeckite granite is also typical of an anorogenic-related regime (Anderson & Cullers, Reference Anderson and Cullers1978). Moreover, the alkali riebeckite granite is characterized by high K2O, Th, Nb, Ta and low Ba, Sr, Ti and Eu concentrations, similar to those of anorogenic rift-related granite (Harris et al. Reference Harris, Pearce, Tindle, Coward and Ries1986; Pearce, Reference Pearce1996). The tectonic setting discrimination between the three studied granite intrusions is supported by further diagrams of Rb vs Y + Nb (Fig. 9c) and Rb–Ta–Hf (Fig. 9d). Additionally, Agrawal (Reference Agrawal1995) suggested multivariate discriminant analyses, using major-elements composition to distinguish between anorogenic and orogenic granites as well as the orogeny subclasses late-orogenic and post-orogenic. The discriminant rules proposed by Agrawal (Reference Agrawal1995) show that the granodiorite and the monzogranite are of orogenic nature (DC1 is a positive quantity). The granodiorite is further classified as late-orogenic (DC2 is a positive quantity) and the monzogranite as post-orogenic (DC2 is a negative quantity). On the other hand, the alkali riebeckite granite is of anorogenic nature (DC1 is a negative value) (Table 1).
5.b. Petrogenesis of the magmatic units
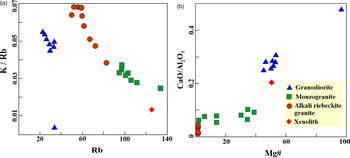
The genetic relationship between different types of Pan-African Egyptian granites still remains a matter of debate. Many geochemical observations indicate that the Abu Kharif granite rocks were emplaced from different magma types in different tectonic settings. Major- and trace-element variation diagrams define the Ediacaran monzogranite and Cambrian alkali riebeckite granite as not representing the fractionation end-member of the Cryogenian granodiorite, where samples from the granite rock types show consistent trends, but with a compositional gap (Fig. 6). Such geochemical variations may indicate that magmatic types in the Abu Kharif area are not genetically related. Variation diagrams of K/Rb vs Rb and CaO/Al2O3 vs Mg# do not show colinear variation between the studied granite types (Fig. 10a, b). The variation in value of Zr/Nb ratio between the granodiorite, monzogranite and alkali riebeckite granite (47.12, 8.57 and 10.29, on average, respectively), where both Zr and Nb are strongly incompatible elements in alkaline magmas (McDonald et al. Reference McDonald, Davies, Bliss, Leat, Bailey and Smith1987), indicates that these rock types are evolved from different magma sources. In addition, the chondrite-normalized REE patterns for the studied intrusions show that the granodiorite pattern displays a general decrease in concentrations from La to Lu without Eu anomalies. On the other hand, the monzogranite and alkali riebeckite granite have a conspicuous fractionated pattern with flat HREE and a marked negative Eu anomaly (Fig. 8b).
(a) Rb versus K/Rb variation diagram for the studied granite rock types. (b) CaO/Al2O3 versus Mg# variation diagram for the studied granite rock types.

The tectonic settings of the granite intrusions in the Abu Kharif area are late-orogenic, post-orogenic and anorogenic for the granodiorite, monzogranite and alkali riebeckite granite, respectively, according to geochemical characteristics (Fig. 9c, d; Table 2). The anorogenic alkali riebeckite granite points to an emplacement into Pan-African crust following the Pan-African orogenic cycle (Abdel-Rahman & El-Kibbi, Reference Abdel-Rahman and El-Kibbi2001; Abdel-Rahman, Reference Abdel-Rahman2006).
Since the studied Abu Kharif magmatic units display metaluminous to slightly peraluminous affinities and have low normative corundum contents (<1 %), they have not been formed by partial melting of metapelitic source which would lead to strongly peraluminous magmas (Jung et al. Reference Jung, Mezger and Hoernes1998). Likewise, the TiO2/Zr ratios of the studied granite rock types vary little compared to those of potential metasedimentary origin (Garcia et al. Reference Garcia, Fonteilles and Moutte1994).
5.b.1. Origin of the granodiorite
Several genetic models have been proposed to discuss and explain the origin, source and development of granite rocks in the Nubian Shield. These models suggest that the I-type Cryogenian granodiorite was generated through either fractionation from mantle-derived magmas in subduction settings, or from melting of lower mafic crust (El-Sayed, Reference El-Sayed1998; Furnes et al. Reference Furnes, El-Sayed, Khalil and Hassanen1996; El-Shazly & El-Sayed, Reference El-Shazly and El-Sayed2000; El-Sayed et al. Reference El-Sayed, Furnes, Obeid and Hassanen2001). In the Eastern Desert of Egypt, the I-type granodiorite rocks are chronocorrelated with the mantle-derived metagabbro–diorite complexes of the island-arc stage, which are frequently considered as their magmatic precursor (El-Sayed, Reference El-Sayed2003; Basta et al. Reference Basta, Maurice, Bakhit, Azer and El-Sobkyf2017).
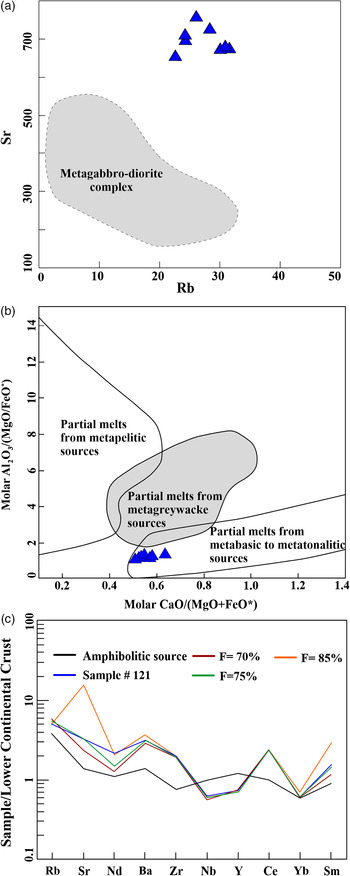
Several lines of evidence argue against the hypothesis that the investigated granodiorite rocks were produced by extensive fractional crystallization of a mantle-derived mafic magma, represented by the island-arc metagabbros in the Eastern Desert (∼850–750 Ma; Furnes et al. Reference Furnes, El-Sayed, Khalil and Hassanen1996). These evidences include: (1) high Sr, CaO and Ba abundances (687 ppm, 4.09 wt % and 426 ppm, on average, respectively) and the lack of a significant Eu anomaly require a high percentage of melting and the elimination of all or most of the feldspar by melting; (2) granite melts derived from the extreme fractional crystallization of a gabbroic magma are characterized by strong enrichment in many HFSE (Turner et al. Reference Turner, Foden and Morrison1992), which is not the case for the investigated granodiorites (Fig. 8a); (3) the absence of a collinear trend between the gabbro–diorite complex and the investigated granodiorite argue against its relation to the gabbro–diorite complex through fractional crystallization (Fig. 11a); and (4) in the Abu Kharif area, I-type granodiorite in large volumes is associated with only minor metagabbro–diorite rocks.
(a) Rb versus Sr diagram of the granodiorite rocks in the Abu Kharif area. The field of the gabbro–diorite complex is from El-Sayed (Reference El-Sayed2003). (b) Molar Al2O3/(MgO + FeO*) versus molar CaO/(MgO + FeO*) diagram (Altherr et al. Reference Altherr, Holl, Hegner, Langer and Kreuzer2000). Outlined fields denote compositions of partial melts obtained in experimental studies by dehydration melting of various bulk compositions (Wolf & Wyllie, Reference Wolf and Wyllie1994; Douce & Beard, Reference Douce and Beard1995, Reference Douce and Beard1996; Gardien et al. Reference Gardien, Thompson, Grujic and Ulmer1995; Douce, Reference Douce1996; Singh & Johannes, Reference Singh and Johannes1996; Thompson, Reference Thompson1996; Douce & McCarthy, Reference Douce, McCarthy, Hacker and Liou1998). (c) Trace-element modelling for the granodiorite. The compositions of melt derived by 70 %, 75 % and 85 % melting of average amphibolitic source to produce the least evolved granodiorite (sample# 121) are shown. Normalization values of lower continental crust are after Taylor and McLennan (Reference Taylor and McLennan1995). Symbols as Figure 10.

The generation of Abu Kharif granodiorite by partial melting of lower crustal rocks seems to be a more feasible hypothesis. The molar CaO/(MgO + FeO*) versus Al2O3/(MgO + FeO*) diagram (Altherr et al. Reference Altherr, Holl, Hegner, Langer and Kreuzer2000) indicates that the granodiorite could be derived by melting of a mafic source (Fig. 11b). The granodiorite hosts amphibolitic xenoliths, zoned and twinned core plagioclase crystals and poikilitic biotite crystals. These features may reflect that batch partial melting of a basic source played an important role in the genesis of the granodiorite. Thus, the amphibolitic xenoliths can be considered as restites (refractory residues) remaining after high degrees of partial melting of an amphibolitic source.
In order to test our model regarding the generation of the investigated granodiorite via partial melting of lower amphibolitic crustal source, we used the non-model batch partial melting equation of Shaw (Reference Shaw1970): CL = C0/[D0 + F(1−P)], where CL is the concentration of the trace element in the melt, C0 the concentration in the source, F the melt fraction, D0 the bulk distribution coefficient for the starting assemblage, and P is the bulk distribution coefficient of the minerals that make up the melt. The results of Rb, Ba, Sr, Nd, Ba, Zr, Nb, Y, Ce, Yb and Sm batch partial melting modelling of mafic source using the average content of the amphibolitic rocks (Furnes et al. Reference Furnes, El-Sayed, Khalil and Hassanen1996) are presented in Table 3. The results indicate a close match between the modelled trace elements by ∼75 % melting of amphibolitic source and those in the least evolved granodiorite sample (# 121) (Table 3; Fig. 11c).
Results of trace-element non-modal partial melting modelling for different degrees of amphibolitic source melting

Amphibolite composition is after Furnes et al. (Reference Furnes, El-Sayed, Khalil and Hassanen1996). Observed melt = compositions of the least evolved sample of the granodiorite (sample# 121). The distribution coefficients used are after GERM (Geochemical Earth Reference Model; http://www.earthref.org/GERM). D0 = bulk distribution coefficient for the starting assemblage; P = bulk distribution coefficient of the minerals that make up the melt; F = melt fraction.
Although the quantitative trace-elements batch melting model can explain most of the chemical variation in the granodiorite, there are some geochemical characteristics suggesting that fractional crystallization may have played a role in the evolution of the granodiorite (Fig. 8a). The low content of Nb, Zr and Y (3 ppm, 156 ppm and 13 ppm, on average, respectively) suggests that the fractionation of accessory minerals contributes to the evolution of the granodiorite. Negative Ti anomalies reflect the fractionation of Ti-bearing minerals (Wang et al. Reference Wang, Huang, Pang, Zha and Zhou2014) while negative P anomalies should result from apatite and/or monazite crystallization. Negative Nb and Ta result from rutile separation (Foley et al. Reference Foley, Barth and Jenner2000).
Major-elements geochemical modelling software of Wright and Doherty (Reference Wright and Doherty1970) was used to constrain the proposed role of the fractional crystallization hypothesis. The results of the calculations and the compositions of the fractionating minerals are given in Table 4. The results show that the most evolved sample of the granodiorite (sample# 132) could be produced by 11 % fractional crystallization of the least evolved sample (sample# 121). The fractionated phases are 5.19 % hornblende, 5.05 % biotite, 0.39 % apatite and 0.14 % titanite (Table 4). Thus, the granodiorite was generated by ∼75 % batch partial melting of amphibolitic source followed by fractional crystallization of hornblende, biotite, apatite and titanite.
Results of fractionation modelling for the granodiorite based on the method of Wright and Doherty (Reference Wright and Doherty1970)

Parent (sample# 121) = 88.6 % daughter (sample# 132) + 5.19 % hornblende + 5.05 % biotite + 0.39 % apatite + 0.14 % titanite.
Fractionating phases (10.77 %): 48.19 % hornblende, 46.89 % biotite, 3.6 % apatite and 1.3 % titanite.
R 2 = 1.7.
The compositions of the used fractionating phases hornblende and biotite are after MM El-Sayed (unpub. PhD thesis, Alexandria Univ., 1994), while the compositions of titanite and apatite are after Deer et al. (Reference Deer, Howie and Zussman1978). R 2: sum of squares of the residual.
5.b.2. Origin of the monzogranite
The post-orogenic highly fractionated monzogranite is characterized by hosting xenoliths of dioritic composition. The dioritic xenoliths display lower SiO2 (64.5 wt %) and higher Al2O3 (15.36 wt %), MgO (2.41 wt %), FeO* (4.33 wt %) and TiO2 (0.77 wt %) than those of the host monzogranites (Table 1). These features indicate calc-alkaline affinity for the dioritic xenoliths (Juan & Xin, Reference Juan and Xin2009).
The lack of disequilibrium textures such as patchy zoned plagioclase and pyroxene cores in hornblende and absence of acicular apatite preclude a genetic relation of the monzogranite and the captured xenoliths through a mingling–mixing process (El-Sayed, Reference El-Sayed2003). In the Harker diagrams, the major and trace elements of the xenolith plotted off the linear trend with their host monzogranite (Fig. 6), which precludes neither fractional crystallization nor mixing as a mafic–felsic magma evolution process. These features may suggest that the dioritic xenoliths are rocks dragged during ascent of the magma to crustal levels.
The highly evolved composition of the monzogranite and absence of any basic rocks associated with it argue against its generation by fractional crystallization from a parental mafic magma. Based on petrological and geochemical data, the most acceptable mechanism for the origin of the monzogranite is crustal anatexis. For the Arabian Nubian Shield, two types of Pan-African crusts are proposed by Abdel-Rahman and Martin (Reference Abdel-Rahman and Martin1990), namely non-metasomatized and metasomatized calc-alkaline granitic rocks. The REE pattern of the calculated melt produced by 62 % batch partial melting of normal ‘non-metasomatized’ Pan-African calc-alkaline granitic rocks (Abdel-Rahman, Reference Abdel-Rahman2006) is consistent and matches the REE pattern of the studied highly fractionated monzogranite (Fig. 12).
Chondrite-normalized diagram showing the calculated REE patterns for melts produced by 62 % batch partial melting of non-metasomatized Pan-African calc-alkaline granitic rocks. The REE composition of the source materials and their modal proportions are after Abdel-Rahman and El-Kibbi (Reference Abdel-Rahman and El-Kibbi2001). Shaded green pattern represents the REE field of the studied monzogranite. Normalization values are taken from Taylor and McLennan (Reference Taylor and McLennan1985).

The chemical data show that the monzogranite is evolved in composition, with SiO2 contents ranging from 74.96 wt % to 77.59 wt %, and exhibits a narrow compositional range (Table 1). The overall trends of major and trace elements of the monzogranite in the variation diagrams (Fig. 6) as well as the fractionated nature of its REE ((La/Lu)n = 12.27, on average) (Table 2) suggest that the magma has undergone a minor degree of internal differentiation. The monzogranite samples exhibit K/Rb ratios >160 (306, on average), indicating that a fractional crystallization process could have played a role in the genesis of the monzogranite (Shaw, Reference Shaw1968). The low content of MgO (0.19 wt %), Fe2O3* (1.21wt %), P2O5 (0.02 wt %) and depletion in Nb (17 ppm), Ta (1.39 ppm), TiO2 (0.18 wt %) and Eu (0.56 ppm) indicate the same. The strong P depletion suggests fractionation of apatite. Negative Nb–Ti anomalies are considered to be related to the separation of Ti-bearing phases. Strong Eu depletion requires extensive fractionation of plagioclase and/or K-feldspar. The investigated monzogranite displays negative Eu anomalies and is associated with negative Ba anomalies (Fig. 8a, b), which implies that the fractionation of the K-feldspar has the main role in this respect (Wilson, Reference Wilson2007).
Conventional, least-squares mixing major-elements geochemical modelling software of Wright and Doherty (Reference Wright and Doherty1970) can be used to test the role of the fractional crystallization process in the genesis of the monzogranite. The calculations show that the most evolved sample of the monzogranite (sample# 115) can be formed by 12 % fractional crystallization from the least-evolved sample (sample# 110) through crystallization of plagioclase (6.12 %), biotite (2.33 %), K-feldspar (2.39 %), magnetite (0.88 %) and ilmenite (0.11 %) (Table 5). Thus, the monzogranite was formed by 62 % batch partial melting of the normal (non-metasomatized) Pan-African crust of calc-alkaline granite composition followed by a minor role of crystallization of plagioclase, biotite, K-feldspar, magnetite, ilmenite, apatite and titanite.
Results of fractionation modelling for the monzogranite based on the method of Wright and Doherty (Reference Wright and Doherty1970)

Parent (sample# 110) = 88.59 % daughter (sample# 115) + 6.12 % plag. + 2.33 % biotite + 2.39 % K-feld. + 0.88 % Mag. + 0.11 % Ilm fractionated phases (11.83 %): 51.73 % plag., 19.7 % biotite, 20.2 % K-feld., 7.44 % Mag., 0.93 % Ilm.
R 2=1.17.
The composition of plagioclase, K-feldspar and biotite are after Moghazi et al. (Reference Moghazi, Emam and Abdel-Rahman2011), while the composition of magnetite and ilmenite are after Deer et al. (Reference Deer, Howie and Zussman1978). R 2: sum of squares of the residual.
5.b.3. Origin of the alkali riebeckite granite
Several models have been proposed for the genesis of the A-type anorogenic granites. These models include (1) fractional crystallization from mantle-derived basaltic magmas (Turner et al. Reference Turner, Foden and Morrison1992; Moghazi, Reference Moghazi1999; Mushkin et al. Reference Mushkin, Navon, Halicz, Hartmann and Stein2003; Frost & Frost, Reference Frost and Frost2010); (2) partial melting of lower crustal materials followed by fractional crystallization (Küster & Harms, Reference Küster and Harms1998; Jarrar et al. Reference Jarrar, Stern, Saffarinai and Al-Zubi2003; Abdel-Rahman, Reference Abdel-Rahman2006); (3) contamination of mafic mantle-derived melt by lower crustal components in an extensional environment (Frost et al. Reference Frost, Frost, Bell and Chamberlain2002; Wu et al. Reference Wu, Sun, Li, Jahn and Wilde2002); and (4) assimilation and magma mixing between anatectic crustal and mantle–derived mafic magmas (Yang et al. Reference Yang, Wu, Chung, Wilde and Chu2006; Barboni & Bussy, Reference Barboni and Bussy2013; Gao et al. Reference Gao, Zhao and Zheng2016).
The alkali riebeckite granite of the Abu Kharif area is characterized by the absence of xenoliths, sharp intrusive contacts with country rocks and absence of metasomatic effects, and homogeneous petrographic and geochemical nature. These features argue against the assimilation and magma-mixing hypothesis. The low Y/Nb (0.99, on average) and Yb/Ta (2.00, on average) ratios do not favour crustal contamination, which would have influenced these ratios (Wilson, Reference Wilson2007). The enriched unfractionated HREE pattern of the alkali riebeckite granite is inconsistent with batch melting of mantle-derived source (Stern & Gottfried, Reference Stern and Gottfried1986) and suggests a garnet-free source (Wilson, Reference Wilson2007). The high Rb/Sr (4.77, on average) ratio with high Y (58.97 ppm, on average) and HREE is incompatible with partial melting of lower crustal materials.
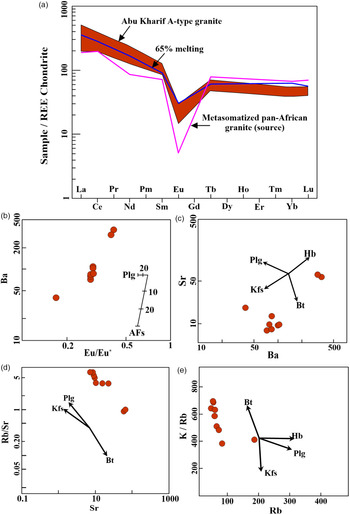
Fluid influx may have caused metasomatism of the Pan-African crust, possibly by a Na–F-rich fluid phase (Abdel-Rahman, Reference Abdel-Rahman2006). The volatile flux has catalysed the anatectic reactions near the base of the crust (Bailey, Reference Bailey and Sorenson1974). Abdel-Rahman (Reference Abdel-Rahman2006) proposed that the Abu Kharif alkali riebeckite granite was formed by partial melting of metasomatized Pan-African crustal granitic rocks. The REE pattern of the study Abu Kharif alkali riebeckite granite is similar to the REE pattern of calculated liquid produced by 65 % non-modal batch melting of metasomatized Pan-African calc-alkaline granites (Fig. 13a; Table 6).
(a) Chondrite-normalized diagram showing the matching of the REE field pattern of the studied A1-type alkali riebeckite granite with 65 % non-modal batch melting of metasomatized Pan-African granites. The composition of the metasomatized granite source is after Abdel-Rahman (Reference Abdel-Rahman2006). Normalization values are taken from Taylor and McLennan (Reference Taylor and McLennan1985). (b) Ba vs Eu/Eu* (Eby, Reference Eby1990); (c) Ba vs Sr (fractionation factors from Inger & Harris, Reference Inger and Harris1993); (d) Sr vs Rb/Sr (fractionation factors from Inger & Harris, Reference Inger and Harris1993); (e) Rb vs K/Rb. Plg = plagioclase, Hb = hornblende, Kfs = K-feldspar and Bt = biotite. Symbols as Fig. 10.

Results of rare earth elements non-modal batch melting modelling for different degrees of metasomatized Pan-African granite source

The metasomatized pan-African calc-alkaline source composition is after Abdel-Rahman and Martin (Reference Abdel-Rahman and Martin1990). Observed melt = compositions of the least evolved sample of the alkali riebeckite granite (sample# 160). The used distribution coefficients are after Rollinson (Reference Rollinson1993) and GERM (Geochemical Earth Reference Model; http://www.earthref.org/GERM). D0 = bulk distribution coefficient for the starting assemblage, P = bulk distribution coefficient of the minerals that make up the melt, F = melt fraction.
However, the high differentiation index (95.17), Rb (63 ppm), Nb (60 ppm), Y (59 ppm) and K/Rb ratio (586) and low Eu (1.46 ppm), Ba (136 ppm), Sr (22 ppm), CaO (0.23 wt %) and MgO (0.01 wt %) concentrations of the alkali riebeckite granite require fractional crystallization of magmatic liquid (Turner et al. Reference Turner, Foden and Morrison1992; Mao et al. Reference Mao, Xiao, Fang, WindLey, Sun, Ao, Zhang and Huang2014) as well as reflecting the role of the source composition (Clemens & Stevens, Reference Clemens and Stevens2012). The pronounced negative Eu, Sr and Ba anomalies in the chondrite-normalized and mantle-normalized diagrams (Fig. 8a, b) suggest that both plagioclase and K-feldspar fractionation played a major role in the genesis of the alkali riebeckite granite. Although the negative Eu anomaly was controlled by fractional crystallization of plagioclase, fractional crystallization of alkali feldspar seems more effective in controlling Ba abundances than that of plagioclase (Fig. 13b). The predominance of Na2O over K2O in the alkali riebeckite granite (Table 1) suggests fractionation of K-rich feldspar. In addition, the significant negative Ba, P and Ti anomalies for the alkali riebeckite granite (Fig. 8a) suggest the important role of K-feldspar and/or biotite, Fe–Ti oxide and apatite fractionation. In the fractionation diagrams (Fig. 13c, d, e), the chemical variation in the alkali riebeckite granite can be attributed to the fractional crystallization of mainly plagioclase and K-feldspar along with hornblende and biotite.
The fractional crystallization hypothesis for the chemical variation can be tested using the conventional least-squares mixing calculations devised by Wright and Doherty (Reference Wright and Doherty1970). The results of the calculations are given in Table 7. For calculations, the sample with the lower silica value (sample# 160) was used as the parent composition, and the sample with the higher silica value (sample# 153) as the daughter. The calculations show that sample# 153 could be produced from sample# 160 by 24 % crystallization of plagioclase (13.6 %), K-feldspar (7.2 %), amphibole (2.5 %) and biotite (0.06 %), with residual liquid (daughter) (75.5 %). So, the investigated alkali riebeckite granites in the Abu Kharif area were generated by 65 % batch melting of metasomatized Pan-African granite source followed by fractional crystallization of plagioclase, K-feldspar, amphibole and biotite with minor magnetite, apatite and titanite.
Results of fractionation modelling for the alkali riebeckite granite based on the method of Wright and Doherty (Reference Wright and Doherty1970)

Parent (sample# 160) = 75.49 % daughter (sample# 153) + 13.55 % plagioclase + 7.19 % K-feld. + 2.49 % Hb + 0.06 % biotite.
Fractionating phases (23.29 %): 58.18 % plagioclase, 30.87 % K-feldspar, 10.69 % amphibole and 0.24 % biotite.
R2 = 0.94.
Plagioclase and biotite compositions are after MM El-Sayed (unpub. PhD thesis, Alexandria Univ., 1994) while the composition of K-feldspar and amphibole are after Abdel-Rahman (Reference Abdel-Rahman2006). R 2: sum of squares of the residual.
5.c. The Abu Kharif intrusions as sources for tungsten mineralization
All major tungsten deposit types – among the rare metals – are associated with granitic intrusions or with medium- to high-grade metamorphic rocks (Brown & Pitfield, Reference Brown, Pitfield and Gunn2014). Generally, rare metals-bearing granites occur in subduction-related environments, but dominantly in a late-orogenic to post-orogenic setting (e.g. Richards, Reference Richards2011). The mineralized plutons are commonly identified as extremely fractionated alkaline granites, and their sources seem to be dominated by: (i) primary magmatic origin, where the prolonged crystallization of quartz and feldspar yields a late-stage magmatic fluid enriched in volatiles (H2O, F) and trace elements (e.g. Dostal & Chatterjee, Reference Dostal and Chatterjee1995; Agangi et al. Reference Agangi, Kamenetsky and McPhie2010), and (ii) secondary metasomatic origin, where a hydrothermal fluid, unrelated to the magma, could have leached the trace elements from the host rocks (Nurmi & Haapala, Reference Nurmi and Haapala1986). In both models, complexation of rare metals with volatiles such as F, Cl and CO2 can significantly increase the solubility of trace elements (Salvi & Williams-Jones, Reference Salvi, Williams-Jones, Linnen and Samson2005; Schönenberger et al. Reference Schönenberger, Köhler and Markl2008; Agangi et al. Reference Agangi, Kamenetsky and McPhie2010). Of particular interest, the F-bearing fluids have the ability to transport lithophile immobile elements as indicated by the presence of REE- and HFSE-bearing minerals (e.g. zircon and fluorite), especially in the alkali–feldspar granite. Another controversial issue is the source of tungsten. Generally, two sources have been suggested for tungsten mineralization in granitic magmas. These sources include mantle source from mafic magmas (e.g., Carten et al. Reference Carten, White and Stein1993; Audétat, Reference Audétat2010) and a predominant crustal source (e.g. Sinclair, Reference Sinclair2007; Mao et al. Reference Mao, Pirajno and Cook2011), where certain crustal rocks contain much more tungsten than mafic magmas. In the Earth’s continental crust, the average tungsten abundance is estimated to be 1.5 ppm (Rudnick & Gao, Reference Rudnick, Gao and Rudnick2003).
The enrichment mechanism of tungsten in the Abu Kharif area is controlled by many factors such as degree of rock fractionation, availability of volatiles (i.e. F and H2O), and structural elements (El-Desouky, Reference El-Desouky2005; Abdel-Rahman, Reference Abdel-Rahman2006). Tungsten is detected in all the studied granite plutons but with different degrees of enrichment (Table 2). The magma sources for the studied granite types are here considered to be the continental crust (Section 5.b. above). Therefore, the continental crust would be the W source. Many authors use the Zr/Hf ratio to investigate the degree of rare metals enrichment in the original magma, since Zr/Hf ratio is constant in most geological systems (Dostal & Chatterjee, Reference Dostal and Chatterjee1995; Linnen & Keppler, Reference Linnen and Keppler2002). However, the decrease of the Zr/Hf ratio in granitic melt is associated with enrichment in rare metals such as W, Mo, Sn, Bi, Be, Ta, Nb and Li, up to concentrations sufficient to form deposits (Zaraisky et al. Reference Zaraisky, Aksyuka, Devyatovaa, Udoratinab and Chevychelova2009). The whole-rock geochemical data of the studied granitic plutons show that the Zr/Hf ratios of the monzogranite (29.74 ppm, on average) are far lower than those for the granodiorite (39.14 ppm, on average) and the alkali riebeckite granite (42.58 ppm, on average). This may indicate that the monzogranite is originally more enriched in W compared to the granodiorite and alkali riebeckite granites. On the other hand, the alkali riebeckite granite is rich in silica and alkalis (Table 1) with geochemical signatures typical of an iron-rich and oxidized nature rather than the granodiorite and monzogranite. This iron-rich oxidized granite is considered a suitable rock for hosting tungsten, where W is an incompatible element and likely to remain in the residual melts and consequently is closely confined to the fractionated granite. Nevertheless, the alkali riebeckite granite in the Abu Kharif area shows low content of W (2.53 ppm, on average) compared to the granodiorite (8.11 ppm, on average) and monzogranite (4.3 ppm, on average) (Table 2). This may be a result of potential factors limiting W enrichment in the residual melts, such as W removal by exsolving fluids.
The field and petrographic investigations show that all granite intrusions in the study area have been affected by the magmatic-related hydrothermal fluids, but the monzogranite seems to be strongly affected by alteration in comparison with the granodiorite and alkali riebeckite granites. Textural and compositional evidences for hydrothermal alteration in the monzogranite are: (1) Na-metasomatism in the form of perthite crystals, where twinned and untwinned albite occurs as fine laths and rims around K-feldspar, suggesting albitization through interaction with hydrothermal fluids, (2) abundance of alteration minerals due to greisenization such as chlorite after biotite, sericite after feldspars, and silicification, (3) widespread occurrence of F-bearing minerals such as fluorite in the form of interstitial accessory mineral and veins cutting through granite indicating that F-rich fluids have affected the granites, and (4) intense silicification of the wall rocks and formation of the quartz veins. Geometric and textural features of quartz veins indicate multistage opening and mineralization being probably associated with the youngest stage in the paragenetic sequence.
The field study indicates that the wolframite-bearing quartz veins and associated alteration are displayed on a set of N40°E–S40°W-trending fracture-filling veins with low dip ranging from 8° up to 25° toward the NW. Therefore, the Abu Kharif wolframite mineralization is classified as the vein-type ores that are associated with late-stage hydrothermal activity. Progressive cooling of the fluids led to the precipitation of W; the amount of soluble tungsten in hydrothermal ore fluids falls rapidly with decreasing temperature and this is more pronounced at a temperature around 300 °C (Heinrich, Reference Heinrich1990). The late stage of the magmatic intrusions of the studied alkali riebeckite granite is associated with an abundance of hydrothermal fluids. These fluids are forced to move due to the pressure release caused by faulting along the NE–SW coevally formed shear zones.
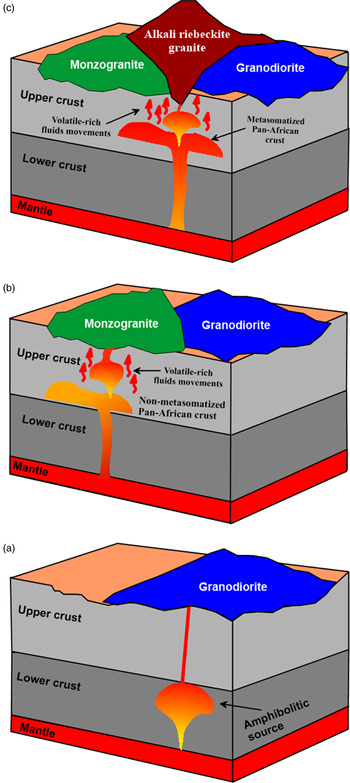
Based on the above discussion, a model for generation of granite rock types as well as tungsten mineralization in the Abu Kharif area can be proposed (Fig. 14). The studied granite types represent different magmatic pulses, where the granodiorite was derived from the melting of amphibolitic lower continental crust, whereas the monzogranite and alkali riebeckite granite were derived from the melting of Pan-African middle to upper continental crust (Fig. 14). These parent magmas were originally rich in W, but with different concentrations. The highly fractionated and oxidized nature and volatile content of monzogranite and alkali riebeckite granite provided a critical factor that affects W behaviour and led to the original enrichment in W. Prolonged fractional crystallization in the monzogranite and alkali riebeckite granite led the rest melt to become volatile enrichment (H2O, F). Progressive cooling of this magma was finalized by silica-rich fluids characterized by high viscosity, low density and enrichment in W and volatiles. These hydrothermal fluids could easily leach W from the wall rocks along the conduit (Fig. 14). The mineralized fluids were circulated through the fracture elements that dominated in the monzogranite rather than the other granitic plutons. Additionally, albitization, greisenization and silicification due to reactions of the circulating fluids with the wall rocks occur widely. Obviously, the intensity of alteration in monzogranite is more distinct than in the granodiorite and alkali riebeckite granite.
Sketch model illustrateing the genesis of contrasting granite rock types in the Abu Kharif area. (a) The Cryogenian granodiorite (∼650 Ma) was generated by batch partial melting of an amphibolitic source followed by fractional crystallization. (b) The Ediacaran wolframite-bearing monzogranite (610–580 Ma) was formed by batch partial melting of the normal ‘non-metasomatized’ Pan-African crust of calc-alkaline granite composition followed by fractional crystallization. (c) The Cambrian alkali riebeckite granite (522 Ma) was generated by batch partial melting of metasomatized Pan-African granite source followed by fractional crystallization.

6. Conclusions
The Abu Kharif area in the Northern Eastern Desert of Egypt comprises granodiorite, monzogranite and alkali riebeckite granite. The granodiorite is classified as late-orogenic I-type calc-alkaline granite, whereas the monzogranite is post-orogenic and has highly fractionated affinity. On the other hand, the alkali riebeckite granite displays anorogenic A1-subtype alkaline affinity. Field observations and chemical features indicate that the three granite rock types are not genetically related, but they represent separate magmatic pulses originated from different sources. The granodiorite was generated by ∼75 % melting of lower crustal amphibolitic source followed by fractional crystallization of hornblende, biotite, apatite and titanite. However, both the monzogranite and alkali riebeckite granite were produced by crustal anatexis of Pan-African granitic source. The monzogranite was formed by 62 % batch partial melting of non-metasomatized crust followed by a role of crystallization of plagioclase, biotite, K-feldspar, magnetite, ilmenite, apatite and titanite. On the other hand, the alkali riebeckite granite was produced by 65 % batch partial melting of metasomatized crust followed by fractional crystallization of plagioclase, K-feldspar, amphibole and biotite with minor magnetite, apatite and titanite.
The variation in W content in the original magmas seems to be controlled by the degree of rock fractionation and availability of volatiles such as F and H2O. The W enrichment in the monzogranite is interpreted to be formed by magmatic-related hydrothermal volatile-rich fluids. These hydrothermal fluids are suggested to be related to the youngest magma in the study area that produced the alkali riebeckite granite. Tungsten was transported through silica-rich aqueous fluids to the cupola of the magma chamber by the power of volatiles that ejected from the parental magma. The fluids are forced to move due to the pressure release caused by faulting along the NE–SW coevally formed shear zones.
Acknowledgements
The authors would like to express their deepest gratitude and appreciation to Dr Hassan El-Sundoly, Nuclear Materials Authority, for his great help and guidance during the field work. The journal editor and anonymous reviewers are gratefully acknowledged for their valuable suggestions which led to the improvement of the manuscript. This research received no specific grant from any funding agency, commercial or not-for-profit sectors.
Conflict of interest
Nora G Abdel Wanees, Mohamed M El-Sayed, Khalil I Khalil and Hossam A Khamis declare that they have no conflict of interest.
Human/animal rights
This article does not contain any studies with human or animal subjects performed by any of the authors.