


I. INTRODUCTION
Gallium nitride (GaN) represents an almost ideal material for the fabrication of high-power microwave devices and circuits: its high energy gap (3.4 versus 1.4 eV for GaAs) is reflected into a very high breakdown field (3500 kV/cm); piezoelectric and spontaneous polarization effects within AlGaN/GaN result in two-dimensional (2D) gas densities above 1013 cm−2, five times higher than for GaAs-based high electron mobility transistors (HEMTs), without requiring doping of the barrier layer. Saturation and overshoot velocity are around 3 × 107 cm/s, with relatively good electron mobility values (1200 cm2/V s). Epitaxial structures can be grown on silicon carbide (SiC) with limited lattice mismatch, thus exploiting the excellent thermal conductivity and semi-insulating properties of this material, suitable for rf and microwave device operation [Reference Mishra, Shen, Kazior and Wu1].
Due to their high breakdown voltages (>100 V), GaN HEMTs can operate in conditions that are not readily realizable with other device technologies [Reference Quay2], i.e. high drain operating voltage, low output capacitance per unit power (resulting from high power density), high peak efficiency, and good thermal dissipation.
Record device performances (not simultaneously achieved) include extremely high output power (900 W at 2.9 GHz, 81 W at 9.5 GHz), high frequency fT = 181 GHz at Lg = 30 nm, high power efficiency PAE = 75% at Psat = 100 W, and broad band operation 1.0–2.5 GHz with 50% efficiency [Reference Nakajima and Meneghesso3].
Starting from 2004, commercial GaN HEMTs have started to appear on the market [4–7], mainly targeting the low frequency, high efficiency end of the market. In the last years, GaN HEMTs have been subjected to various optimization processes, starting from the material properties, to the control of surface and buffer properties aimed at reducing transient phenomena, gate-lag effects, and the “current collapse” problem. A better control of short-channel effects, gate current, and degradation phenomena at high electric fields, together with the development of suitable structures for the management of the electric field (using T-shaped and Γ-shaped gates and field-plates), have led to the progressive increase of the operation drain voltage from 12 to 24 and 48 V.
The development of GaN microwave electronics has been supported by relevant Projects funded by the Defense Advanced Research Agency (DARPA) in US [Reference Rosker8], by the NEDO (New Energy and Industrial Technology Development Organization) organization in Japan [Reference Nakajima and Meneghesso3] and in Europe within the large-scale European joint Research and Technology project KORRIGAN (Key Organization for integrated circuits in GaN technology) [Reference Gauthier and Reptin9]. The European Space Agency (ESA) also launched a large project focused on the development of GaN HEMTs and millimeter microwave integrated circuits for applications in space. The aim of ESA's new GaN Reliability Enhancement and Technology Transfer Initiative (GREAT2) is to enable the manufacture of high reliability, space compatible, microwave transistors, and integrated circuits from GaN.
As previously mentioned, thanks to the properties of the GaN material (high energy gap and high breakdown) AlGaN/GaN and InAlN/GaN HEMTs can operate at voltages substantially higher than those which can be sustained by other semiconductor devices. These very high bias conditions, however, induce very high electric field within the device active area that can result in severe device degradation [Reference Delage and Dua10, Reference Brown11]. Improvements in reliability require a better understanding of failure mechanisms of GaN HEMTs, which can represent a major challenge due to the peculiarities of the physics of GaN devices, to material imperfection, to the stability of fabrication processes.
Several authors have observed that significant degradation effects may take place even when the devices are biased in off-state, or during two-terminals reverse biasing of the gate Schottky junction [Reference Joh and del Alamo12–Reference Zanoni16]. In this case, the main failure mode observed is a catastrophic increase in the gate leakage current. The existence of a critical voltage, beyond which GaN HEMTs start to degrade, has led the authors of ref. [Reference Joh and del Alamo12] to propose a degradation mechanism based on crystallographic defects formation through the inverse piezoelectric effect.
The present paper reviews and summarizes failure modes and mechanisms of GaN HEMTs, identified within the framework of various accelerated tests. The proposed methodology includes a detailed characterization of DC electrical characteristics, and analysis of trapping effects by means of pulsed measurements (gate-lag and drain- and gate-double pulse). 2D device simulations subsequently analyze the observed failure modes in order to validate hypothesis on physical failure mechanisms. Electroluminescence (EL) microscopy and spectroscopy were adopted to evaluate hot carrier effects in GaN HEMTs and as a powerful failure analysis tool.
II. FAILURE MECHANISMS OF GAN-BASED HEMTS
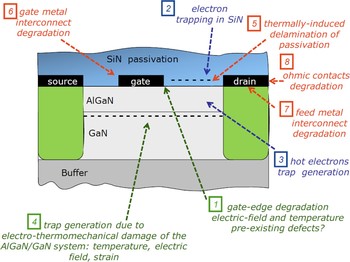
A substantial effort has been devoted in the past years to the identification of failure mechanisms of AlGaN/GaN HEMTs. In fact, in addition to the traditional potential failure mechanisms, the physics of the GaN devices introduces the possibility for several new failure mechanisms [Reference Zanoni16–Reference Trew, Green and Shealy18]. AlGaN/GaN HEMTs operate at higher drain bias, electric fields, and temperatures with respect to conventional GaAs transistors; their quality and reliability may be affected by the defectiveness of the AlGaN/GaN epitaxial layers grown on the SiC substrate and by the quality of the SiC substrate itself; the piezoelectric nature of GaN introduces potential risks related to the additional strain induced by the high electric fields. Finally, the mechanism of charge generation in the 2D electron gas (2DEG) makes channel conductivity sensitive to surface states. The analysis of failure mechanisms of GaN HEMTs could start from a comparison with most common degradation mechanisms of early GaAs and InP devices, speculating that the development of those devices also faced reliability problems at the initial stage [Reference Christou19]. Figure 1 shows a cross-section of a schematic AlGaN/GaN HEMT showing failure mechanisms, which have been recently identified. Failure mechanisms identified in red (5, 6, 7, 8) refer to thermally activated degradation mechanisms, which have been previously observed in devices processed in other semiconductors systems (Si, GaAs, InP, SiC, etc.), and hence these failure mechanisms are more inherent to the metallization scheme rather than to the GaN material itself. Mechanisms 2 and 3, marked in blue, are related to the presence of hot electrons, which are common to all high-voltage field-effect-transistors. Also hot-electrons related degradation has been largely reported in all the other semiconductor devices (Si, GaAs, InP, etc.); hence, also these failure mechanisms are more inherent to the hot-electrons effects itself, rather than to the GaN material. Finally, green characters refer to mechanisms 1 and 4, which are peculiar to GaN devices due to the polar and piezoelectric nature of this semiconductor material. This opens a new window in the reliability physics study, since these mechanisms have never been clearly identified in the other semiconductors. In the following, each failure mechanism is described with reference to the various technologies.
Failure mechanisms recently identified on GaN HEMTs. Mechanisms identified in red (5, 6, 7, 8) are thermally activated mechanisms. Mechanisms 2 and 3 are related to the presence of hot electrons present at high bias conditions. Mechanisms 1 and 4 (green) are peculiar to GaN devices due to the polar and piezoelectric nature of this semiconductor.
III. SAMPLE DESCRIPTION AND EXPERIMENTAL RESULTS
Four AlGaN/GaN HEMT wafers were grown on SiC by metal organic vapor phase epitaxy; a fifth wafer was grown by MBE on sapphire. The undoped multilayer structure consisted of a GaN buffer layer, followed by an AlGaN barrier layer (20–25 nm thickness, 23–28% Al concentration). GaN HEMTs have been fabricated on all wafers using the same industrial-quality process, including ohmic contact formation through Ti/Al/Ni/Au deposition and subsequent rapid thermal processing, Schottky gate electrode formation using Ni/Au deposition, and active device isolation by fluorine ion implantation. Devices were passivated with 400 nm SiN, deposited by plasma enhanced chemical vapor deposition. Both gated TLM HEMT (TLM: transfer length method) structures having L G = 5 µm, L DS = 15 µm, and W G = 100 µm, and transistors with L G = 0.5 µm, L DS = 4 µm, and W G = 100 µm were tested. No field-plate or T-gate was used so that the gate-drain and gate-source access could be observed by EL microscopy looking at the device front side.
Devices have been submitted to two kinds of tests: (a) reverse-biasing of the gate-source and gate-drain Schottky junction, up to −100 V; (b) DC bias tests at V DS = 30–40 V, and junction temperature 200–300°C.
IV. GATE EDGE DEGRADATION: REVERSE BIASING OF THE GATE SCHOTTKY JUNCTION
When high reverse bias voltages are applied to the gate (with V S = V D = 0 V), degradation of electrical characteristics has been observed in almost all tested wafers, consisting in an increase in gate leakage, a worsening of current collapse, and – in some devices – an increase in drain (source) parasitic resistance and a decrease of DC saturated current I DSS. This mechanism has been repeatedly observed reported by several organizations, including Conway et al. from HRL [Reference Conway, Chen, Hashimoto, Willadsen and Micovic20], Joh and Del Alamo from M.I.T. [Reference Joh and del Alamo12–Reference Joh, Xia and del Alamo14], Chowdhury et al. and Park et al. from Triquint [Reference Chowdhury21, Reference Park22], Inoue et al. and Kikkawa et al. from Fujitsu [Reference Inoue23, Reference Kikkawa24], Trew et al. from RFMD [Reference Trew, Green and Shealy18] and Marcon et al., from IMEC [Reference Marcon25]. It involves the presence or the generation of defects at the gate edges, where the electric field is higher. The defects promote the injection of electrons from the gate into the AlGaN barrier layer, through a trap-assisted tunneling mechanism, as shown in Fig. 2.
Schematic band diagram describing the mechanism of gate leakage increase due to trap-assisted electron tunneling.

A simple way to verify the presence of this failure mechanism is to carry out a reverse-bias step-stress experiment, i.e. to increase the gate negative voltage in steps either with the device in off-condition or with the drain at ground and the source contact also at ground or floating. Let us consider an experiment where devices are submitted to a reverse bias step stress test, keeping source and drain at ground (V S = V D = 0 V) and applying a negative V G bias to the gate, from −15 to −100 V in −5 or −10 V steps (120 s each). At the end of each step, device electrical characteristics (drain current I D and transconductance g m) and EL images of the devices were evaluated; we verified that devices belonging to the same wafer presented a consistent and reproducible behavior. When a certain reverse voltage is reached (hereafter identified as “critical voltage”) the gate leakage current increases substantially, reaching sometimes 104 times the initial value.
Figure 3 shows the ratio between the stressed and unstressed values of reverse gate current I G measured at V GD = −8 V after each test step on gated TLM devices. As other authors observed [Reference Joh and del Alamo12–Reference Joh, Xia and del Alamo14], there is no degradation of gate current up to a “critical voltage” which spans from |V G| = 10 V to |V G| ≥ 60 V within the tested wafer set. Devices belonging to the same wafer show a consistent behavior, with a low dispersion of the critical voltage for failure.
Ratio between gate leakage current after and before stress, I G/IGfresh (measured at V G = −8 V), as a function of the reverse voltage (V G) applied during each step in gated TLM HEMT.

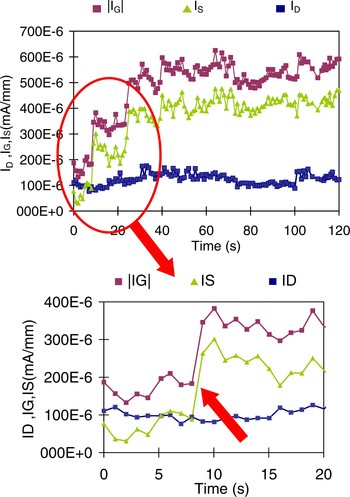
During the tests, localized damage points are created, inducing sudden “jumps” in the leakage current (see Fig. 4); each “jump” corresponds to the creation of a new breakdown point and may be followed by a decrease in the leakage current, possibly corresponding to a localized fusion of the vertical conducting path, or, more likely, due to trapping on the generated deep levels, which decreases locally the electric field and/or reduces the number of available traps for tunneling. The leakage current becomes very noisy; the observed features resemble those of time dependent dielectric breakdown effects in metal oxide semiconductor (MOS) transistors.
Evolution of drain current I D, gate current I G, and source current IS measured during stress on a device biased at V G = −35 V and V S = V D = 0 V. The drain current is initially higher than the source one, due to the presence of defects in the gate-drain access region. In the enlargement (first 20s) the occurrence of a failure on the source side is pointed out.
The EL microscopy is a powerful tool that has been adopted by several research group in order to identify and characterize hot carrier in the device active area in many semiconductors material systems. Among others: Selmi et al. in Si-MOSFETs [Reference Selmi26], Zanoni et al. [Reference Zanoni27] in GaAs MESFETs, Meneghesso et al. in GaAs pseudomorphic HEMTs [Reference Meneghesso, Grave, Manfredi, Pavesi, Canali and Zanoni28]. Recently, the EL technique has been also applied also in GaN-based devices [Reference Zanoni17, Reference Chen, Lai, Kung, Penner and Li29–Reference Shigekawa, Shojima and Suemitsu32].
We adopted the EL microscopy as a tool to identify localized reverse current injection points and damaged areas; EL images were taken during the tests and at the end of each step using a cooled CCD camera having an S20 spectral response. The sensitivity of the camera was calibrated and kept constant during the test; an integration time of 100 s was used for all measurements.
Figure 5 shows false-colors EL micrographs of a representative TLM device, taken at V G = −10 V (with source and drain grounded) after the steps indicated in Fig. 5. Before the steps at the critical voltage V G = −30 V, no EL spot is observed, and |I G/W| is lower than 0.6 mA/mm. Starting with the step at −40 V, I G is increased of more than 100× and localized emission spot points in the EL images start being observed. As the test reverse voltage is further increased, an increase in the density of the “defect” points, rather than an increase in the damaged area around each point, is observed.
EL microscopy images of a representative gated TLM HEMT sample. Images were taken at V G = −10 V (with V S = V D = 0 V) after each step-stress. Dashed lines identify the device active area.

Since EL images were taken from the front side of the devices, only the drain and source access regions can be observed, the area under the gate being shadowed by the gate metal. Within the access regions, the spots detected by EL were always located at the edge of the gate towards the drain and source, where the electric field is maximum.
Fig. 6 compares the relative increase in intensity of the EL signal (integrated over the entire device active area and over the detector spectral response) with the relative increase in I G for two representative TLM devices of two different wafers, demonstrating a strong correlation.
Correlation between the relative increase in gate current and EL intensity in two representative gated TLM HEMT samples of different wafers during the step stress experiment.

The DC values of drain current I D measured after each step (not shown) either decreased slightly (less than 10%) or increased (<10%) due a negative pinch-off voltage shift; these changes were not correlated with the other failure modes. Changes in I D were gradual: no abrupt change or “critical” voltage value was observed. On the contrary, “double-pulse” I D measurements [Reference Meneghesso15], carried out on 0.5 µm gate-length HEMTs, detected a remarkable worsening of current collapse effects: in some wafers, the value of the pulsed I DSS after the step at 50 V decreased up to 40% of the initial value. Figure 7 shows an example corresponding to a 30% decrease of pulsed current with respect to the initial condition. The worsening of pulsed characteristics follows the increase in the reverse gate current [Reference Zanoni17], while DC I D degradation (not shown) appears to be uncorrelated with both the EL and gate current increase.
Pulsed I D versus V DS characteristics of a 0.5 µm gate-length HEMT, untreated, and after the step at V G = −50 V. Results obtained using two baselines (V GS, V DS = 0, 0 and −8, 20 V respectively) are compared. Pulse duration and period were respectively 1 and 100 µs. A remarkable increase in current collapse effects is observed after the test. The critical voltage of this device is 40 V.

Another group of devices was step-stressed by applying a negative gate voltage of −5 V/step for a total time of 2 min while drain and source voltage were kept at 0 V. After each step the following electrical measurements have been carried out:
1) DC and pulsed IV characteristics in order to evaluate the drain current collapse coefficient defined as the ratio of I Ddc–I Dpul over I Ddc, where I Ddc represents the drain current measured at V DS = 5 V and V GS = 0 V, while I Dpul represents the drain current measured at the same bias point but by pulsing the gate terminal from V GS = −6 V;
2) gate leakage current measurements at V DS = 0 V and V GS = −8 V;
3) current deep levels transient spectrocopy (I-DLTS) measurements for the extraction of the activation energy of the thermally activated process involved in the drain current-collapse phenomena. For the current DLTS measurements, a voltage pulse with a peak value of −6 V and a pulse width of 10 ms was applied to the gate of the device, and the drain current transient after switching the gate voltage to 0 V was measured by DLTS technique. The measurements were carried out by biasing the device at V DS values of 5 V.
DC (solid lines) and 200 ns pulsed (dashed line) IV output characteristics measured at the beginning (right) and at the end (left) of the applied step-stress.

Tested devices were initially subjected to DC and 200 ns pulsed I–V measurements. As shown in Fig. 8, fresh devices reach a 0.8 A/mm drain current level both during DC and pulsed characterization. This means that fresh devices had very little current-collapse. On the other hand, at the end of the stress test procedure, we observed degradation in the maximum current level and an increase in the drain current collapse.
Figure 9 summarizes device degradation during the step stress applied to the device. At the beginning of the experiment the devices do not show a significant change in their current-collapse or gate leakage levels. On the other hand for gate voltages larger than −30 V devices experience a significant and simultaneous increase in both gate current levels and drain current collapse. This means that during the stress test carried out some physical mechanisms are causing the simultaneous degradation of leakage current as well as device performance during pulsed measurements.
Dispersion coefficient (closed symbols) and reverse gate current (open symbols) measured after each step stress. The gate current as well as the dispersion coefficient starts to rise for gate voltages higher than 30 V.

A) Trap characterization: DLTS measurements
In order to investigate the origin of the observed degradation, we also carried out current-DLTS measurements at the end of each of the stress steps that have been applied to the device. At the beginning of the stress procedure, DLTS signals were very low in the measured temperature range (300–430 K), meaning that drain current is not changing significantly in the time window used for DLTS spectroscopy. However, when the applied reverse bias increased beyond 30 V, DLTS signals yielded one negative peak whose amplitude is increasing at the increasing of the reverse bias applied to the devices during the two minutes step stress, see Fig. 10. An activation energy of 0.5 eV (similar to the one reported in [Reference Shigekawa, Shojima and Suemitsu32]) was extracted from the DLTS measurements carried out after the V GS = −30, −35, and −40 V stress.
DLTS spectra and their Arrhenius plot during the applied stress test. After the 30 V step a hole-like peak is clearly visible and its amplitude increases at the increasing of the applied stress voltage. On the other hand the activation energy of 0.5 eV does not change.

B) 2D numerical device simulation
In order to gain insight into the physical mechanisms causing the observed dynamic and static device degradation observed during the previously described stress test, numerical simulations were carried out by means of the commercial SENTAURUS (Synopsis Inc.) simulator.
In [Reference Faqir, Verzellesi, Meneghesso, Zanoni and Fantini33], a decrease in DC drain currents, an increase in dispersion phenomena, and a decrease of gate currents have been modeled assuming the presence of trap states extending in the gate-drain access region. In our case, however, an increase in the gate leakage current was observed during the stress suggesting that the degradation mechanisms is similar to that observed in this work where the degradation has been related to the formation of defects at the edge of the gate terminal.
Numerical simulations have thus been carried out by simulating device structure with a trapping region centered at the gate edge towards the drain contact. The width of that region has been kept constant at 100 nm while its depth and traps concentration have been varied in order to evaluate their effect on device characteristics. Trap energy level was located 0.5 eV below the conduction band, as experimentally obtained by DLTS measurements, while the trap cross-section was set to a typical value of 10−15 cm−2 [Reference Chini, Esposto, Meneghesso and Zanoni34, Reference Roff35].
Drain current transient were simulated using the same parameters chosen for the experimental setup. The device was biased through a 50 Ω resistor at a V DD voltage ranging from 1 to 12 V and then turned on by pulsing the gate terminal from pinch-off (V GS = −5 V) to open-channel (V GS = 0 V). As shown in Fig. 11, numerical simulations correctly predict the drain current dispersion that is experimentally observed yielding drain current transients with time constants in the ms range, in good agreement with DLTS measurements.
Numerical simulations of DC (closed symbol) and 200 ns pulsed (open symbols) I–V characteristics with a defective region centered at the gate-drain edge that is 100 nm wide and 20 nm thick with a 1020 (cm−3) traps concentration is located in the AlGaN barrier. The drain current transient refers to the turn-on transient obtained when the device is biased at V DD = 6 V.

The physical mechanism that causes the observed lag effect can be explained with the standard Shockley–Read–Hall theory, which predicts that the capture rate of a trap level depends linearly from the density of free carriers and the amount of empty states. If the gate-drain junction is highly reverse biased (like in pinch-off condition), electrons can tunnel from the gate contact, giving rise to an increase in the concentration of carriers in the barrier layer. The capture velocity of the trap will thus increase, as well as the amount of trapped electrons. When the device is rapidly turned on in the knee-voltage region, the tunneling current decreases due to the lower electric field applied. If the tunneling current decreases, the amount of free carrier diminishes as well as the trap capture rate. The equilibrium condition in the knee-voltage region thus requires a decrease in the trapped electrons concentration compared to the high reverse-bias condition. When traps start to emit previously trapped electrons, the net negative charge in the barrier gradually decreases, thus inducing an increase in the 2DEG concentration in the GaN channel. As a consequence, the device drain current increases, reaching its steady-state value when all the trapped electrons have been emitted.
In order to evaluate the effects of traps concentration and the depth of the trapping region, numerical simulations for traps concentration levels of 2, 5, 10, and 20 × 1019 (cm−3) and depths ranging from 10 to 25 nm have been carried out. As can be seen in Fig. 12, the static device performance (I DSS) degrades significantly as the traps concentration is increased, but only if the trapping region extends deeply into the AlGaN barrier. If the trapping region thickness is below 22 nm, the effect of traps on I DSS reduction is negligible regardless of their concentration. On the other hand, the dispersion coefficient increases at the increasing of traps concentration for all the thicknesses considered during simulations.
Dispersion coefficient and I DSS values as obtained by numerical simulations for various trap concentrations and defective region thicknesses. Increasing trap concentration degrades the dynamic response of the device regardless of the defective region extension. However only for defective regions approaching the AlGaN/GaN interface a degradation of the static characteristics (I DSS) can be observed.

The decrease in I DSS can be explained as follows: since the trapping region approaches the AlGaN/GaN interface and due to the fact that the acceptor-like trap is located 0.5 eV below the conduction band, some of the traps close to the interface are filled also in open-channel condition. This results in a negative charge located close to the AlGaN/GaN interface, partially compensating the positive piezo-electric charge which induces the 2DEG, and resulting in a decrease of the 2DEG concentration, and consequently, of I DSS current as shown by the simulation results. Degradation of transport parameters such as mobility and saturation velocity may also contribute to degrade I DSS, as proposed by Faqir et al. [Reference Faqir, Verzellesi, Meneghesso, Zanoni and Fantini33].
C) Gate-edge degradation: conclusions
All the tested technologies have shown to be affected by a failure mechanism consisting in a degradation of the AlGaN layer at the gate edge, resulting in an increase of the density of deep levels in that region, affecting devices turn-on response, gate leakage, and, in a final stage, DC drain current. The presence of a damaged region within the AlGaN at the gate edge has been confirmed by a series of techniques including EL microscopy and TEM; the role of the traps in determining the degradation has been identified by means of 2D device simulations. Simulations have shown that damage at the gate-drain edge can be detected initially as inducing an increase in dispersion phenomena such as current collapse. Later when the damage starts to affect a thicker portion of the AlGaN layer, the DC value of I DSS is also affected. The exact mechanism triggering the degradation is still unknown, even if the large spread in critical voltages (which range from 20 V to more than 100 V in the tested technologies) suggests a dependence on material quality. In fact, a similar spread in critical voltages is found within several wafers, which shared a common technology. Gate-edge degradation is possibly triggered by pre-existing defects within the epitaxial layers or extending from the substrate up to the surface. These defects enhance the gate tunneling current (see Fig. 13).
Schematic cross-section of the gate-drain area of an AlGaN/GaN HEMT showing electron injection from the gate due to trap-assisted tunneling towards the device surface and within the AlGaN barrier. Testing at high gate-drain (source) reverse bias results in damage of the AlGaN layer, with enhancement of the trap density within a “damaged region” which corresponds to the gate edge(s), where the electric field is maximum. Highly energetic electrons, injected from the gate, can generate new deep levels, leading to an increase in gate current. The slow frequency response of these deep levels induces a worsening of gate-lag effects, thus compromising the frequency response and rf power of the devices.

The electric field at the gate edge is the key variable governing the degradation; temperature also possibly contributes to accelerate failure; unfortunately, no specific experiment has been carried out to verify this hypothesis. This failure mechanism is also extremely sensitive to process steps or device design steps that can influence the electric field profile at the gate edge. Among the former, it is worth mentioning that the profile of the gate metallization cross-section has a remarkable effect on the electric field [Reference Marcon25, Reference Balaz, Kalna, Kuball, Hayes, Uren and Asenov36, Reference Johnson37].
V. ELECTRON TRAPPING IN SILICON NITRIDE (SIN) PASSIVATION
Reverse biasing of the gate-drain junction can also induce another failure mechanism, which is schematically depicted in the cross-section (Fig. 13) and consists in the tunneling of electrons from the gate into surface states or directly into traps within the SiN passivation layer. The negative charge partially counteracts the polarization charge which induces the 2DEG, so that the channel conductivity in the gate-drain access region is reduced, resulting in drain current decrease and drain resistance increase. The negative charge over the gate-drain region also reduces the maximum value of the electric field, introducing a negative feedback, which controls and reduces both vertical and lateral electron injection from the gate. When bias is removed, electron de-trapping may occur, and a partial or complete recovery of electrical characteristics takes place.
In order to separate the effects due to gate-edge degradation from those due to electron trapping on the device surface or within the SiN passivation, we analyzed a device taken from a wafer showing a high critical voltage (green empty squares in Fig. 3). Figure 14 shows the relative decrease of drain current, the corresponding increase in source parasitic resistance (up to +200%), and the increase in gate current observed in a representative sample during the step-stress experiment. Starting with the step at −20 V, a decrease in drain current is observed, reaching approximately 40% at the end of the −90 V step. Gate current first decreases, following the decrease in I D, and then increases due to creation of gate-edge degradation. At the same time a noticeable decrease in the on-state EL intensity is observed (see Fig. 15).
Normalized change in drain current and source parasitic resistance, compared to the relative increase in gate leakage current, as a function of the step stress V GSD voltage value V GStress in a representative gated-TLM GaN device.

EL on-state images of a tested device, taken at V DS = 10 V and V GS = 0 V. Top: untreated device. Bottom: after the step at V GSD = −70 V. EL intensity is mapped using false colors, where red corresponds to higher values, and green and yellow to lower ones.

All these experiments suggest that, during reverse bias tests, trapping of negative charge occurs over the gate-drain (and gate-source) access regions. As well known, this negative charge changes the electric field distribution within the device, reducing its maximum value, thus resulting in a mitigation of hot-carrier effects such as EL emission and breakdown, as reported by Ladbrooke et al. in GaAs MESFETs [Reference Ladbrooke and Blight38] and by Menozzi et al. in GaAs HEMTs [Reference Menozzi, Cova, Canali and Fantini39]. The trapped negative charge partially depletes the channel in the access regions, thus inducing the observed degradation of drain current and increasing source and drain parasitic resistances. The decrease in leakage gate current, which is observed in these devices for |V GSD| < 50 V (see Fig. 14), is also due to this effect. Degradation is fully recoverable: Fig. 16 shows the output characteristics of a representative device before starting the step stress experiment, at the end of the test, and after 14 days of unbiased storage at room temperature. A complete recovery of drain current is observed, which even reaches a value slightly higher than that of the untreated device. Photo-stimulated de-trapping experiments (not shown) were conducted using a series of calibrated light source with constant power and different wavelengths. Illumination using wavelengths shorter than 532 nm induces a complete recovery of I D in 30 s. In terms of photon energy, this corresponds to 2.25 eV approximately, a value identifying an electron trap level in SiN [Reference Lusky, Shacham-Diamond, Shappir, Bloom and Eitan40]. This strongly suggests the same mechanism of charge injection reported in ref. [Reference Neuberger41], consisting in lateral electrons injection from the gate due to tunneling and subsequent trapping within the dielectric over layer. As a result, the charge is rather firmly trapped in the dielectric and not located in interface states as usually assumed [Reference Neuberger41]. RT de-trapping occurs possibly via hopping through trap levels.
Comparison of the I D–V DS characteristics of a 5 µm device, before reverse bias test, after the −100 V step, and after a 14 days rest period.

There are some practical consequences of the observed “trapping” effect in GaN HEMTs: since electron trapping reduces the electric field, there is a “self-healing” effect during the test itself, which limits the occurrence of failure mechanisms induced by electric field and/or hot carriers, and mitigates degradation with respect to a constant voltage stress or to real operating conditions at high V GD. As a consequence, one should be careful before using results of step-stress experiments in order to identify maximum voltage ratings or derive an indication of device reliability. In fact, if the device surface is prone to electron trapping, a voltage step stress experiment would progressively and gradually reduce the device electric field step by step, thus resulting in an overoptimistic definition of failure threshold values with respect to an experiment where a high gate-drain voltage is applied on a fresh device.
Several other authors [Reference Joh and del Alamo13, Reference Dammann42] have observed similar effects during reverse bias tests or DC and rf tests, with decrease of drain and gate current during the test. In ref. [Reference Dammann42], the role of the quality of the SiN passivation has been studied by characterizing MIS capacitors adopting as dielectric the same SiN as the HEMT passivation on ad hoc prepared test structures. Devices have been stressed at T ch = 90 °C, V DS = 50 V, I D = 50 mA/mm; an I D degradation proportional to the logarithm of the stress time was found.
In conclusion, high electric field in the gate-drain region induces two mechanisms of electron injection from the gate, and, consequently, two possible failure mechanisms: one is a vertical injection of electrons from the gate into the AlGaN, due to trap assisted tunneling, and the other one is a vertical component, also due to tunneling, and injecting electrons directly into surface states or into traps within the SiN passivation. Both mechanisms eventually result into a decrease of the DC value of drain current. As far as the gate leakage is concerned, however, the effect of the two mechanisms is the opposite: AlGaN damage (likely traps formation) leads to an increase in I G, while electron trapping in the gate-drain region induces a decrease of tunneling current consequent to the decrease in the electric field.
VI. DC ACCELERATED TESTS: THERMALLY ACTIVATED FAILURE MECHANISM
A long-term stress test has been carried out on devices having W G = 1.2 mm periphery, by applying V DS = 40 V and I D = 200 mA bias conditions, and by using three different base temperatures (i.e. 50, 75, and 100 °C, corresponding to junction temperatures of 200, 245, and 293 °C respectively). In order to investigate device degradation, the bias stress has been interrupted at regular time intervals to characterize a set of I–V parameters (I DSS, I G, and V TH) at RT.
Devices show an increase of gate leakage (Fig. 17), a decrease of the DC value of drain current (Fig. 18) and of transconductance (not shown), and an enhancement of trapping phenomena (Figs. 19 and 20).
Comparison of the gate leakage current in off-state in untreated (gray) and aged devices at V DS = 40 V, I D = 200 mA at different temperatures. Devices periphery is 1.2 mm, gate length L G = 0.5 µm, and the source-to-drain distance L SD = 3.7 µm.

Relative decrease in drain current for the four junction temperature of the DC test stress test at V DS = 40 V, I D = 200 mA. Devices periphery is 1.2 mm, gate length L G = 0.5 µm, and the source-to-drain distance L SD =3.7 µm.

Slump ratio I DS (baseline V GS = −8 V, V DS = 20 V)/I DS (baseline V GS = 0 V, V DS = 0 V) in untreated (gray) and tested devices at V DS = 40 V, I D = 200 mA at different temperatures. Devices periphery is 1.2 mm, gate length L G = 0.5 µm, and the source-to-drain distance L SD = 3.7 µm. High values of S.R. indicate low trapping effects.

Pulsed DC characteristics measured in a representative device after 200 h of DC testing at 245 °C, with V DS = 40 V, I D = 200 mA. Devices periphery is 1.2 mm, gate length L G = 0.5 µm, and the source-to-drain distance L SD = 3.7 µm.

By using a −15% decrease of I DSS with respect to the initial value as a failure criteria, a tentative value of activation energy, E A, for this failure mechanism has been extracted, obtaining E A = 1.13 ± 0.45 eV.
VII. CONCLUSIONS
Several authors (see references cited in the text) have identified failure mechanisms of GaN HEMTs related to degradation of the gate-drain edge. We have analyzed in detail this failure mechanism, and demonstrated that:
1) when high V GD voltages are applied to the device, trap-assisted tunneling promotes electron injection from the gate into the semiconductor at preferential points, which corresponds to defects acting as deep levels;
2) at high electric fields, current injection induces further defects; strain relaxation induced by inverse piezoelectric effects may also contribute to defect generation;
3) these defects correspond to an electron trap having energy of 0.5 eV from the conduction band;
4) the introduction of an acceptor-like electron trap level located at 0.5 eV from the conduction band in the AlGaN barrier at the edge of the gate contact correctly predicts the experimentally observed degradation of both dynamic and static drain current levels; furthermore,
5) simulations showed how the trapping region has to extend to almost the whole AlGaN layer thickness in order to explain for the static degradation of drain current. An increase in trap concentration within a spatially shallow trapping region can account only for the increase in drain current dispersion but not for the steady-state value reduction of the device drain current;
6) DC accelerated tests have shown that a similar degradation mechanism, resulting in enhanced current collapse, can be induced by high temperature and high V DS bias, due either to the creation of new traps following the mechanisms described in to the depassivation of pre-existing deep levels.
ACKNOWLEDGEMENTS
The authors would like to thank A. Cetronio, C. Lanzieri, M. Peroni (Selex-SI), M. Uren and T. Martin (QinetiQ), G. Verzellesi, V. Di Lecce, M. Esposto (Univ. of Modena and Reggio Emilia), F. Rampazzo (Univ. of Padova, DEI) for fruitful discussion. This work was partially supported by EDA in the frame of the KORRIGAN project, and by the Italian Ministry of Research projects PRIN Gallium Nitride Wideband Microwave and mm-wave Integrated Circuits for Low-noise and High-power Subsystems (coord. Prof. G. Ghione) and FIRB Iperfrequenze per Sistemi Elettronici Integrati: Sviluppo di Tecnologie Abilitanti per Componenti Elettronici Riconfigurabili a Banda-Larga (coord. Prof. E. Limiti).
 Gaudenzio Meneghesso (IEEE S'95–M'97–SM'07) was born in Padova, Italy in 1967. He graduated in Electronics Engineering at the University of Padova in 1992 working on the failure mechanism induced by hot-electrons in MESFETs and HEMTs.
He received the Italian Telecom award for his thesis work in 1993. In 1995 he was at the University of Twente (The Netherland) with an Human Capital and Mobility fellowship (within the SUSTAIN Network) working on the dynamic behavior of protection structures against ESD. In 1997 he received the Ph.D. degree in Electrical and Telecommunication Engineering from the University of Padova working on hot-electron characterization, effects and reliability of GaAs-based and InP-based HEMT's and pseudomorphic HEMT's. Since 2002 is with University of Padova as Associate Professor.
His research interests are: (i) Electrical characterization, modeling and reliability of microwave and optoelectronic devices on compound semiconductors; (ii) Electrical characterization, modeling and reliability of RF-MEMS switches for reconfigurable antenna switches; (iii) Study of the sensitivity of Electronics devices to Electrostatic discharge and development of suitable protection structures; and (iv) Characterization and reliability of organic semiconductors devices. Within these activities he published over 350 technical papers (of which more than 35 Invited Papers and 5 best paper awards).
He has been the General Chair of three conferences: HETECH 2001, HETECH 2008 and WOCSDICE 2007; He has been the Technical program Chair of WOCSDICE 2001 and will be the TPC Chair of the International Electrostatic Discharge Workshop (IEW) 2010.
He is in the steering committee of several European conferences: European Solid State Device Conference (ESSDERC), Heterostructures Technology Workshop (HETECH), Workshop on Compound Semiconductors Devices and Integrated Circuits held in Europe (WOCSDICE). He is serving in the TPC since 2005 for the IEEE International Reliability Physics (IRPS) Symposium and in 2009 he entered into the management committee. He also served several years for the IEEE-International Electron Device Meeting (IEDM): he was in the Quantum Electronics and Compound Semiconductors sub-committee as a member in 2003, as chair in 2004 and 2005 while in 2006 and 2007 he has been in the Executive Committee as European Arrangements Chair. Finally, He has also been involved in the Technical Program Committee of several international conferences: European Symposium on Reliability of Electron Devices, Failure Physics and Analysis (ESREF), Electrical Overstress/ElectroStatic Discharge (EOS/ESD) Symposium, International EOS/ESD Workshop (IEW), International Conference on Solid State Devices and Materials (SSDM). He is reviewer of several international journals and currently he is Associate Editor of the IEEE Electron Device Letter for the compound semiconductor devices area since 2007.
 Matteo Meneghini (S'06–M'08) received the Laurea degree (summa cum laude) in electronics engineering, with a thesis on the electrical and optical characterization of gallium nitride LEDs, and the Ph.D. degree, working on the optimization of GaN-based LED and laser structures, from the University of Padova, Padova, Italy, in 2004 and 2008, respectively. In July 2004, he obtained the Italian Engineering Qualification and cooperated with the Department of Information Engineering, University of Padova, working on the performance evaluation of high-brightness LEDs. He is currently a Research Fellow with the Department of Information Engineering, University of Padova. He has been involved in two Italian Research Ministry Projects on “Reliability and operating conditions of GaN-based Light Emitting Diodes (LEDs) for solid-state lighting.” He is currently working on the electrooptical characterization and modeling of the performance and reliability of AlInGaN LEDs and lasers. Within these activities, he published more than 80 journal and conference proceeding papers. During his activity, he has cooperated with a number of LED and laser manufacturers, including OSRAM-OptoSemiconductor (Germany), Panasonic Corporation (Japan), TRIDONIC-LEDON (Austria), and Universal Display Corporation (U.S.). He is a Reviewer for the Journal of Applied Physics, Semiconductor Science and Technology (IOP), and Microelectronics Reliability (Elsevier). His research interests include the characterization, reliability, and simulation of compound semiconductor devices. Dr. Meneghini received the “Carlo Offelli Award 2008” (best young researcher of the Department of Information Engineering for year 2008) as a recognition for his research activity at the University of Padova. In 2009, one of his papers received the Best Paper Award at the 20th European Symposium on Reliability of Electron Devices, Failure Physics and Analysis (ESREF 2009). He is a Reviewer for the IEEE TRANSACTIONS ON ELECTRON DEVICES, IEEE ELECTRON DEVICE LETTERS, and IEEE TRANSACTIONS ON ELECTRON DEVICES.
 Augusto Tazzoli (IEEE Member) was born in Padova, Italy, in 1978. He graduated in Electronics Engineering at the University of Padova in 2003 working on electrical and thermal characterization of commercial LDMOS transistors. In July 2003 he became engineer by profession. In September 2003 he started a Master in Information Security, organised by Form&r at Padova, completed in March 2004 with a qualification exam. In 2006 he received the Ph.D. degree in Electronics and Telecommunications Engineering from the University of Padova working on the reliability of silicon, compound and MEMS devices. He currently holds a post-doc position, working on the develop of measurement systems in genre, Transmission Line Pulser systems, ElectroStatic Discharge phenomena, solid state lighting, compound semiconductors, and RF-MEMS. In his career he has coauthored about 80 papers (best work at Italian GE meeting 2005, best student paper at EOS/ESD 2006, best paper at ESREF 2007) and several technical reports for different microelectronic companies. In 2009 he was awarded with the “Premio Offelli” as the best young researcher of the Department of Information Engineering of University of Padova. He has been invited to serve as a reviewer of several International journals (IEEE Electron Device Letters, Solid State Electronics, IEEE Transaction on Industry Applications, Microelectronics Reliability). Since 2008 he serves in the Technical Planning Committee of the EOS/ESD Symposium in the sub-committee: “Sub-Class 0 Devices, MR-Heads, MEMS”, and, since 2009, in the TPCs of IEW and ESREF.
 Nicolò Ronchi was born in Thiene, Italy, in 1983. He received the degree in electronics engineering, with a thesis on the electrical characterization of AlGaN/GaN HEMTs grown on hybrid substrates, from the University of Padova, Italy, in 2008. He is currently working toward the Ph.D. degree in information engineering with the University of Padova.
His main interests are the characterization and reliability analysis of GaN based semiconductor devices, in particular AlGaN/GaN HEMTs.
 Antonio Stocco was born in Castelfranco Veneto, Italy, in 1984. He received the laurea degree in electronics engineering, with a thesis on the characterization and reliability of HEMTs based on the new InAlN/GaN heterostructure, from the University of Padova, Italy, in 2008. He is currently working toward the Ph.D. degree in Information and Communication Technology in the department of Information Engineering at the University of Padova.
His research topics are new devices based on compound semiconductors and on new heterostructures for RF application, with a particular focus on trapping effects and on reliability of GaN HEMT devices.
 Alessandro Chini was born in Rovereto, Italy, in 1975. He received the Laurea degree in electronics engineering and the Ph.D. degree in electrical and telecommunication engineering from the Uni- versita? di Padova, Padova, Italy, in 1999 and 2003, respectively. From 2002 to 2004, he was with the University of California, Santa Barbara, where he was an Assistant Research Engineer working on the fabrication of GaN-based HEMTs. Since 2004, he has been with the Universita? di Modena e Reggio Emilia, Modena, Italy, where he is currently an Assistant Professor with the Dipartimento di Ingegneria dell'Informazione. His research interest includes GaN- and GaAs-based devices for high-power and high-frequency applications, reliability and long-term stability of III–V-based devices, and development of pulsed- measurement systems for devices characterization.
 Enrico Zanoni graduated in Physics at the University of Modena, cum laude, in 1982, under the supervision of Prof. Claudio Canali. He has been assistant professor at the Univ. of Bari and at the Univ. of Padova from 1985 to 1992, associate professor at the Univ. of Padova from 1992 to 1993, full professor of Microelectronics since 1993. In 1988, together with Claudio Canali and Alessandro Paccagnella, he contributed to create the Microelectronics Laboratory of the Department of Information Engineering of the University of Padova. Thanks to the contribution of Professors Andrea Bevilacqua, Andrea Cester, Andrea Gerosa, Gaudenzio Meneghesso, Andrea Neviani, Alessandro Paccagnella and Daniele Vogrig, the Laboratory expanded its activity from device physics and reliability to digital and analog integrated circuits design, design of integrated circuits for implantable biomedical devices, radiation hardness studies, non volatile memories reliability, design and testing of MEMS and ESD protection circuits, development and application of biochips for DNA detection and electroporation, GaN LED and laser optoelectronics, solid-state lighting. The Microelectronics Lab of the University of Padova publishes approximately 100 papers/year on refereed journals and conference proceedings. The research activity of Enrico Zanoni is in the general area of microelectronics, with focus on electronic and optoelectronic devices design, modeling, characterization and reliability. Among the research contributions of Enrico Zanoni there are: (a) the study of the reliability physics of compound semiconductor devices, which contributed to identify new failure mechanisms relevant for device and circuit applications, (b) advancements in the physics, experimental characterization and modeling of hot carrier phenomena in high-speed semiconductor devices; (c) studies concerning electronic and optoelectronic devices based on Gallium Nitride (GaN), including characterization, modeling and reliability of power GaN High Electron Mobility Transistors (HEMTs) and of GaN Light Emitting Diodes, and their correlation with material properties and device technology. On these topics, he extensively cooperated with industrial and academic research laboratories worldwide. He is co-author of more than 200 journal and 250 conference papers. Among those, there are 32 invited papers, 14 papers presented at IEEE IRPS, and 13 papers at IEEE IEDM. Coeditor of the book P. Cappelletti, C. Golla, P. Olivo and E. Zanoni (editors), “Flash Memories”, Kluwer Academic Publishers, Amsterdam, 1999. Enrico Zanoni has been elevated to the grade of IEEE Fellow (class of 2009) “for contributions to reliability of compound semiconductor devices”.



