1. Introduction
The study of historical energy transitions is essential for understanding the challenges that societies face today. The very emergence of the British Industrial Revolution in the eighteenth century was closely linked to the transition toward fossil fuels. The systematic extraction of modern energy sources from coal basins enabled industrializing countries to overcome, in Wrigley’s words, the “photosynthetic constraint” of organic economies, paving the way for sustained economic growth (Wrigley, Reference Wrigley1993, Reference Wrigley2016). Similarly to industrialization, driven by this fundamental shift in the energy system, the Net-Zero Industry Plan, approved by the European Commission in 2023, seeks to promote a model of green reindustrialization based on the transition to zero-carbon technologies, aligning with the European Green Deal of 2019 (EC, 2019, 2023).
Between 2014 and 2018, industry was the largest consumer of energy and the highest emitter of CO₂ (Rissman et al., Reference Rissman, Bataille, Masanet, Aden, Morrow, Zhou, Elliott, Dell, Heeren, Huckestein, Cresko, Miller, ROY, Fennell, Cremmins, Koch Blank, Hone, Williams, De La Rue Du Can, Sisson, Williams, Katzenberger, Burtraw, Sethi, PING, Danielson, LU, Lorber, Dinkel and Helseth2020; Lamb et al., Reference Lamb, Wiedmann, Pongratz, Andrew, Crippa, Olivier, Wiedenhofer, Mattioli, Khourdajie, House, Pachauri, Figueroa, Saheb, Slade, Hubacek, Sun, Ribeiro, Khennas, De La Rue Du Can, Chapungu, Davis, Bashmakov, Dai, Dhakal, TAN, Geng, GU and Minx2021), primarily due to its intensive use of fossil fuels to generate electricity and produce large-scale energy services—lighting, heating, and power. As noted by Fouquet (Reference Fouquet2008), during the early stages of industrialization, industry required vast amounts of heat, supplied by coal combustion, to manufacture large quantities of intermediate goods. However, energy requirements have progressively declined at multiple levels, reducing industrial energy intensity: less energy is needed to generate energy services, fewer energy services are required to produce basic materials, and lower proportions of basic materials are needed to manufacture final products (Percebois, Reference Percebois1989; Fouquet, Reference Fouquet2010). As technology and industrial specialization changed, heat production became less central to industry, while highly automated sectors replaced more energy-intensive activities.
Nevertheless, fossil fuels remain difficult to replace in key sectors, such as large-scale production of pig iron, cement, and certain chemicals (Smil, Reference Smil2009, Reference Smil2016). Moreover, advances in resource efficiency can generate a rebound effect, also known as the Jevons Paradox (Jevons, Reference Jevons2000), whereby savings derived from efficiency do not lead to a reduction but rather to an absolute increase in primary consumption (Polimeni et al., Reference Polimeni, Mayumi, Giampietro and Alcott2008; Sorrell, 2009; York et al., Reference York, Adua and Clark2022). Even so, there is evidence of a long-term decline in energy intensity across European countries, albeit following different trajectories (Gales et al., Reference Gales, Kander, Malanima and Rubio-Varas2007; Kander et al., Reference Kander, Malanima and Warde2014; Nielsen et al., Reference Nielsen, Warde and Kander2018). Portugal and Spain experienced a marked decline in energy intensity between 1950 and 1973, followed by a brief reversal thereafter (Henriques and Kander, Reference Henriques and Kander2010; Henriques, Reference Henriques2011).
In Spain, the transition to fossil fuels extended from the mid-nineteenth century until its completion around 1950 (Rubio-Varas, Reference Rubio-Varas2005; Muñoz Delgado and Rubio-Varas, Reference Muñoz Delgado, Rubio-Varas, Iriarte and INFANTE-AMATE2024). From that point onward, coinciding with the intensification of the Spanish industrial sector (Carreras, Reference Carreras2005; Prados de la Escosura, Reference Prados De La Escosura2017), total energy consumption tripled, and the energy mix—i.e., the combination of primary energy sources—became increasingly concentrated in oil (Rubio-Varas and Muñoz Delgado, Reference Rubio-Varas and Muñoz Delgado2019). Following the decline triggered by the second oil shock in 1979, energy consumption entered a new phase of rapid growth until the 2008 financial crisis, where fossil fuels still dominated (Muñoz Delgado and Rubio-Varas, Reference Muñoz Delgado, Rubio-Varas, Iriarte and INFANTE-AMATE2024).
How did industrial specialization affect the broad economy, energy intensity, and fossil fuels consumption? Available datasets are limited to broad aggregates for the entire economy, focusing on primary energy consumption—i.e., total energy demand. Final consumption, understood as the set of energy carriers used by end users (Eurostat, 2024), has not yet been reconstructed at a disaggregated level. This data gap not only prevents identifying the industrial energy intensity in Spain over the long term—which has been shown to be one of the main drivers of international differences in overall energy intensity (Guevara et al., Reference Guevara, Henriques and Sousa2021)—, but also the quality of energy use—namely, which energy services were required by industry and in what quantity, and how these patterns influenced energy transitions.
The issue becomes even more significant when considering the interconnections between efficiency, industrial growth, and energy use. On the one hand, there is evidence that productivity gains in certain manufacturing sectors were crucial to economic growth during the so-called “economic miracle” (Sanchís Llopis, Reference Sanchís Llopis2006). Additionally, the positive effects of electrification on industrial growth prior to the Civil War, by reducing dependence on coal, and on economic growth since 1958 have been well documented (Betrán, Reference Betrán2005; Sanz Villarroya and Sanaú, Reference Sanz Villarroya and Sanaú2016). Did a relationship exist between higher demand for electric energy services, lower fossil energy flows, and industrial output? How did industrial structure shape the link between energy consumption and economic development?
Also, there is evidence of the strong influence of fossil fuels on economic growth. As noted by Sudrià (Reference Sudrià, Martín Aceña and Simpson1995, Reference Sudrià1997), early twentieth-century industrial growth in Spain was heavily reliant on energy-intensive industries. By the late twentieth century, several studies highlighted the link between rising fossil fuel flows and extractive activities, particularly during the construction boom (Carpintero, Reference Carpintero2005; Infante-Amate et al., Reference Infante-Amate, Soto, Aguilera, García-ruiz, Guzmán, Cid and González De Molina2015, Reference Infante-Amate, Vila-Traver, Aguilera, Sanjuán, Oropesa and González De Molina2021). To what extent was industrial growth dependent on fossil fuel consumption, and how did this affect the transition toward carbon-neutral energy sources?
To address this research gap, this article presents an annual series for twelve industrial sectors, detailing primary sources, secondary carriers, energy services and energy intensity from 1960 to 2021. This dataset results from the extraction, correction, and harmonization of different industrial sources with different levels of sectoral aggregation and methodological approaches to energy consumption accounting. The meso-sectoral approach adopted here enables a precise identification of which industrial activities concentrated energy use during different phases of industrial development, which energy sources and services shaped these trajectories, and whether the types of energy consumed responded to patterns of industrial specialization, the demand for specific products during phases of industrialization and the construction boom, or the energy policies implemented in each period.
This article examines whether the industrial structure shaped an energy consumption pattern that helps explain the long-standing reliance on fossil fuels and the persistent energy inefficiency of the industrial sector. It hypothesizes that the slow and discontinuous transition toward a carbon-neutral industry was hindered, up to the 1980s by the composition of the electricity mix, and since the 1990s by the influence of the construction boom in Spain.
The text is structured into five sections. The first section outlines the key concepts and highlights the key methodological steps applied to reconstruct historical series. The second section tests the hypothesis of the industrial constraint, examining the evolution of primary and final energy use by source in the industrial sector. The third section analyzes energy services demanded by the industrial structure and its influence on the persistence of fossil fuels. The fourth section explores the implications of these trends for energy intensity and how they compare to broader European trajectories. Finally, the fifth section presents the conclusions.
2. Methodology
The possibilities for reconstructing long-term annual series disaggregated by energy source are limited prior to the development of national statistics and industrial censuses (Parejo, Reference Parejo2001; Coll And Fortea, Reference Coll and Fortea2002). For this reason, the present study focuses on industrial history from 1960 onward, specifically on manufacturing and extractive industries, disaggregated into the twelve sectors (see Appendix A.1).
On the one hand, it is essential to distinguish between final energy consumption and primary energy consumption. Final consumption includes the set of secondary energy carriers used by end users within the industrial sector (Eurostat, 2024) to produce energy services. In total, ten energy carriers are identified: biomass, electricity, natural gas, gasoline, gasoil, liquefied petroleum gas (LPG), petroleum coke, fuel oil, coke, and other coal derivatives.
On the other hand, primary energy consumption refers to the total energy demand of the industrial sector. It has been estimated by applying conversion factors to the final consumption series (see Appendix A.2.2). We distinguish eight primary energy sources: hydropower, wind, solar, nuclear, biomass, natural gas, oil, and coal.
The most common indicator for assessing the long-term energy efficiency of economic activities is energy intensity (Gales et al., Reference Gales, Kander, Malanima and Rubio-Varas2007; Kander et al., Reference Kander, Malanima and Warde2014; Nielsen et al., Reference Nielsen, Warde and Kander2018), measured as physical energy consumption per unit of monetary output. The limitations of this indicator are well known, as it captures changes beyond energy efficiency, such as shifts in industrial structure. Some methodological alternatives assess energy consumption in physical terms through socio-metabolic accounting, which differentiates between flows—material and energy inputs and outputs—and funds or stocks, i.e., structures maintained by energy flows (Fischer-Kowalski et al., Reference Fischer-Kowalski, Krausmann, Giljum, lutter, Mayer, Bringezu, Moriguchi, Schütz, Schandl and Weisz2011; Krausmann et al., Reference Krausmann, Schandl, Eisenmenger, Giljum and Jackson2017; Schandl et al., Reference Schandl, Fischer-Kowalski, West, Giljum, Dittrich, Eisenmenger, Geschke, Lieber, Wieland, Schaffartzik, Krausmann, Gierlinger, Hosking, Lenzen, Tanikawa, Miatto and Fishman2018). Other approaches consider efficiency in terms of exergetic cost, which evaluates useful energy consumption according to the second law of thermodynamics, excluding wastes and losses (Ayres, Reference Ayres1998; Serrenho et al., Reference Serrenho, Sousa, Warr, Ayres and Domingos2014).
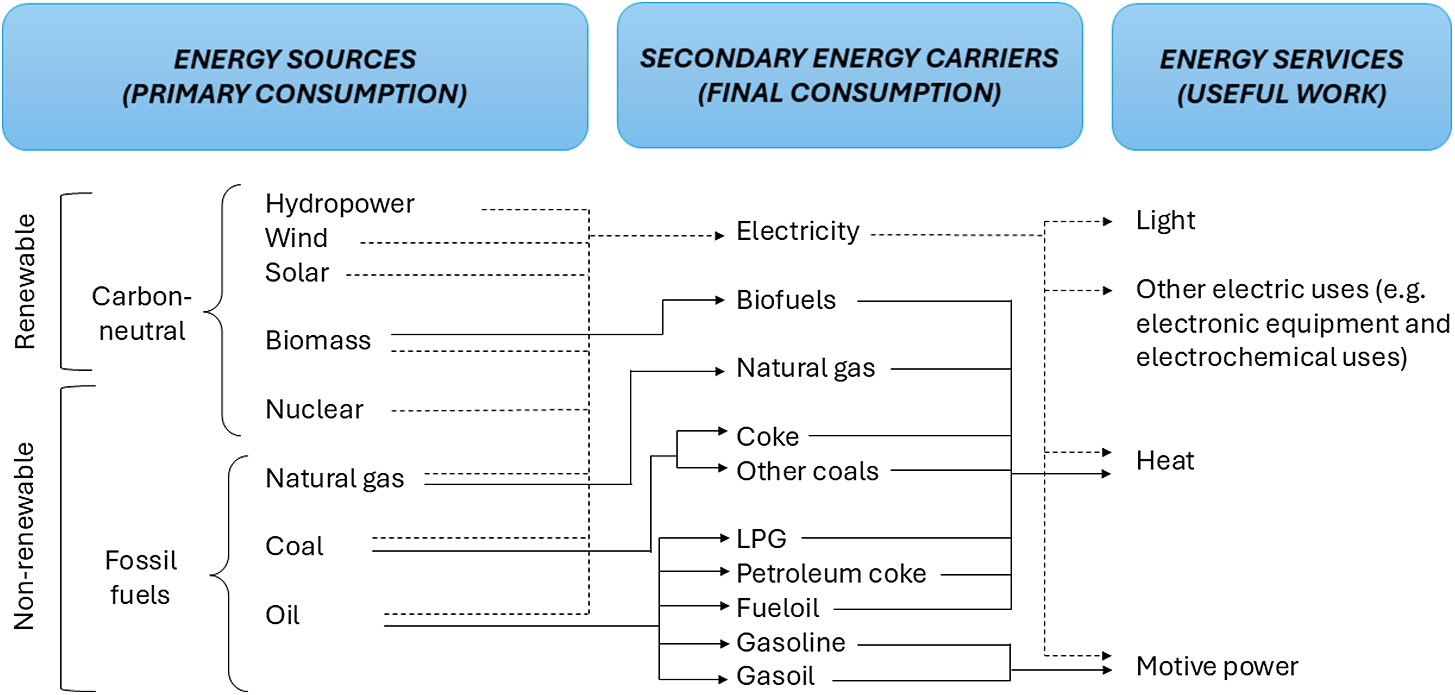
In this study, we use energy intensity as an indicator of the economic efficiency of energy use to engage with the long-term energy consumption literature and highlight the specificities of its application to the industrial sector. Because industrial energy use depends qualitatively on the nature of the processes involved, we also estimate the energy services demanded by industry. These services are quantified as useful work, which refers to the portion of energy that can be effectively converted into mechanical, thermal, or other functional energies for a specific end-use (see Appendix A.2.3 for methodological details). While primary energy sources are first converted into secondary energy carriers within the energy sector, industrial activities ultimately draw from these carriers to extract useful work that delivers final energy services. This relationship is illustrated in Figure 1.
Primary energy sources, secondary energy carriers, and energy services in industry.

The final energy consumption and sectoral value-added series presented in this study result from different industrial statistical sources. Despite its problematic statistical rigor, no other industrial sources provide energy use data, making it necessary to use them through different correction procedures. These constitute the main methodological contribution of the article. The high variability in both the level of aggregation of consumed energy categories and the industrial subsectors required converting them into gigajoules (GJ) to align with international balances (see Appendix A.2.1). Primary energy consumption has been reconstructed using standardized primary-final conversion factors (see Appendix A.2.2). Value-added data, deflated to 2010 prices, were obtained from Prados de la Escosura (Reference Prados De La Escosura2017). Sectoral value-added data (in current prices) for manufacturing and extractive industry were sourced from the national accounts and then scaled to match the industrial value-added series provided by Prados DE la Escosura (Reference Prados De La Escosura2017) at constant prices. Energy intensity was calculated by dividing total primary energy consumption by value added at constant prices.
3. The enduring role of fossil fuels in Spanish industry
Total primary energy consumption in industry has become relatively decoupled from fossil fuel consumption over the long term, but these trends exhibit notable temporal discontinuities, as shown in Figure 2a. Between 1960 and 1974, fossil fuels dominated primary consumption, increasing at a slightly higher rate than total primary consumption, resulting in a strong concentration of energy use around hydrocarbons. Oil accounted for 54.3% of the industrial energy mix in 1974, as depicted in Figure 2b, and maintained its dominance despite the first oil shock.
Index of total and per capita primary consumption and total primary fossil fuels consumption in industry (1960 = 100), and share of industrial primary consumption over total (a). composition of primary energy consumption in industry, 1960–2021 (b).

Unlike the first crisis, the second oil shock had markedly different effects. Figure 2a points out a decline of 10% in primary consumption between 1980 and 1986, primarily driven by a sharp drop in oil in a context shaped not only by energy constraints but also by the deindustrialization of the most energy-intensive sectors (Martín Aceña and Comín, Reference Martín Aceña and Comín1991).
The expansion of nuclear energy played a major role in the relative decline of fossil fuels between 1980 and 1988, but the growing contribution of natural gas reversed this trend from the late 1980s onward. Its increased use drove the second energy acceleration—identified in Figure 2a during the construction boom—raising the share of fossil fuels to 76.2% by 2005. During the years of the Great Recession, industrial primary energy consumption experienced an unprecedented collapse of 36.4%, as shown in Figure 2a.
These findings prompt further inquiry into the underlying drivers of this trajectory. Per capita industrial primary energy consumption exhibited a growth pattern broadly aligned with that of total primary energy consumption, yet the divergence between the two suggests that population growth alone cannot fully account for the observed increases in industrial energy use. Considering this, we propose a sectoral analysis to test the hypothesis that structural constraints have shaped patterns of fossil fuel consumption.
Figure 3a highlights the dominance of three sectors in long-term primary energy consumption: (1) iron and steel, which led the ranking during the early period; (2) non-metallic minerals and building materials—hereafter referred to as building materials—which maintained a similar share over the long term; (3) the chemical and petrochemical industry, which briefly took the leading position from 2012 to 2016. Together, these sectors accounted for approximately 56% of primary energy consumption between 1960 and 2021 (Figure 3b).
Total (a) and relative (b) primary consumption in twelve industrial sectors, 1960–2021.

These sectors exhibited notably fossil-fuel-intensive trajectories, incorporating relatively low levels of carbon-neutral energy sources until 2007, as depicted in Figure 4. It is noteworthy that the sectors identified by Sanchís Llopis (Reference Sanchís Llopis2006), as leading industrial development between 1958 and 1975 were not the main energy consumers during the same period. However, they depended on inputs with high embodied energy from the most energy-intensive branches. Just as productivity gains in the most efficient sectors contributed to value-added growth through the production of capital goods and more productive inputs, a reverse relationship occurred from a physical standpoint: rising fossil energy flows from basic industries underpinned and fueled the entire industrial system during Spain’s “economic miracle.” Faced with oil shortages, they underwent a reversible transition back to coal in the 1980s and later led natural gas consumption, as shown in Figure 4.
Primary energy consumption by sector and energy source, 1960–2021.

However, it is important to clarify that the primary use of fossil fuels in industry is not straightforward. Coal, oil, and natural gas can be consumed in two main ways: (1) directly, through their derivatives (e.g., the primary use of oil to produce the gasoil finally consumed), and (2) indirectly, via electricity generation from fossil fuels. In this context, the implications for both the scale and quality of industrial energy consumption are highly significant. Regardless of its source, electricity consumption provides more efficient and versatile energy services. Moreover, electrification plays a key role in decarbonization, as it reduces CO₂ emissions by enabling a shift in final energy consumption toward primary sources with lower emission factors, such as natural gas, or toward carbon-neutral sources, such as renewables and nuclear power.
In other words, a substantial reduction in primary fossil fuel consumption would have required a strong electrification of final industrial consumption. Indeed, industry was the largest consumer of electricity in the economy in 1960, accounting for approximately 60% of total consumption. However, compared with other carriers, industrial electrification was minimal, accounting for only 11.5% of final energy consumption in 1960, as shown in Figure 5b. This reflects the role electricity played in the industrialization process and the historically low levels of electricity use in other sectors, a legacy of autarkic policies. Francoism’s constraints hindered both the expansion of energy supply, and the renovation of electrical infrastructure needed for greater efficiency (Sudrià, Reference Sudrià1997, Reference Sudrià, García Delgado and Jiménez2006). The lifting of these constraints in the 1950s, along with rising oil imports, enabled the adoption of new thermoelectric technologies using fuel oil and coal, eventually surpassing hydropower (Cano-Rodríguez et al., Reference Cano-Rodríguez, Rubio-Varas and Sesma-martín2022).
Total (a) and relative (b) final energy consumption by energy carrier in industry, 1960–2021.

With a more stable primary energy supply, industrial electricity consumption increased sixfold in absolute terms from 1960 to 1980, as shown in Figure 5a, and to 25.5% of the final energy mix, as depicted in Figure 5b. However, fuel oil flows expanded even more rapidly until the 1970s, outpacing the contribution of electricity, which faced significant constraints during the 1980s (Rubio-Varas and Muñoz Delgado, Reference Rubio-Varas, Muñoz Delgado, De La Torre and Rubio-Varas2022). Alternatives to oil encountered major limitations, including insufficient infrastructure for natural gas and the financial and political controversies surrounding nuclear power, which culminated in the 1983 moratorium (Sudrià, Reference Sudrià1983; Rubio-Varas and De la Torre, Reference Rubio-Varas and De La Torre2017). As a result, industrial electrification slowed from the mid-1980s (Figure 5b), while the final use of natural gas came to dominate the energy mix until 2021.
Once again, industrial structure appeared to act as a constraint—this time on the electrification of the final energy mix. Over the long term, the three leading sectors drove final fossil consumption above that of electricity, as illustrated in Figure 6. Meanwhile, the more productive sectors pointed by Sanchís Llopis (Reference Sanchís Llopis2006) were able to increase the share of electricity in their final energy mix. This asymmetry in final energy consumption is closely linked to the quality of energy services required by each industrial sector, as we shall see shortly.
Final consumption by industrial use in twelve sectors, 1960–2021.

4. What was energy for? Energy services, useful work and industrial constraints
Beyond the continued reliance on fossil fuels, it is important to acknowledge that all sectors have gradually transitioned toward a final energy mix increasingly dominated by more efficient energy carriers. Technologies powered by electricity and natural gas provide superior, more efficient energy services than machinery reliant on coal and oil. Critically, the pursuit of higher-quality energy services—measured by the useful work derived from final consumption—has played a significant role in driving energy transitions and cost-saving trajectories, thereby facilitating long-term industrial growth (Fouquet, Reference Fouquet2010).
The higher quality of energy services provided by electricity helps explain why the electrification of industrial consumption in coal-poor countries such as Spain became a key driver of industrial growth prior to the Civil War (Betrán, Reference Betrán2005), as it significantly reduced reliance on coal. Furthermore, from 1958 onward, electrification has been recognized as a key factor in overall economic development in Spain (Sanz Villarroya and Sanaú, Reference Sanz Villarroya and Sanaú2016; Sanaú Villarroya et al., Reference Sanaú Villarroya, Sanz-villarroya and Perez Y Perez2021).
However, the energy-production nexus in industry from the 1960s is not clear, as manufacture experienced a fossil-intensive path while electrifying part of its final energy mix. To compare the contribution of each energy carrier to industrial production in flow terms, we measure the amount of energy services it can provide—that is, the amount of useful work extracted from each carrier that the industrial sector required to generate output. Figure 7a illustrates the intensity of useful work derived from fossil fuels and electricity. The intensity of useful work extracted from electricity increased between 1960 and 1970, likely reflecting the culmination of the process analyzed by Betrán (Reference Betrán2005): the widespread installation of electric motors, which provided a great deal of higher-quality motive power and significantly enhanced productivity, primarily through labor-saving effects. Concurrently, the intensity of fossil-based useful work declined, probably due to the modernization of energy converters in the 1960s (Sudrià, Reference Sudrià1997) and the crisis of heavy industry sectors during the 1970s and 1980s.
(a) Useful work intensities from electricity and fossil fuels and (b) Relative useful work use by energy service in industry.

Despite these advances, industry remained more dependent on energy services provided by fossil fuels than on electric ones. As shown in Figure 7a, useful work intensity from fossil fuels consistently exceeded useful work intensity from electricity throughout the period. Furthermore, both intensities stagnated from 1980 onward and even increased in the early twenty-first century.
This evidence suggests that the dynamic identified by Madureira (Reference Madureira2008) for the period before 1945 persisted thereafter—namely, that Southern European countries followed a pattern of electricity substitution in which increasing the output of the substitute (electricity) paradoxically required greater reliance on the resource it aimed to replace (fossil fuels). Despite the adoption of more efficient electric prime movers, this same dynamic contributed to a rise in oil and natural gas consumption through two distinct mechanisms. First, through the primary production of electricity, which became increasingly dependent on fossil fuels until the 1980s (see Cano-Rodríguez et al., Reference Cano-Rodríguez, Rubio-Varas and Sesma-martín2022). In other words, as the industry benefited from higher quality energy services from electricity, it locked in fossil dependence. Second, through the energy services demanded by the heating-intensive industrial structure shaped during earlier phases of industrialization. In this way, the most energy-intensive sectors relied heavily on services that electricity could not feasibly provide—particularly thermal energy.
According to Fouquet (Reference Fouquet2010), heat production has historically posed a major challenge for industrial development, as it can be derived from nearly any energy carrier, though not all technologies deliver heat of the same quality. Initially, coal—being denser, more easily stored, and more abundant—replaced charcoal for industrial heat generation at the onset of the Industrial Revolution, followed by the development of coke to address issues of fuel-product contact. In subsequent decades, petroleum derivatives and natural gas offered cleaner, more efficient, and cost-effective means of generating heat.
In this context, the development of industries with higher technological content led to a decline in heat demand in advanced economies during the second half of the twentieth century (Fouquet, Reference Fouquet2008). From the 1970s onward, Kander (Reference Kander2005) argues that the adoption of Information and Communication Technologies (ICT) marked a significant improvement in the quality of energy services used in industry, substantially decreasing energy intensity in Sweden. Evidence from the United States, Japan, Austria, and the United Kingdom further supports this trend, showing that useful work per unit of GDP declined beginning in the 1970s (Kander et al., Reference Kander, Malanima and Warde2014).
The Spanish industry was embedded within this broader context. Figure 7b illustrates the relative contribution of each energy service to total useful work obtained in manufacturing. In 1960, heat accounted for approximately 85% of total energy service demand, as the most energy-intensive sectors relied heavily on it to produce construction materials, basic metals, and chemical substances. Improvements in heat production efficiency might have reduced its share to 61% by 1980. In parallel, other energy services associated with electricity—such as mechanical power—expanded their role within the industrial energy mix.
However, since the 1980s, this relationship appears to have stagnated. Heat has consistently accounted for approximately 70% of industrial energy service demand, with the majority corresponding to high-temperature heat. Meanwhile, electricity uses associated with ICT continued to grow at a slower absolute rate but declined in relative terms.
This trend may reflect specific improved efficiency in electricity-based services, but it also suggests a limited development of high-tech-intensive sectors. In any case, this did not improve overall industrial efficiency, as patterns identified by the literature for economies adopting ICT are not reflected in Figure 7a. Useful Work Intensity in industry flattened from the 1980s, and increased between 1999 and 2005.
This could explain why heat—specifically high-temperature heating services—remained as the dominant industrial energy service. This persistence is partly attributable to the oversized building materials sector. For instance, brick production requires temperatures exceeding 1,000ºC, while clinker production demands over 1,500ºC. This sector faced technical limitations in electrifying heat generation and instead turned to natural gas as a cleaner and more efficient energy source to fuel the construction boom.
The question then arises: to what extent have more efficient technologies mitigated the inefficiencies stemming from the size of these activities, which—due to their scale and energy requirements—could entrench an energy-intensive industrial structure dependent on polluting energy sources? To answer this question, the next section offers a comparative analysis of total energy intensity and fossil fuel energy intensity and discusses the Spanish difference in the European context.
5. Industrial energy intensity and zero-carbon transition in the European mirror
The scenario described had significant implications for the industrial energy intensity. On one hand, more efficient technologies fueled by new energy sources were adopted. Energy intensity in the Spanish economy improved substantially during the transition from coal to oil. On the other hand, improvements in energy intensity also continued during the structural change in the early 1980s, despite there being no major transition in the energy mix (Rubio-Varas, Reference Rubio-Varas2005; Muñoz Delgado and Rubio-Varas, Reference Muñoz Delgado, Rubio-Varas, Iriarte and INFANTE-AMATE2024).
This structural factor is particularly relevant for assessing energy intensity in the industrial sector. As we pointed out earlier, energy intensity reflects factors beyond just efficiency. Even if energy intensity decreases across all sectors, it will not significantly improve at the aggregate level if the most energy-intensive sectors expand across the overall industrial structure. Moreover, their effects on total consumption may be contrary to what is expected. As William S. Jevons pointed out in the nineteenth century (Jevons, Reference Jevons2000; Alcott, Reference Alcott2005) and as recent studies have shown (Lemoine, Reference Lemoine2020; Stern, Reference Stern2020), energy efficiency improvements, especially when they come from the energy sector, can lead to a rebound effect that increases both production and total energy consumption.
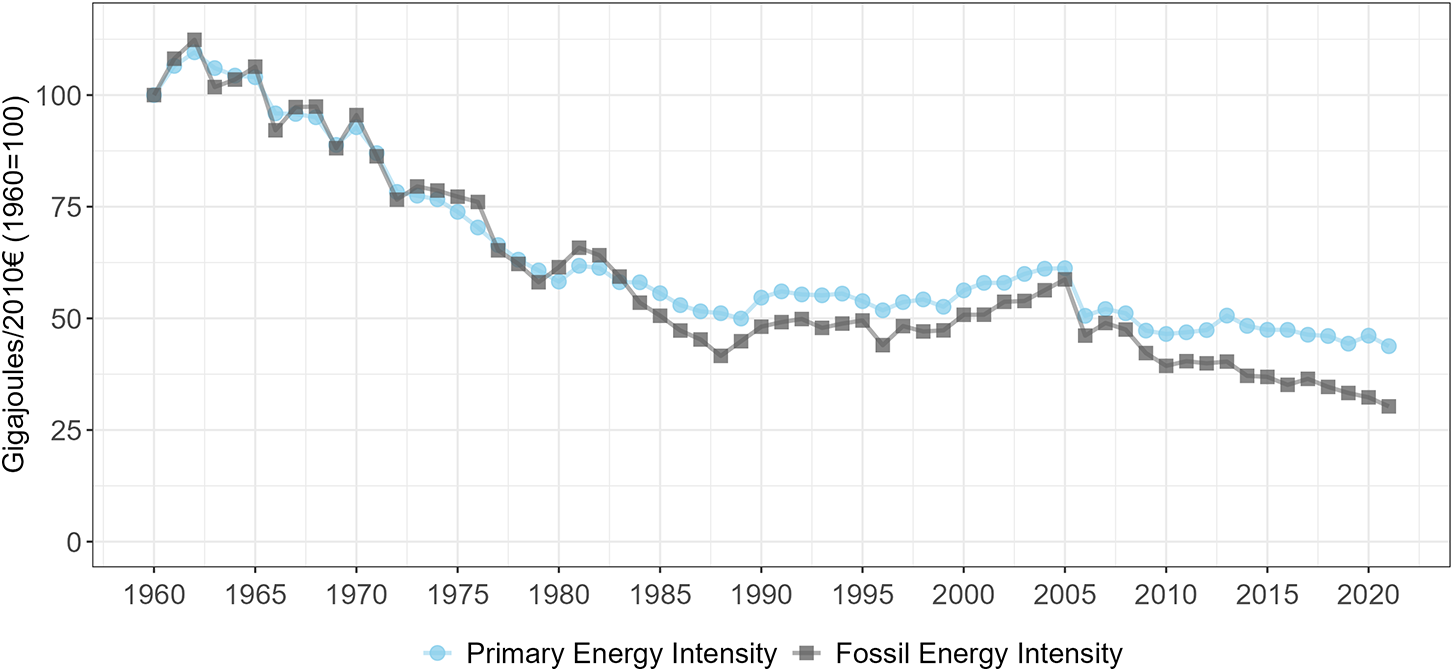
What were the trends in industrial energy intensity, and what explains them? As shown in Figure 8, a significant decline in primary energy intensity occurred during the first half of the period under study. Between 1960 and 1989, energy intensity decreased by 50%. Fossil fuel energy intensity fell by 55.1% over the same period. This trajectory closely followed that of primary energy intensity up to 1983. This early coupling can be explained by the carbon intensity of the electricity mix, based on coal and fuel oil until the 1980s, and on coal and nuclear since then, to the mid-1990s. The adoption of natural gas can explain the recoupling until the Great Recession.
Primary energy intensity and fossil energy intensity in industry, 1960–2021.

These shifting decoupling dynamics indicate that the most significant improvements in energy intensity occurred within the framework of fossil fuel consumption. As shown in Figure 8, the industry became increasingly energy efficient in the early decades, largely due to a greater reliance on thermoelectricity through the 1980s. Producing with lower energy intensity could foster greater primary fossil consumption, which explained why the great acceleration in energy consumption between 1960 and 1980 occurred in parallel with the great decline in energy intensity. A similar process was unfolding in Portugal during the same period, in which the efficiency gains from electricity consumption—largely generated from fossil sources—led to increased dependence on fossil fuels (Felício et al., Reference Felício, Henriques, Guevara and Sousa2024).
However, stagnation of electrification from 1989—followed by rising demand for non-metallic and building materials—undermined Spanish industry’s capacity to continue reducing its overall fossil energy requirements. Figure 8 indicates a new increase between 1989 and 2005 in total energy intensity and fossil fuel intensity of 22.6% and 41.2%, respectively, reflecting a renewed convergence of both indicators.
This trend was likely related to the overall stagnation in energy intensity across all sectors, as well as to the relative expansion of the most energy-intensive activities. Table 1 presents five-year averages of sectoral primary energy intensities (MJ/2010€). Although energy intensity has declined in the long term, an increase is observed between 1995 and 2005, particularly in the most energy-intensive sectors.
Primary energy intensity by sector in five-year averages (MJ/€2010)

Source: Own elaboration (see Section 2).
Notes: Sectors are listed in descending order of primary energy intensity in 1961–1965.
This trend reveals the industrial structure’s inability to increase the relative contribution of more energy-efficient technologies and its continued reliance on heating-intensive pathways. This presents a compelling case, as it is stated that mature industries typically adopt more efficient technologies and require increasingly complex energy services, which tend to rely more on electricity. The logical outcome of this shift would be a decline in energy intensity and an increase in the share of carbon-neutral energy sources. Henriques and Kander (Reference Henriques and Kander2010) analyzed energy intensity across 10 countries in 1971 and 2005, concluding that in many cases, the reduction in overall energy intensity was largely driven by the diffusion of ICT in manufacturing.
Eurostat data, presented in Table 2, confirm this pattern from 1990 to 2005. Across EU member states, the general trend prior to the Great Recession was a decline in energy intensity and a growing share of carbon-neutral energy in industrial consumption. At varying speeds, the electrification of European industries enabled more efficient energy use and laid the foundation for low-carbon transitions. German and British industrial production, which ranked first and fourth in industrial primary energy consumption, respectively, reduced their energy intensity by around 15% between 1990 and 2005. Although starting from higher fossil fuel consumption levels than Spain—due to the intensity of deindustrialization in the latter—German industry reduced its relative fossil fuel use by 7.3%, while French industry reduced it by 10%.
International comparison: primary energy intensity, fossil fuel share and building materials weight in European industries

Source: Own elaboration (see appendix A.2.4) based on energy data from Eurostat (2025), and output data from Smits et al. (2009), Timmer et al. (2015) and UNSD (2025).
Note: The EU27 category includes the European Union members as of February 1, 2020. Countries are listed in descending order of primary industrial energy consumption in 2005.
In contrast, the Spanish industry followed a divergent path. As analyzed earlier, during the construction boom years, Spain moved toward a more energy-intensive industrial structure that remained heavily dependent on fossil fuels—undermining its energy efficiency and deepening its reliance on carbon-based energy sources.
The Spanish trajectory was only comparable to that of other Southern European industries. Henriques (Reference Henriques2011) noted that Portugal was the only country where industrial energy intensity increased between 1971 and 2006. This trend was attributed to deindustrialization, the inability to develop technology-intensive sectors, and a structural shift toward the chemical industry and non-metallic mineral products—including building materials.
However, Table 2 indicates that primary energy intensity in industry also increased in other countries toward the end of the twentieth century, and that all of them shared an oversized non-metallic minerals and building materials sector. This branch accounted for 32.5% of industrial primary energy consumption in Portuguese industry and 19.8% in Italy—figures that far exceeded those of France, Germany, and the UK, where it represented less than 10%. In addition to other factors highlighted by Henriques (Reference Henriques2011) as determinants of the diverging energy intensity trajectories in Spain and Portugal—such as the weight of commercial transport and comfort in service sector—the scale of the building materials industry in late-industrializing economies that faced severe energy constraints and deep deindustrialization should not be overlooked. This is particularly relevant in the case of Spain, where massive demand for construction was driven by real estate speculation and intense tourism cycles in the late 20th and early 21st centuries (Albaladejo et al., Reference Albaladejo, González-martínez and Martínez-garcía2020).
In Spain, the slow relative growth in electricity also hindered access to carbon-neutral sources between 1990 and 2005. During this period, German industry increased its electricity share by 8 percentage points, a rate slightly higher than France, the UK, and Italy, but significantly higher than Spain, where the increase was only 2%.
Therefore, the reasons why the Spanish industry maintained an energy-intensive strategy, specifically one relying on fossil fuels, must be traced back to the industrial structure that took shape by the end of the twentieth century. The impact of the construction boom on the metabolic profile of early twenty-first-century Spain was not limited to its effects on quarry mineral extraction (Carpintero, Reference Carpintero2005; Infante-Amate et al., Reference Infante-Amate, Vila-Traver, Aguilera, Sanjuán, Oropesa and González De Molina2021), which accounted for only 1.7% of industrial primary energy consumption (Figure 4b). Its most significant impact, however, was on the transformation processes in building materials, which required high-temperature heat and presented barriers to electrification.
6. Conclusions
This article presented annual sectoral series on industrial primary and final energy consumption, as well as energy intensity, for the period 1960–2021 in Spain, with the aim of analyzing whether the phase-out of fossil fuels was delayed by structural constraints inherent to the industrial sector itself. The findings suggest that the prolonged reliance on fossil fuels can be partly attributed to the dominance of fossil-based electricity generation up to 1980, to the difficulties in continuing to electrify the final energy mix after 1980, and the exceptionally high demand for heating services until 2008. Based on this evidence, we highlight the following key findings:
First, the industrial structure shaped during Spain’s industrialization became heavily dependent on fossil fuels, concentrated in three core sectors: iron and steel, non-metallic minerals and building materials, and the chemical and petrochemical industries. These activities provided high-energy embodied inputs to the more efficient sectors of the economy. From the perspective of energy flows, the virtuous cycle underpinning the so-called Spanish miracle was embedded within a vicious circle, as fossil fuel dependency became increasingly entrenched across the broader industrial structure.
Second, electrification up to 1980 did not reduce fossil fuel dependency—on the contrary, it intensified it. On the one hand, the simultaneous decline in both primary energy intensity and fossil energy intensity suggests that efficiency gains were primarily driven by more effective use of fossil fuels, thereby triggering rebound effects that help explain the rapid economic acceleration of the 1960s. On the other hand, electrification enabled labor-saving gains by mechanizing motive power generation, but the industrial structure was heavily reliant on heating energy services, which boosted fossil fuel demand for thermal processes.
Third, this dynamic collapsed after 1980, undermining the ability to pursue alternatives in the wake of the energy crisis and deindustrialization. This, in turn, constrained the development of ICT-intensive sectors, leading to a rise in their energy intensity. The overexpansion of construction-related sectors further exacerbated the problem during the real-estate boom, which effectively recreated an industrial structure once again intensive in fossil fuels—a pattern that persisted until the 2008 crisis.
Finally, Spain’s industrial trajectory between 1990 and 2005 was characterized by a rise in energy intensity across sectors, and exhibits notable parallels with those of other Southern European countries—particularly Portugal—where industrial energy intensity continued to increase, fossil fuel consumption remained persistent, and the production of non-metallic minerals and construction materials represented a significantly larger share of total industrial output compared to the European average.
This research has been conducted from the perspective of a transition to a zero-emissions industry. As a limitation, it does not account for substantial differences in carbon intensity among coal, oil, and natural gas, which affect their relevance in the energy transition. To assess the extent to which the identified factors have impacted industry decarbonization, an analysis of CO₂ emissions is essential. This issue warrants future research.
Finally, we have suggested that the Great Acceleration in primary consumption during the 1960s and 1970s may have been influenced by a rebound effect resulting from gains in energy efficiency. To verify the presence of a rebound effect, econometric or decomposition analyses are required. Future research will need to employ these methodologies to clarify the extent to which the historical rebound effect occurred.
Competing interests
The author(s) declare none.
Acknowledgements
This work has benefited from an FPU fellowship awarded by the Ministerio de Universidades (FPU21/00721) and from funding from two R&D projects financed by the Agencia Estatal de Investigación: DESIMPACTA. Desarrollo económico e impactos ambientales en España (siglos XIX-XX). Instituciones, comercio y recursos naturales (PID2021-123220NB-I00), and Historia, Economía y Medioambiente: recursos naturales, instituciones, tecnología (ss XIX y XX) (PID2024-158198NB-C21), as well as from a project funded by the Fundación Ramón Areces (CISP19A6420). The author is deeply grateful to Isabel Bartolomé for her comments and suggestions, which have significantly advanced this research, and to three anonymous reviewers whose feedback has substantially improved the manuscript. Any remaining errors are the sole responsibility of the author.
Appendix
A.1. Concepts and boundaries
This study is limited to the extractive and manufacturing activity groups, excluding industrial service sectors due to the lack of energy data for the analyzed period, energy industry sectors, to avoid double counting, and construction and public works activities, as done in other studies where they are analyzed independently (Carreras and Tafunell, 2005). The disaggregation used (see Table A1) follows the energy balance criteria of the European Commission (EUROSTAT, 2019).

In the accounting of final consumption, energy consumption from sources used as raw materials to produce other, more refined goods (e.g., hydrocarbons converted into plastic polymers) is therefore excluded. Also excluded are records of self-produced electricity and heat by certain companies since 1990, as energy balances provide data only on self-consumption for the entire economy, accounting for 2% and 10% in 1993 and 2020, respectively.
A.2. Calculation procedure
A.2.1. Final energy consumption
Final energy data was extracted from Estadística Industrial de España (EIE, 1960–1977), Encuesta Industrial (EI, 1978–1989/1992) and the energy balances of the Instituto para la Diversificación y el Ahorro Energético (IDAE, 1990–2021). Llopis and Fernández (Reference Llopis and Fernández1997) highlighted poor record-keeping in the metallurgical sectors and in traditional local-market activities such as bakeries, wineries, and garment workshops in the EIE. Similarly, the EI has been criticized for selection bias. Although it captures the most representative production units within the industrial sector, its limited coverage of small establishments and the constraints imposed by statistical confidentiality create discontinuities in time series, significantly hindering the construction of long-term datasets (García et al., Reference García, Goerlich Gisbert and Orts Ríos1994; Zapata, Reference Zapata1996; Carreras, Reference Carreras2005).
Indeed, the EIE posed significant challenges, necessitating graphical inspection and outlier detection. Exploratory analysis revealed a major underestimation of oil consumption in establishments outside industrial census coverage—e.g., local slaughterhouses and carpentry workshops. The 50% surge in oil use between 1976 and 1978 was corrected by applying an adjustment factor from 1960 to 1977 to the meat processing, wood, and paper industries. Gaps in these subsectors were filled through linear interpolation based on aggregate trends.
In the case of electricity, discrepancies between the EIE and data reported in the Estadística Industrial de la Energía Eléctrica, especially in metallurgical sectors, were addressed. Since the trends in the latter align more closely with those of IDAE, the final electricity consumption figures were reconstructed using this source. Second, coke consumption in the steel industry between 1960 and 1990 was estimated using annual coke production data for steelmaking purposes.
The lack of biomass consumption records between 1978 and 1989 was addressed through linear interpolation. Since 1999, a noticeable increase in biomass consumption is observed in the Wood, Paper, and Food industries. This shift reflects a change in statistical accounting: prior to that year, biomass use in these sectors had been aggregated under the broader “Others” category. To ensure consistency in the time series, we reallocate the biomass consumption reported under “Others” between 1990 and 1999 to the Wood, Paper, and Food industries, following the sectoral distribution observed in 1999. The resulting corrections have been cross-checked with the final consumption data from the report La Energía en España (MITYC, 2009).
Second, the variability in sectoral aggregations across national industrial statistics, as well as the diversity of units used to report energy consumption, required a mapping of historical subsectors into standardized categories to align with Eurostat classification. The 1963 edition of the EIE recorded more than 150 industrial subsectors, whereas current energy balances reported data for only twelve industrial branches. This process involved the construction of detailed correspondence tables, which served to reclassify historical subsectors into broader and consistent categories.
The EIE presented data for up to seventeen distinct energy carriers in different physical units. From 1978 onwards, the classification was simplified to seven categories and four measurement units. Eurostat’s energy accounting methodology in the 1990s expanded to twenty-one, with all values expressed in standardized energy units. All historical energy data were converted into gigajoules (GJ) using fixed net calorific values and official conversion factors (see Table A2).
Conversion factors to estimate final and primary consumption

Source: own elaboration based on EUROSTAT (2019)
A.2.2. Primary consumption
Source-specific coefficients adopted to convert final consumption into primary energy use were taken from EUROSTAT (2019) standard conversion factors (see Table 4), along with the annual composition of the electricity generation mix from 1960 onward, as provided by Aguilera et al. (Reference Aguilera, Vila-Traver, Deemer, Infante-Amate, Guzmán and González De Molina2019). This approach incorporates generation mix, efficiency rates, and transmission and distribution losses.
A.2.3. Useful work (energy services)
Like any human activity, industry does not require energy sources per se, but rather the services derived from them. The pursuit of more efficient, safe, clean, and affordable ways to use energy sources to deliver the same energy service, in accordance with available technologies, has been a central driver of energy transitions.
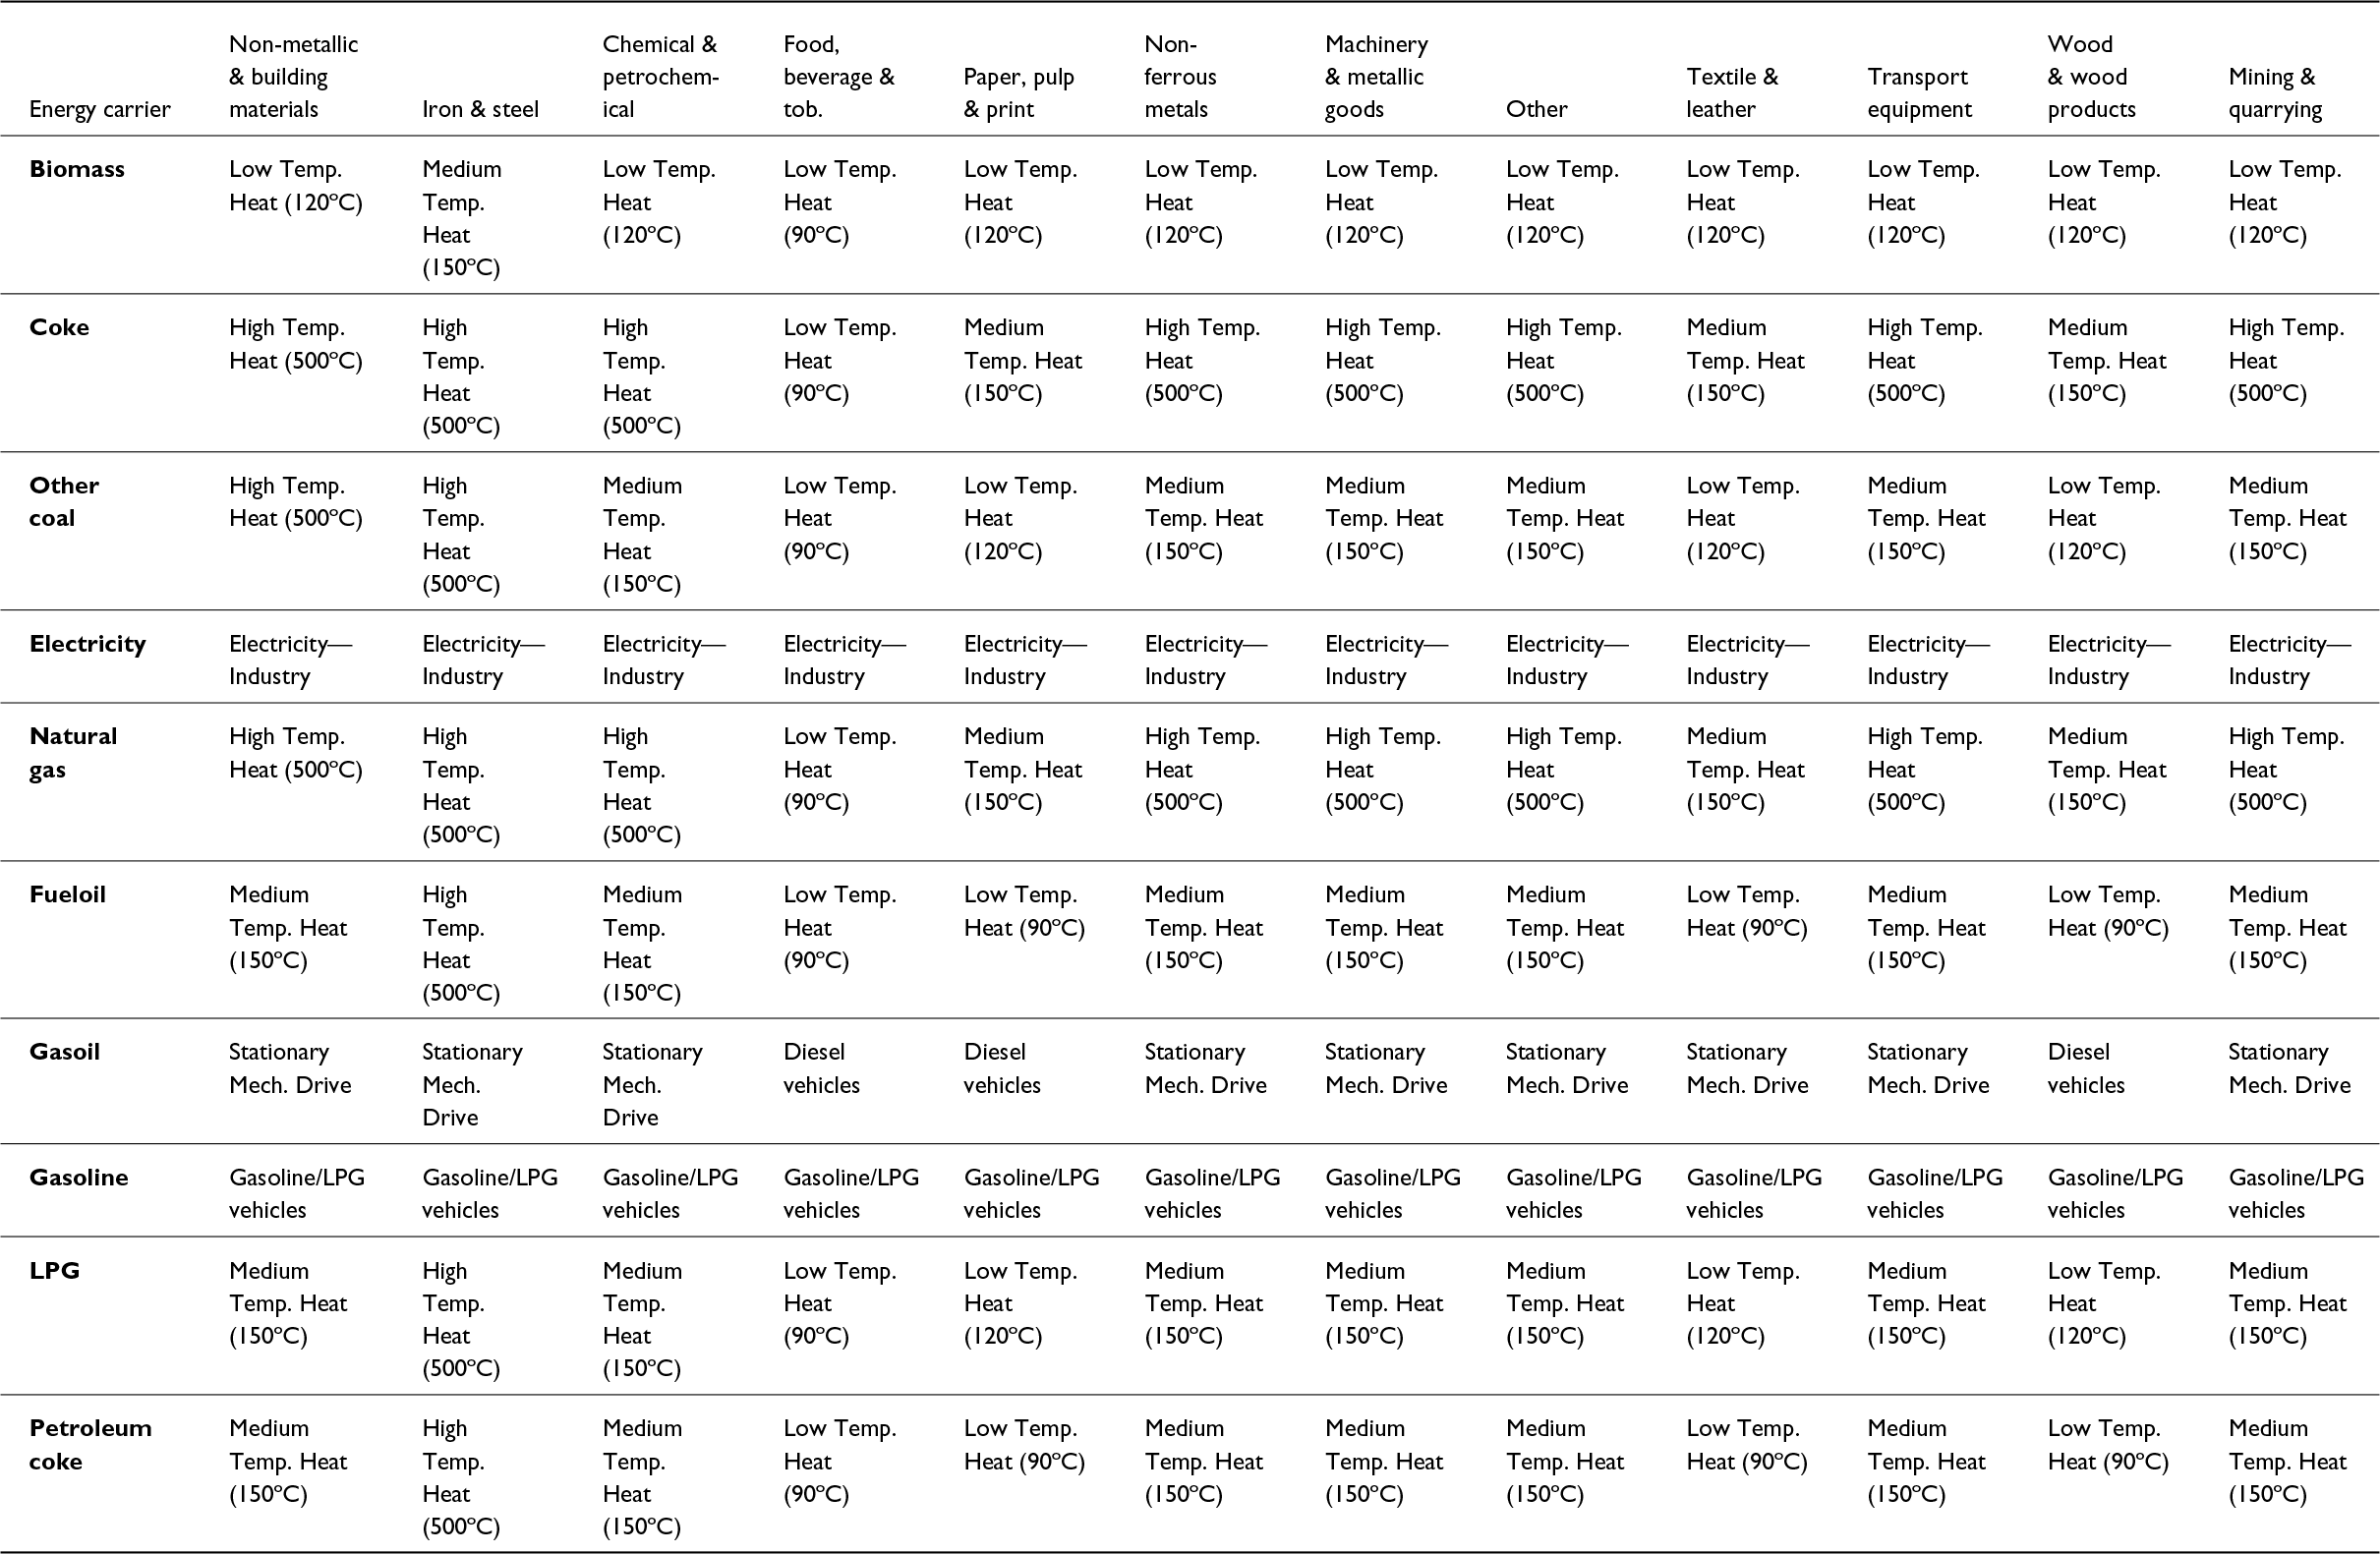
To estimate the energy services demanded by industry, we follow the methodology proposed by Serrenho et al. (Reference Serrenho, Sousa, Warr, Ayres and Domingos2014), (Reference Serrenho, Warr, Sousa, Ayres and Domingos2016). First, we account for the quality of different energy carriers by applying exergy factors to the final energy data for each energy carrier. Second, we link energy carriers to the specific economic functions they serve by classifying exergy use into functional categories associated with energy services: heat (subdivided by temperature), mechanical power, lighting, and other electrical uses (see Table A3). The estimation of useful work derived from electricity includes an additional intermediate step. Annual electricity consumption is disaggregated into four functional categories: heat, power, lighting, and other electric uses (which encompass electronic services and electrochemical separation processes). This allocation is based on the annual composition estimated by Serrenho (Reference Serrenho2013) for each country and sector over the period 1960–2009.
End-uses categories assigned by sector and energy carrier

Source: Own elaboration, adapted from SERRENHO (Reference Serrenho2013)
Third, we determine how much of the input exergy is effectively converted into useful output by applying second-law efficiencies for each end-use and energy carrier combination, which reflect both technological constraints (e.g., thermal efficiency of engines or boilers) and thermodynamic limits (e.g., Carnot efficiency for heat processes). Finally, we obtain the aggregate useful energy metric for the industrial sector by multiplying the exergy input of each end-use category by its respective second-law efficiency. This procedure is adapted from Serrenho (Reference Serrenho2013), and is based on data from the IEA, FAO, and harmonized historical national statistics.
A.2.4. International primary consumption and intensity
The estimation of primary energy consumption for other European industrial sectors was based on Eurostat energy balances (EUROSTAT, 2025), which provide data on final energy consumption disaggregated by industrial branch from 1990 onwards. The methodology used to estimate primary energy consumption was consistent with the approach described in Section A.2.2 and was designed to be methodologically comparable to that employed by AGUILERA et al. (Reference Aguilera, Vila-Traver, Deemer, Infante-Amate, Guzmán and González De Molina2019). It involved a four-step procedure applied to electricity consumption data to determine the contribution of primary energy sources at the national level.
First, the composition of electricity generation by energy sources was calculated for each country using Eurostat data (Eurobase code GEP).
Second, the average efficiency of the electricity generation sector was estimated by comparing total primary energy inputs (code TI_EHG_E), excluding energy used internally by the energy sector (code NRG_EHG_E), with total electricity output (code GEP). This yielded an implicit efficiency coefficient for electricity generation in each country.
Third, transmission and distribution losses were estimated by comparing gross electricity production (GEP) with the final energy available to end users (Eurobase code AFC). These losses were used to adjust the primary input requirements, resulting in a more accurate estimate of the amount of primary energy effectively consumed to supply final-use electricity.
Finally, industrial energy intensity was calculated as the ratio of estimated primary energy consumption to value added, expressed in constant 2015 prices. Value-added data were obtained from the Groningen Growth and Development Centre (Smits et al., 2009; Timmer et al., 2015) and the United Nations Statistics Division (UNSD, 2025).
The main variables reconstructed in this study can be found in Table A4.
Industrial primary energy consumption, energy intensity, and industrial share of total consumption

Source: Own elaboration (see the text).
Notes: The estimation of primary per capita consumption has been calculated using population data from Prados DE La Escosura (Reference Prados De La Escosura2017). The industrial share of total consumption has been calculated based on data from Muñoz Delgado and RUBIO-VARAS (Reference Muñoz Delgado, Rubio-Varas, Iriarte and INFANTE-AMATE2024).