Introduction
With life expectancy increasing, more people are living with chronic illnesses, including both psychiatric and chronic medical health disorders, which are among the leading causes of mortality and morbidity across the globe (Mathers and Loncar, Reference Mathers and Loncar2006). Psychiatric and medical disorders are frequently co-morbid, and their inter-relationship is likely bi-directional (Pan et al., Reference Pan, Lucas, Sun, van Dam, Franco, Manson, Willett, Ascherio and Hu2010; Bondesson et al., Reference Bondesson, Larrosa Pardo, Stigmar, Ringqvist, Petersson, Jöud and Schelin2018). The lifetime prevalence of a psychiatric disorder has been estimated to be as high as 42.2% among persons with one or more medical conditions, compared to 33% for persons with no medical condition (Wells et al., Reference Wells, Golding and Burnam1998).
The presence of multiple medical disorders is associated with a heightened risk of a variety of poor medical outcomes across a continuum of psychiatric disorder severity (Barnett et al., Reference Barnett, Mercer, Norbury, Watt, Wyke and Guthrie2012; Unützer and Ratzliff, Reference Unützer and Ratzliff2015). Individuals who have both medical disorders and psychiatric disorders co-morbidly exhibit increased medical symptom burden and greater functional impairment (Chwastiak et al., Reference Chwastiak, Vanderlip and Katon2014). Early mortality has been found to be up to 38% higher in patients with diabetes and depression than in patients with diabetes alone (Katon et al., Reference Katon, Fan, Unützer, Taylor, Pincus and Schoenbaum2008). In Ontario, all-cause mortality was three times higher among patients with schizophrenia than in the remainder of the population (Gatov et al., Reference Gatov, Rosella, Chiu and Kurdyak2017) and heightened mortality in patients with schizophrenia has been reported elsewhere both in register-based studies (Fors et al., Reference Fors, Isacson, Bingefors and Widerlov2007) and prospective clinical studies (Joukamaa et al., Reference Joukamaa, Heliovaara, Knekt, Aromaa, Raitasalo and Lehtinen2006).
In this study, we examined the impact of psychiatric disorders on mortality rates in the entire adult population of Ontario and in disease-specific cohorts with select common medical disorders at baseline. We assessed the impact of psychiatric disorders graded by their severity, using the Johns Hopkins Adjusted Clinical Groups (ACG®) system (Weiner, Reference Weiner2011), which groups a person's complement of diagnosis codes into ‘aggregated diagnosis groups’ (ADGs) based on their expected need for ambulatory and hospital resources. Our objective was to examine the impact of these categories of psychiatric disorders, prevalent during a 2-year accrual (baseline) period, on mortality over the subsequent 2 years in a large population-based dataset. Additionally, we aimed to examine the impact of our psychiatric disorder categories on 2-year mortality within disease-specific cohorts.
Methods
Study design and setting
We constructed a population-based cohort using register-based records for all individuals aged 16 or older living in Ontario, Canada's most populous province (n = 11 246 910). We examined associations of three categories of psychiatric morbidity as exposures over a 2-year accrual period from 2012 to 2014, with the outcome of mortality over a 2-year period of follow-up from 2014 to 2016, while adjusting for sociodemographic and clinical variables.
Data sources
The study used administrative health care databases and population-based databases, which were linked using unique encoded identifiers, and held at the Institute for Clinical Evaluative Sciences (ICES). A full description of each database can be found in online Supplementary Table e1.
Study population
We included all residents of Ontario (aged 16 and over, and under 105 years at 1 April 2012) who were eligible under the universal Ontario Health Insurance Plan (OHIP) during both the accrual (1 April 2012 to 31 March 2014) and follow-up (1 April 2014 to 31 March 2016) periods, including all deaths during the follow-up period. We excluded all individuals who died during the accrual period or with missing information on age and sex.
Exposure variables
Psychiatric morbidity was identified using ADGs, the base-level diagnosis groups of the Johns Hopkins Adjusted Clinical Groups software® (version 10.0), hereafter referred to as ADGs. Individual diseases or conditions are placed into a single ADG based on five clinical dimensions: duration of the condition, severity of the condition, diagnostic certainty, aetiology of the condition and specialty care involvement, to create groupings that have a similar expectation for future healthcare resource use. ADGs were created by grouping all diagnosis codes during the exposure period from the hospital, emergency department and outpatient claims/records. A detailed description can be found in the online Appendix (online Supplementary Table e1). The ADG categories used were: ADG 23 (Psychosocial: Time-limited/minor conditions, e.g. ‘Adjustment Reaction with Brief Depressive Reaction’); ADG 24 (Psychosocial: Persistent/Recurrent stable conditions, e.g. ‘Depressive Disorder’, ‘Paranoid personality disorder’); and ADG 25 (Psychosocial: Persistent/Recurrent unstable conditions, e.g. ‘Major Depressive disorder, recurrent episode’, ‘Acute schizophrenic episode’, ‘Bipolar Affective Disorder’, ‘Dementia’ and ‘Alcohol dependence’). Individuals exhibiting psychiatric morbidity in more than one category were allocated to the more severe category identified.
Covariates
Sociodemographic characteristics were derived from the Registered Persons Database (Chiu et al., Reference Chiu, Lebenbaum, Lam, Chong, Azimaee, Iron, Manuel and Guttmann2016) and included age, sex and urban/rural residence. Income was derived from Census data (Statistics Canada, 2006) which categorized neighbourhood-level income into 5 quintiles. The presence of specific medical disorders, coded as binary variables, was ascertained through the use of registries or ICES-derived cohorts and included (a) the following chronic conditions; chronic obstructive pulmonary disease (COPD) (Ontario Chronic Obstructive Pulmonary Disease Dataset) (Gershon et al., Reference Gershon, Wang, Guan, Vasilevska-Ristovska, Cicutto and To2009a), congestive heart failure (CHF) (Ontario Congestive Heart Failure Dataset) (Schultz et al., Reference Schultz, Rothwell, Chen and Tu2013), hypertension (Ontario Hypertension Dataset) (Tu et al., Reference Tu, Campbell, Chen, Cauch-Dudek and McAlister2007), cancer, except for basal cell and squamous cell carcinoma of the skin (Ontario Cancer Registry) (Hall et al., Reference Hall, Schulze, Groome, Mackillop and Holowaty2006), asthma (Gershon et al., Reference Gershon, Wang, Guan, Vasilevska-Ristovska, Cicutto and To2009b), rheumatoid arthritis (Ontario Rheumatoid Arthritis Dataset) (Widdifield et al., Reference Widdifield, Bombardier, Bernatsky, Paterson, Green, Young, Ivers, Butt, Jaakkimainen, Thorne and Tu2014), diabetes mellitus (Ontario Diabetes Dataset) (Hux et al., Reference Hux, Ivis, Flintoft and Bica2002), Crohn's disease/ulcerative colitis (Ontario Crohn's and Colitis Cohort Dataset) (Benchimol et al., Reference Benchimol, Guttmann, Mack, Nguyen, Marshall, Gregor, Wong, Forster and Manuel2014) and human immunodeficiency virus disease (HIV) (Ontario HIV Dataset) (Antoniou et al., Reference Antoniou, Zagorski, Loutfy, Strike and Glazier2011), and (b) the diagnosis of myocardial infarction (MI) (Ontario Myocardial Infarction Dataset) (Austin et al., Reference Austin, Daly and Tu2002).
These datasets have been created in-house at ICES by utilizing validated case-finding algorithms to identify individuals with specific medical diseases as described in the ICES online data dictionary https://datadictionary.ices.on.ca/Applications/DataDictionary. Algorithms use hospital, emergency department and outpatient data, and in some instances drug claim information, and specify a combination of a certain number of records, coupled with diagnostic codes, which must have occurred within a certain time period. Validation studies for these disease cohorts typically involve medical chart reviews and report several measures of validity (sensitivity, specificity, positive and negative predictive value).
Outcome variable
The outcome variable in all analyses was all-cause mortality, occurring between April 2014 and March 2016. Mortality information was obtained through linkage to the Ontario Registrar General-Death (ORG-D) files which contain all death records for the province of Ontario from January 1990 to December 2016.
Statistical analysis
Primary analysis: association of psychiatric morbidity and mortality in full cohort
Cox Proportional Hazards Regression was used to model time to death over a 2-year follow-up period from 2014 to 2016; we present relative hazard ratios (and 95% confidence intervals, CI) adjusting for the following characteristics: age (as a continuous variable), sex, neighbourhood income quintile (with the highest income quintile being the reference group), residence (rural v. urban) and the presence of each of the 10 medical disorders listed above.
Secondary analysis: association of psychiatric morbidity and mortality in medical disease-specific cohorts
Here we carried out disease-specific regressions, stratifying all analyses based on the presence of each of the 10 medical disorders in turn, in order to account for differences in acuity of illness/medical morbidity. Time to death for each group over the 2-year follow-up period was analysed using Cox Proportional Hazards models. For each model, we present adjusted hazard ratios controlling for the presence of the above demographic variables and the other medical illnesses.
Violation of the Cox PH proportionality assumption was tested using Schoenfeld residuals and time-dependent covariates in the analysis. Statistical significance was examined at the 0.05 level. All analyses were performed in SAS version 9.4 (SAS Institute, Cary, NC, USA).
Results
Baseline characteristics
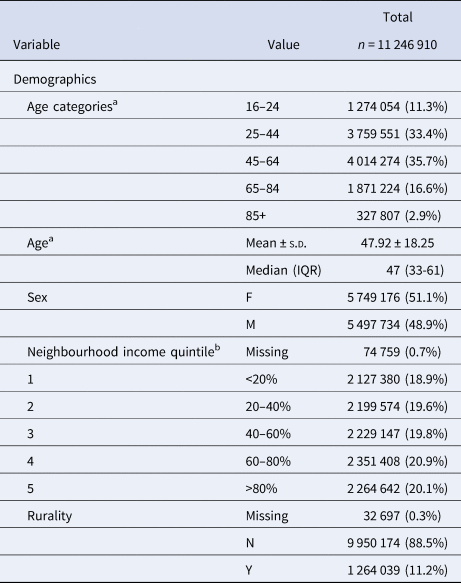
In our sample, 11 246 910 Ontario residents aged over 16 and under 105 at the start of the accrual period were alive throughout the accrual period and continued to live in Ontario either to the end of the follow-up period or to their death, whichever came first (Table 1). Of this cohort, 5 749 176 (51.1%) were female and mean age at the start of the follow-up period (1 April 2014) was 47.92 ± 18.25 years [median age 47 years (33–61)] with 1 871 224 (16.6%) being aged between 65 and 84 years on 1 April 2014, and a further 327 807 (2.9%) over 85 years. The majority of residents (9 950 174; 88.5%) were recorded as living in urban settings.
Descriptive Statistics for Demographics and Healthcare Utilization for the accrual period (April 2012 to March 2014) based on Ontario residents (n = 11 246 910) who were alive at the end of this period.

a Ages are at 1 April 2014, the first day of the follow-up period.
b Quintiles from Statistics Canada derived from Ontario Provincial data, see Appendix 1.
During the accrual period (Table 2), 477 444 residents were classified as being in the ADG 25 diagnostic group, Persistent/Recurrent (unstable) psychiatric morbidity (4.2% of the cohort). Of the remainder, 2 154 500 met criteria for the AGD 24 diagnostic group, Persistent/Recurrent (stable) psychiatric morbidity (19.2%), and 166 486 (1.5%) met criteria only for ADG 23, time limited/minor psychiatric morbidity (Table 2). The other 8 448 480 residents (75.1%) had no psychiatric morbidity coded on their medical records.
Descriptive Statistics for accrual period from April 2012 to March 2014 (psychiatric morbidity and medical comorbidity) based on N = 11 246 910 Ontario residents (n = 11 246 910) who were alive at the end of this period

a Figures relate to individuals meeting criteria for ADG 23 only – any individual additionally meeting criteria for ADG 24 or ADG 25 is assigned only to the higher category.
b Figures relate to individuals meeting criteria for ADG 24 (irrespective of the presence or absence of ADG 23 and in the absence of ADG 25). Any individual additionally meeting criteria for ADG 25 is assigned only to that category.
Among the 10 medical disorders examined during the accrual period (Table 2), hypertension was the most prevalent with 27.7% of the cohort receiving this diagnosis; 14.3% had asthma, 13.0% diabetes, 8.6% COPD and 6.2% cancer (excluding the non-melanomatous skin cancers as described earlier). The remaining disorders were diagnosed in smaller proportions of the cohort during the accrual period, i.e. CHF (2.9%), MI (1.9%), rheumatoid arthritis (1.1%), Crohn's disease/ulcerative colitis (0.7%) and HIV (0.2%).
Mortality over a 2-year follow-up period
Among the 11 246 910 Ontario residents studied, there were 188 014 deaths (1.7%) during the 2-year follow-up/mortality observation period. The case fatality rates of the 10 medical disorders varied from 1.50% for asthma, 2.15% for Crohn's/colitis and 2.50% for HIV, up to 10.87% for MI, 11.23% for cancer and 19.91% for CHF. The case fatality rates for ADG 23 and ADG 24 were, respectively, 1.77% and 1.59%, while that for ADG 25 was substantially higher at 8.85%.
Primary analysis: association of psychiatric morbidity and mortality in full cohort
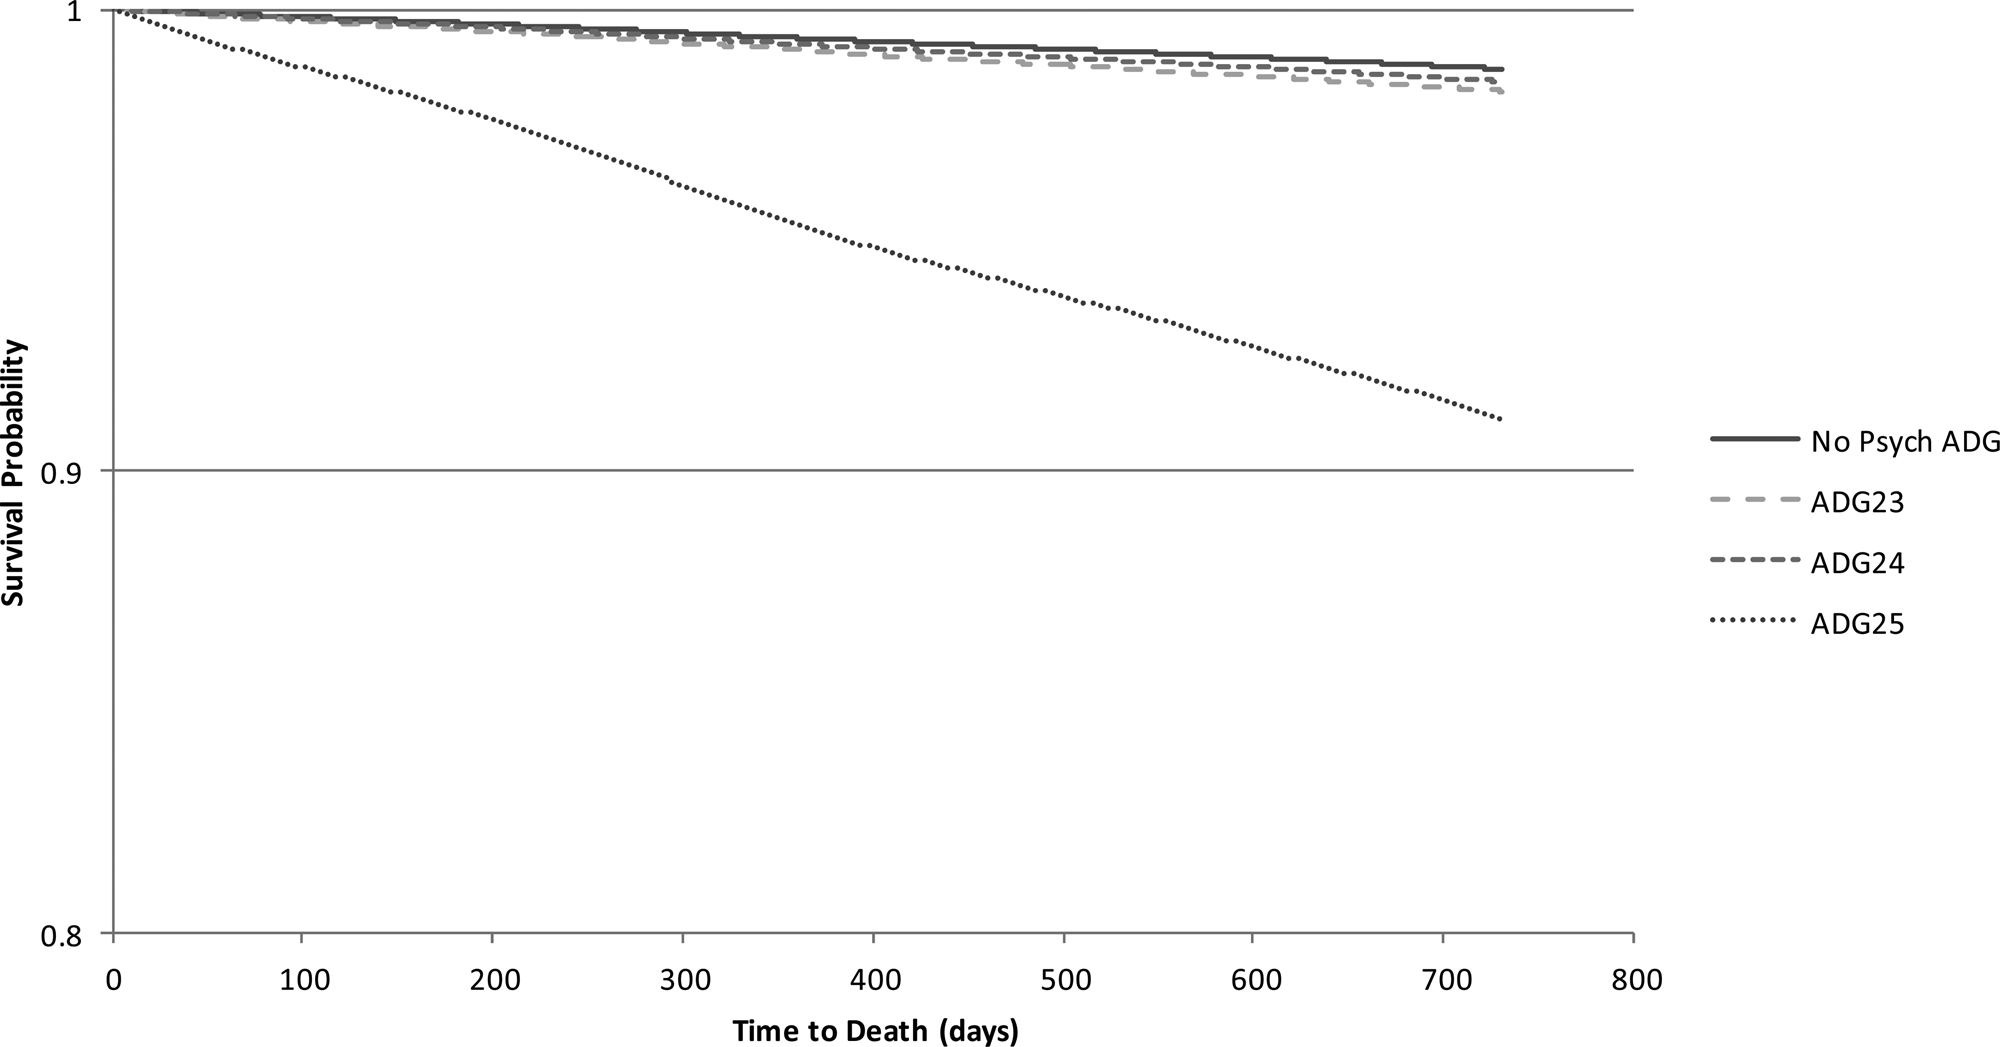
When we examined mortality outcomes from 2014 to 2016 in the entire cohort of Ontario residents from 2012 to 2014, in an unadjusted analysis, ADG 25 (Persistent/Recurrent unstable psychiatric morbidity) carried a far greater risk of subsequent mortality than did meeting the criteria for no psychiatric ADGs (hazard ratio = 7.13, 95% CI 7.05–7.21, p < 0.0001) (Table 3). ADG 24 (Persistent/Recurrent stable psychiatric morbidity) and ADG 23 (Time limited/minor psychiatric morbidity) were associated with much smaller increased risk of mortality. The hazard ratio for ADG 24 (1.21, 95% CI 1.19–1.22, p < 0.0001) was smaller than that for ADG 23 (1.37, 95% CI 1.32–1.42, p < 0.0001). On adjustment for covariates relating to demographic variables and medical comorbidities, the excess risk of mortality was diminished in each case but remained statistically significant. For ADG 25, the adjusted hazard ratio was 2.94 (95% CI 2.91–2.98, p < 0.0001). As was the case for the unadjusted analysis, the adjusted hazard ratio for ADG 24 [1.12 (95% CI 1.11–1.14, p < 0.0001)] was smaller than that for ADG 23 [1.31 (95% CI 1.26–1.36, p < 0.0001)] (Fig. 1).
Kaplan–Meier survival curves for the full population.

Hazard ratios in full Ontario population (n = 11 246 910)

a These models are adjusted for age, sex, neighbourhood income quintile, urban/rural residence and for the presence of each of the 10 medical disorders.
*All associations p < 0.0001.
Secondary analysis: association of psychiatric morbidity and mortality in disease-specific cohorts
When we examined mortality in each disease-specific cohort, similar patterns emerged to those in the full cohort. In every one of these cohorts, having ADG 25 (Persistent/Recurrent unstable psychiatric morbidity) carried a significantly greater risk of subsequent mortality compared to having no psychiatric comorbidity, both in unadjusted and adjusted analyses. Relative to having no psychiatric comorbidity, adjusted hazard ratios for ADG 25 ranged from 1.84 (95% CI 1.81–1.88, p < 0.0001) for CHF up to 2.90 (95% CI 2.57–3.23) for Crohn's Disease/ulcerative colitis, with all of the other subgroups being within this range (Table 4 and online Supplementary Fig. e2a–j).
Hazard ratios in disease-specific cohorts for mortality over the 2-year follow-up period (April 2014–March 2016)

CFR, Case Fatality Rate for medical disorders from April 2014 to March 2016; COPD, chronic obstructive pulmonary disease; CHF, congestive heart failure; HIV, human immunodeficiency virus disease.
ap < 0.05, bp < 0.01, cp < 0.001, dp = 0.0001, ep < 0.0001.
f These models are adjusted for age, sex, neighbourhood income quintile, urban/rural residence and for the presence or absence of each of the other nine medical disorders.
For ADG 23 and ADG 24 (representing Time-limited/minor and Persistent/Recurrent stable psychiatric morbidities, respectively), the pattern of mortality hazard ratios was less consistent across the 10 disease-specific cohorts. For ADG 23, seven of the 10 disease-specific cohorts yielded similar results to the analysis for the full population, in that both unadjusted and adjusted analyses illustrated significantly higher hazard ratios for mortality compared to having no psychiatric morbidity by ADGs, but in each case, the hazard ratios were markedly smaller than those for ADG 25. One further disease-specific cohort had significantly increased hazard ratios for ADG 23 in the adjusted analysis only. ADG 24 had the least consistent associations with mortality of all the diagnosis groups. Only two disease-specific cohorts exhibited significantly increased hazard ratio for mortality in both unadjusted and adjusted analyses, hazard ratios again being much smaller than for ADG 25. A further five disease-specific cohorts had significantly increased hazard ratios for ADG 24 in the adjusted analyses only.
The proportional hazards assumption was not violated in any of the above analyses.
Discussion
In a population-based sample comprising all adult residents in Ontario aged between 16 and 105 years, having a major persistent or recurrent psychiatric morbidity was associated with a nearly threefold increased risk of death in a 2-year follow-up period relative to individuals with no psychiatric illness. The elevated mortality rate associated with severe, recurrent and unstable psychiatric illness was observed in all 10 common medical comorbidities.
These results are consistent with previous studies in which diagnoses of severe and persistent psychiatric disorders have been associated with poorer outcomes in patients with medical disorders considered chronic or severe (Kurdyak et al., Reference Kurdyak, Vigod, Duchen, Jacob, Stukel and Kiran2017) and most notably with premature mortality (Colton and Manderscheid, Reference Colton and Manderscheid2006; Joukamaa et al., Reference Joukamaa, Heliovaara, Knekt, Aromaa, Raitasalo and Lehtinen2006; Fors et al., Reference Fors, Isacson, Bingefors and Widerlov2007; Laursen et al., Reference Laursen, Munk-Olsen, Nordentoft and Mortensen2007; Katon et al., Reference Katon, Fan, Unützer, Taylor, Pincus and Schoenbaum2008; Wahlbeck et al., Reference Wahlbeck, Westman, Nordentoft, Gissler and Laursen2011). Some of these studies considered the impact of one specific psychiatric disorder on mortality associated with one or more physical illnesses, suggesting a specific pattern that psychiatric diagnoses of several types, provided they are of sufficient severity, increase the risk of mortality. Our study results suggest this effect is not unique to specific psychiatric disorders such as schizophrenia or major depression and is generalizable to all psychiatric disorders lying above a certain threshold of chronicity, instability and expected healthcare use, including dementia and other chronic organic brain disorders, bipolar affective disorder, schizoaffective disorder, borderline personality disorder, chronic alcohol dependence and other chemical dependencies. Previous studies which have elucidated this more generalized increased risk of mortality are uncommon.
Colton and Manderscheid (Reference Colton and Manderscheid2006) reported that in eight US states, clients in mental health programmes died at much younger ages than the general population, and those with major mental illnesses were more likely to die prematurely than those with non-major mental illness diagnoses. In general, these early deaths were attributable to natural medical causes, including heart disease, cerebrovascular disease, cancer and respiratory disease. Thornicroft (Reference Thornicroft2011) has written on the ‘scandal’ of premature mortality associated with psychiatric illness, exemplified by data from Nordic countries, which illustrates markedly reduced life expectancy across people who had been admitted to hospital for a mental disorder. These individuals had a two-to-threefold higher mortality over a 15-year period than the general population in all three countries studied (Wahlbeck et al., Reference Wahlbeck, Westman, Nordentoft, Gissler and Laursen2011). The difference amounted to a 20-year reduction in life expectancy for males and 15-year reduction for females having a psychiatric disorder of sufficient severity to have warranted hospital admission. Another study which used register-based data in individuals recorded as having had hospital admissions for psychiatric diagnoses provides evidence to suggest that excess mortality rates may be observed consistently across a broad range of psychiatric disorders (Laursen et al., Reference Laursen, Munk-Olsen, Nordentoft and Mortensen2007). This study reported excess mortality rates in individuals who had experienced hospital admissions with diagnoses of unipolar depressive disorder, bipolar affective disorder, schizoaffective disorder and schizophrenia as compared to people who had never had a psychiatric admission.
The consistency of the association of Persistent/Recurrent (unstable) psychiatric morbidity (ADG 25), with mortality across the 10 disease-specific subgroups of common medical disorders is a unique contribution of our study. That the presence of Persistent/Recurrent (unstable) psychiatric morbidity with high expected duration and intensity of healthcare use is associated with a significant excess risk of mortality, relative to individuals with no psychiatric diagnosis, in every disease-specific cohort (and in every case with a hazard ratio of 1.8 or more) suggests that psychiatric morbidity of this severity is a ubiquitous mortality risk factor. We speculate that several factors may contribute to the relationship between persistent or recurrent and unstable psychiatric morbidity with high expected duration and intensity of healthcare use and risk of mortality. These include (1) severe and unstable psychiatric disorders carrying elevated risk of mortality irrespective of medical disorders (e.g. increased suicide rates), (2) psychiatric disorders being associated with increased severity of medical disorders due to shared biological aetiology, (3) psychiatric disorders impairing individuals' ability to manage risk factors such as poor diet, lack of exercise and smoking which worsen the prognosis of medical disorders, (4) psychiatric disorders being associated with worse outcomes in medical disorders due to the cardiovascular, metabolic and other systemic consequences of psychotropic drug use (e.g. metabolic syndrome with antipsychotic drugs or electrolyte disturbance with antidepressants) or arising from drug interactions between medications used to treat psychiatric and medical disorders, (5) psychiatric disorders impairing individuals' ability or willingness to access or engage successfully with medical services of all types, (6) psychiatric disorders impairing individuals' ability or willingness to adhere to often complicated medication regimens, and (7) services for medical disorders being poorly designed to work successfully with people having severe or unstable psychiatric morbidity.
The other diagnostic groups for psychiatric morbidity, ADG 23 (Time-limited minor conditions) and ADG 24 (Persistent/Recurrent stable conditions), were also associated with increased risk of mortality across the whole population but hazard ratios were markedly smaller. The greater hazard ratios for ADG 25 relative to ADG 23 and ADG 24 were expected since this category (Persistent/Recurrent unstable disorders) was designed to include the most severe and pervasive psychiatric disorders such as acute schizophrenia, bipolar disorder, dementia and recurrent depressive disorder. ADG 23 (Time-limited, minor) and ADG 24 (Persistent/Recurrent stable disorders) would be expected to have a lesser impact (behaviourally and in terms of biological vulnerability) on factors contributing to mortality risk than is the case with the disorders in ADG 25. The hazard ratios for ADG 24 were smaller than those for ADG 23 although still significantly above unity. In the cohorts restricted to sub-populations with specific medical diagnoses at baseline, associations with mortality over the follow-up period were much less consistent, especially in the case of ADG 24. As ADG 24 comprises psychiatric disorders which are persistent but stable with moderate expected duration and intensity of healthcare use, it is conceivable that individuals with these diagnoses learn over time to engage more successfully with health services (improving rates of detection and treatment, and thereby prognosis of any medical comorbidities) than those psychiatric disorders in ADG 23 which are time limited and generally imply only short-lived duration and intensity of healthcare use.
Strengths of the study are many. It has a large sample size and is based on the entire population of Ontario. Unlike some of the previous studies, which have examined the impact of a range of psychiatric disorders on mortality, the present study had no requirement for individuals to have had hospital admissions in order to be included. Both the psychiatric morbidity (classified by ADGs) and the medical comorbidities were identified from provincial data registers using well-established algorithms, which have been employed in numerous earlier studies (Austin et al., Reference Austin, Daly and Tu2002; Hux et al., Reference Hux, Ivis, Flintoft and Bica2002; Hall et al., Reference Hall, Schulze, Groome, Mackillop and Holowaty2006; Tu et al., Reference Tu, Campbell, Chen, Cauch-Dudek and McAlister2007; Gershon et al., Reference Gershon, Wang, Guan, Vasilevska-Ristovska, Cicutto and To2009a, Reference Gershon, Wang, Guan, Vasilevska-Ristovska, Cicutto and To2009b; Antoniou et al., Reference Antoniou, Zagorski, Loutfy, Strike and Glazier2011; Austin et al., Reference Austin, Newman and Kurdyak2012a, Reference Austin, Shah, Newman and Anderson2012b; Schultz et al., Reference Schultz, Rothwell, Chen and Tu2013; Widdifield et al., Reference Widdifield, Bombardier, Bernatsky, Paterson, Green, Young, Ivers, Butt, Jaakkimainen, Thorne and Tu2014; Benchimol et al., Reference Benchimol, Guttmann, Mack, Nguyen, Marshall, Gregor, Wong, Forster and Manuel2014). The outcome of mortality was identified reliably from well-validated provincial registers.
The study limitations are as follows: (i) Individuals having some of the medical diagnoses, such as hypertension, may have the disorder controlled with successful treatment through medications or other means. Our study design could not distinguish ongoing medical comorbidities which had been brought under control from those where disorders remained uncontrolled, (ii) although we controlled for several covariates the possibility of residual confounding remains, (iii) while there was a clear association between ADG 25 and excess mortality, there may be considerable variation in impact on mortality between the heterogeneous group of psychiatric disorders making up this category, (iv) individuals who died during the accrual period (1 April 2012–31 March 2014) could not be included in the analysis since a 2-year period is required to allocate individuals to ADG 23, 24 and 25. Thus the population of over 11.2 million studied here cannot include the 181 785 people who were alive at the beginning of this time but died before the accrual period ended. These individuals were significantly older than the population studied (mean age 75.8 v. 47.9 years in the population included, p < 0.001), significantly more likely to be in lower neighbourhood income quintile groups (p < 0.001), significantly less likely to live in urban rather than rural settings (85.3% v. 88.5%, p < 0.001) and were significantly more likely to have nine of the 10 chronic disorders at baseline (p < 0.001 for all, the one exception being Crohn's disease/colitis which was not significantly more common). However, they represent <1.6% of the Ontario population in the age range of this study and are thereby unlikely to have exerted a major influence on the associations reported had it been possible to ascertain the presence or absence of psychiatric morbidity before they died.
We believe that this study represents an important addition to the existing literature on excess mortality in people with mental disorders for three main reasons. It has a population-based sample of over 11.2 million individuals, which includes all adult Ontario residents aged between 16 and 105 at the starting point in 2012 who remained alive and resident in the province 2 years later. The effects described are large, and are consistent not only in the general population but also in cohorts restricted to people with specific medical disorders at baseline. There is generalizability in that the results apply across all psychiatric disorders judged to be Persistent/Recurrent unstable conditions rather than being confined to one specific psychiatric disorder.
Conclusion
The excess mortality that we have reported to be associated with psychiatric disorders, particularly those graded as persistent/recurrent and unstable with high expected duration and intensity of healthcare use, across the whole population, and especially across the spectrum of chronic or severe medical illnesses examined, needs to be considered in future health service design (Druss, Reference Druss2007; Boyd and Fortin, Reference Boyd and Fortin2010; Goodrich et al., Reference Goodrich, Kilbourne, Nord and Bauer2013; Chwastiak et al., Reference Chwastiak, Vanderlip and Katon2014; Gulland, Reference Gulland2016). Our results suggest that health-service design approaches need to take account of the complexity of comorbidity even when a service has the treatment of an individual medical disorder as its primary goal. This applies especially for where persistent/recurrent and unstable psychiatric disorders, such as acute schizophrenia, bipolar disorder and recurrent depressive disorder, are comorbid with chronic or severe medical disorders. Service designs which ensure the needs of people with comorbidities are met (Boyd and Fortin, Reference Boyd and Fortin2010; Mercer et al., Reference Mercer, Gunn, Bower, Wyke and Guthrie2012; Goodrich et al., Reference Goodrich, Kilbourne, Nord and Bauer2013), both in terms of treating the psychiatric disorders and removing barriers to provision of good quality medical treatment, may offer an opportunity to reduce mortality and improve outcomes across a broad range of medical disorders.
Supplementary material
The supplementary material for this article can be found at https://doi.org/10.1017/S003329171900326X.
Acknowledgements
Parts of this material are based on data and/or information compiled and provided by the Canadian Institute for Health Information (CIHI). However, the analyses, conclusions, opinions and statements expressed in the material are those of the author(s), and not necessarily those of CIHI. Parts of this material are based on data and information provided by Cancer Care Ontario (CCO). The opinions, results, view and conclusions reported in this paper are those of the authors and do not necessarily reflect those of CCO. No endorsement by CCO is intended or should be inferred. Parts of this report are based on Ontario Registrar General information on deaths, the original source of which is Service Ontario. The views expressed therein do not necessarily reflect those of ORG or the Ministry of Government Services.
Financial support
This study was supported in part by the Medical Psychiatry Alliance, a collaborative health partnership of the University of Toronto, the Centre for Addiction and Mental Health, the Hospital for Sick Children, Trillium Health Partners, the Ontario Ministry of Health and Long-Term Care (MOHLTC) and an anonymous donor. The Institute for Clinical Evaluative Sciences (ICES) is funded by an annual grant from the Ontario MOHLTC. The opinions, results and conclusions reported in this paper are those of the authors and are independent of the funding sources and sponsoring agencies. No endorsement by ICES or the Ontario MOHLTC is intended or should be inferred.
Conflict of interest
The authors have no conflict of interest with any corporate organizations relating to this presentation.