Introduction
The adsorption and desorption of soil nutrients and contaminants on solid phases have critical influences on their availability and fate in the environment, which, in turn, impacts environmental health and safety. Alkali cations are highly soluble and mobile, having significant effects on the environment. Li+ cations are used widely in the growing Li-battery industry, and are released into the environment through large-scale mining and waste Li-battery disposal. Exposure to high levels of Li+ may cause severe reproductive and functional health concerns to humans (Wanger Reference Wanger2011). Excessive Na+ is applied to soils and waters from the use of deicers and wastewater irrigation, which may cause sodic soil problems (Halliwell et al. Reference Halliwell, Barlow and Nash2001). The K+ cation is an important macronutrient for plants, and its availability is essential for plant health (Manning Reference Manning2010). Radioactive Cs+ can be released into the environment from nuclear accidents and cause various health issues (Yamashita and Suzuki Reference Yamashita and Suzuki2013). Alkali cations do not normally form inorganic or organic complexes, and ion-exchange reactions are the dominant mechanisms influencing their adsorption on solid surfaces. Montmorillonite plays a significant role in controlling the availability and fate of ions in soils and water due to its high cation adsorption capacity and great abundance in nature (Odom Reference Odom1984; Srinivasan Reference Srinivasan2011).
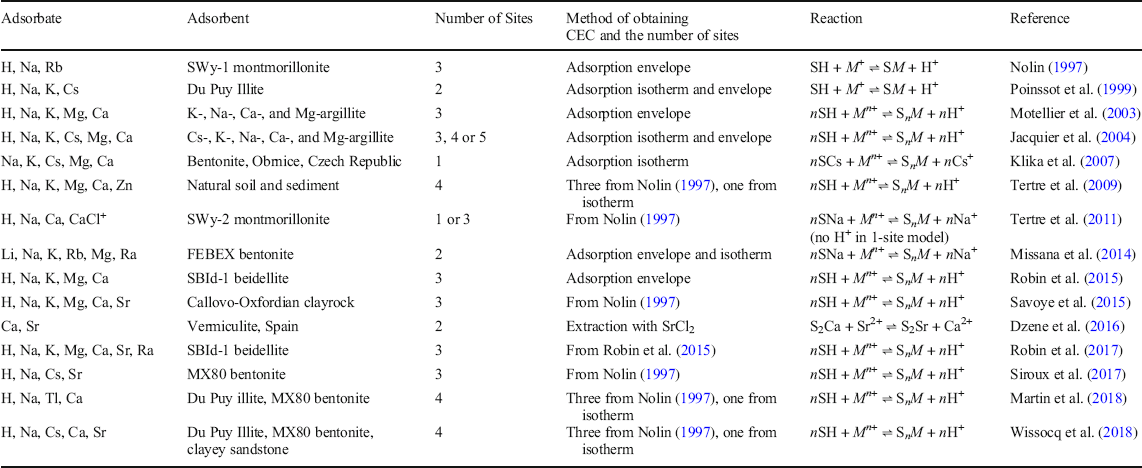
Mathematical models have been developed to predict quantitatively ion adsorption; ion-exchange models are used widely (Schulthess and Sparks Reference Schulthess and Sparks1991; Bourg et al. Reference Bourg, Bourg and Sposito2003). Ion-exchange reactions were first identified by Way (Reference Way1850), and have been used to describe cation adsorption on various types of 2:1 clay minerals over a wide range of chemical environments (Table 1). The ion-exchange models are based on thermodynamic ion-exchange reactions. These models consider the solid surface as an exchanger, and all cations compete for the solid surfaces; that is, the models involve the adsorption of all cations present in the system. In ion-exchange models, two parameters are generally involved: the cation exchange capacity (CEC) of each site, and the cation adsorption equilibrium constant (K) of each cation on each site. These unknown parameters were always obtained from the best fit of experimental adsorption data (Table 1). The value of K, number of adsorption sites, and CEC were obtained from curve fitting the adsorption edges and plateaus of adsorption envelopes, or number of linear regression curves and adsorption maxima from adsorption isotherms.
Recently published ion-exchange models on 2:1 clay minerals

Note that the location of the adsorption sites cannot be deduced definitively from curve-fitting exercises. The designation of the adsorption sites on clays is attributed generally to the surface metals present (e.g. aluminol or silanol sites) (Schulthess and Huang Reference Schulthess and Huang1990) and/or structural location (e.g. edge or interlayer sites) (Baeyens and Bradbury Reference Baeyens and Bradbury1997; Martin et al. Reference Martin, Wissocq, Benedetti and Latrille2018). Conversely, the location of interlayer adsorption sites on clay surfaces can be identified using computer simulations. Interlayer cations were found by Chatterjee et al. (Reference Chatterjee, Iwasaki, Ebina and Miyamoto1999) and Shi et al. (Reference Shi, Liu, Lou, Zhang, Meng, Zeng and Yang2013) to adsorb in the vicinity of substituted octahedral Mg, where the negative charge imbalance occurs on montmorillonite. Another limitation of adsorption models occurs when many unknown parameters are involved (Addiscott et al. Reference Addiscott, Smith and Bradbury1995), which makes the clear identification of the total number of sites difficult, as well as the CEC of each site. This is particularly true with adsorption envelopes when two or more adsorption edges are very close to each other. For example, Motellier et al. (Reference Motellier, Ly, Gorgeon, Charles, Hainos, Meier and Page2003) identified three types of adsorption sites on argillite when the adsorbed cations were K+ and Ca2+, but only two types of adsorption sites when the adsorbed cation was Na+. Similarly, Jacquier et al. (Reference Jacquier, Ly and Beaucaire2004) proposed three types of adsorption sites when the adsorbed cations were Na+, K+, and Cs+, but four types of adsorption sites when the adsorbed cation was Ca2+, and a fifth site for Na-Cs exchange reactions.
The use of adsorption data remains the primary method for identifying the number and CEC of adsorption sites. Independent identification of these parameters would decrease greatly the number of unknown variables and the uncertainty of the model predictions. To this end, the number and adsorption strength of adsorption sites on montmorillonite were investigated recently in a first-principles Density Functional Theory (DFT) study (Li et al. Reference Li, Schulthess, Co, Sahoo and Alpay2020). Three types of adsorption sites with distinctive H+ adsorption energies were found in montmorillonite. These three types of sites corresponded to three different octahedral Fe-Mg distances, and all three sites were interlayer sites. The DFT study demonstrated the existence of multiple types of interlayer adsorption sites on montmorillonite from the perspective of the chemical composition and structure of clay minerals. The H+ cation was selected for the DFT simulations because the H+ cation is present in all aqueous solutions, is an inevitable competitor in ion-exchange reactions, and is normally treated as a reference cation in ion-exchange models. The relative retention strength of the H+ cation on the interlayer octahedral-Mg sites was used only to differentiate the selectivity of each of the three Mg sites for cations. The retention mechanism of other cations on these sites will vary based on their degree of hydration, but the physical location should remain on or near the Mg sites as noted by the studies of Chatterjee et al. (Reference Chatterjee, Iwasaki, Ebina and Miyamoto1999) and Shi et al. (Reference Shi, Liu, Lou, Zhang, Meng, Zeng and Yang2013). More importantly for adsorption modeling, the percentage of different adsorption sites on montmorillonite can be calculated easily based on the statistical probability of formation of the different Fe–Mg distances in the octahedral sheets. Once the number and relative CEC of adsorption sites are independently known, the only remaining parameters that need to be optimized are the overall adsorption maximum and the adsorption equilibrium constants in the ion-exchange models.
The present study sought to quantify the adsorption equilibrium constants of alkali cations using an ion-exchange model with the pre-determined number of sites and relative CEC of each site from the previous DFT study on montmorillonite (Li et al. Reference Li, Schulthess, Co, Sahoo and Alpay2020). The purpose was to determine if the information based on the chemical composition of a mineral (namely, number of adsorption sites and the relative percentage of each adsorption site) can be applied successfully to ion-exchange modeling of monovalent cations. The present study also sought to characterize the relation between cation adsorption strength and montmorillonite interlayer space and to explore if the physical dimension of the interlayer space is related to the cation adsorption strength.
Materials and Methods
Li-, Na-, K-, Cs-, and H-Saturated Montmorillonite
Wyoming SWy-3 was obtained from the Source Clays Repository of The Clay Minerals Society. The SWy-3 montmorillonite was mined from the same source and had similar chemical composition and structure to those of the SWy-1 and SWy-2 smectites (Sadri et al. Reference Sadri, Johnson, Ruyter-Hooley and Angove2018).
All glassware and centrifuge tubes were acid-washed prior to use. The Na-saturated montmorillonite (NaMnt) was made as follows: 96 g of SWy-3 montmorillonite was mixed with 1440 mL of 0.01 mol/L HCl for 12 h to dissolve the potential carbonate impurities, centrifuged at 29,900 ×g for 5 min, the supernatant decanted, new solutions added, and the clay sediment resuspended. This procedure was repeated eight times using 1 mol/L NaCl solutions instead of HCl, followed by washing with deionized water eight more times to remove the excess NaCl salt. The clay suspension was then diluted to 4 L with a final NaMnt stock clay concentration of 21.3 g/L and pH 6.7. Similar procedures starting with NaMnt were used to make Li- (LiMnt), K- (KMnt), and Cs-saturated (CsMnt) montmorillonites. The H+-saturated Mnt (HMnt) was prepared by washing the NaMnt three times in 0.5 mol/L HCl solution. The final pH of the HMnt sample was <1. A SWy-3 clay suspension was prepared with the same clay concentration by mixing 2.13 g of SWy-3 clay with 100 mL of deionized water.
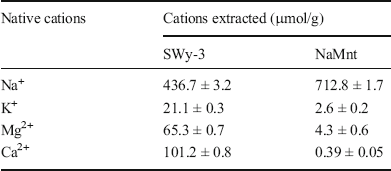
The total native exchangeable cations (i.e. K+, Na+, Ca2+, and Mg2+) in the SWy-3 and NaMnt were analyzed as follows: a 9-mL aliquot of SWy-3 or NaMnt stock suspension was mixed with 16 mL of 50 mmol/L NH4Cl and 5 mL of 10 mmol/L HCl, agitated for 6 h, centrifuged at 29,900 ×g for 20 min, and a 21-mL supernatant aliquot was taken for cation analysis. The clay samples were resuspended, and this NH4Cl-HCl procedure was repeated for a total of six extractions. Both NH4Cl and HCl solutions were used in order to extract the exchangeable cations in the clay minerals to the greatest extent possible. The pH of all the extracted solutions ranged from 2.9 to 2.3. This procedure was replicated three times. The cation concentrations of each of the extracted solutions were analyzed separately using inductively coupled plasma-atomic emission spectroscopy (ICP-AES, Spectro Ciros, Kleve, Germany), and summed together to calculate the total initial cations present.
Cation Adsorption Envelopes and Cs+ Adsorption Isotherms
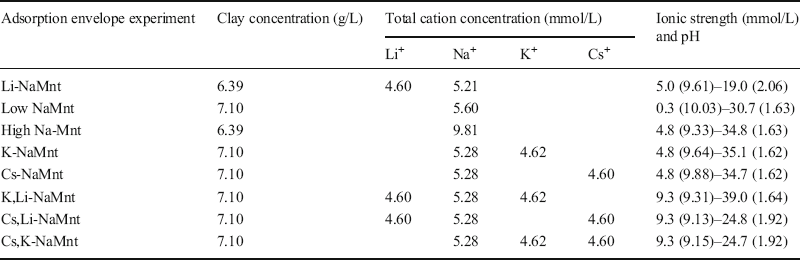
Stock solutions of CsCl, KCl, LiCl, NaCl (60 mmol/L each), and NaOH (56 mmol/L) were prepared using laboratory-grade reagents. The adsorption envelopes were prepared using batch samples as follows: into 50-mL nominal Oak Ridge centrifuge tubes (Thermo Fisher Scientific, Boston, Massachusetts, USA), a specific volume of clay suspension was first mixed with deionized water, followed by the addition of variable amounts of 10 or 1000 mmol/L HCl for pH adjustment, 0.2 mL of 56 mmol/L NaOH was added for fixed competitive Na+ concentrations, and corresponding salt solutions (e.g. LiCl, NaCl, KCl, CsCl solutions) were added. The total volume in each centrifuge tube was 30 mL. The batch suspensions were mixed for 19–20 h at 25–28°C, centrifuged at 29,900 ×g for 30 min, and the supernatant solution was analyzed for the remaining aqueous cation concentrations and pH. The wet clay sediments at the bottom of the centrifuge tubes were analyzed using XRD (discussed below). The reaction conditions for different cation adsorption experiments are listed in Table 2. The total cation concentrations in Table 2 included the exchangeable autochthonous cations in the NaMnt mineral. The amounts of cations adsorbed were obtained by subtracting the remaining aqueous cation concentration from the total initial cation concentration.
Initial clay concentration and total cation concentration for various adsorption envelope experiments on Na-saturated montmorillonite (NaMnt). The final ionic strength was pH-dependent, and the pH values are shown in parentheses

The Cs+ adsorption isotherm was prepared by the same procedure as the cation adsorption envelopes, except that various amounts of 60 mmol/L CsCl and 10 mmol/L HCl were added to achieve a range of Cs+ concentrations and specific pH values of 3.5, 5.5, and 8.3. Two to five replications were conducted for each Cs+ concentration, because equilibrium pH changed slightly within these replications. The amount of cations adsorbed at each target pH was extrapolated from each set of points collected. The initial Na+ concentration was 814.82 μmol/g, and the clay concentration was 6.39 g/L. The total ionic strength in the Cs+ adsorption isotherms varied as a function of the amount of HCl and CsCl added. The ionic strength varied from 2.5 to 21.2 mmol/L for pH 3.5, 1.1 to 20.5 mmol/L for pH 5.5, and 0.6 to 59.5 mmol/L for pH 8.3.
The ion-exchange model parameters were optimized using IExFit software (version 3.2, http://www.alfisol.com), which uses nonlinear least squares to minimize the square of the errors. Ionic activity coefficients of aqueous ions were calculated using the Davies equation (Davies Reference Davies1938). The goodness-of-fit pseudo-R 2 values of the optimization results were Efron’s pseudo-R 2 values (Efron Reference Efron1978). The Langmuir isotherms were optimized with the vertical, nonlinear, least-squares regression (Schulthess and Dey Reference Schulthess and Dey1996) using LMMpro software (version 1.06, http://www.alfisol.com).
X-ray Diffraction
The d 001 values of dry montmorillonite were analyzed using an X-ray diffraction instrument (XRD, D2 Phaser, Bruker Corp., Madison, Wisconsin, USA), which was equipped with a powder diffractometer using CuKα radiation, graphite monochromator, and a LynxEye linear detector. The oriented SWy-3 and NaMnt montmorillonite samples were prepared by pipetting the clay stock suspensions onto glass slides and oven-drying at 55°C for 12 h. Data were collected within minutes of each other at room temperature from 4 to 32°2θ with a 0.02°2θ step size and a count time of 2 s per step. The identification of minerals was based on comparisons with published XRD patterns (Moore and Reynolds Reference Moore and Reynolds1989; Chipera and Bish Reference Chipera and Bish2001).
The d 001 values of wet clay samples occupied with various cations were analyzed at room temperature using XRD. The wet clay samples from the cation adsorption envelopes, Cs+ isotherms, and Li-, Na-, K-, Cs-, H-saturated samples were put in a Si low-background sample holder (Bruker Corp., Madison, Wisconsin, USA) using a spatula and leveled with a glass slide. Data were collected from 4 to 12°2θ with a 0.02°2θ step size and a count time of 0.5 s per step. The samples were analyzed at room temperature. The weight of wet clay pastes was recorded before and after XRD analysis, and the moisture loss was negligible (<0.4%).
RESULTS AND DISCUSSION
Mineral Stability and Cation Exchange Capacity
To simplify the ion-exchange reactions involved, the montmorillonite was Na-saturated to produce a well-controlled Na-montmorillonite (NaMnt) adsorbent. The pH of the supernatant solution was between 1.2 and 2.2 when the SWy-3 montmorillonite was washed with 0.01 mol/L HCl solution. The low pH could, potentially, dissolve the clay mineral and change its physiochemical properties (Amram and Ganor Reference Amram and Ganor2005; Rozalén et al. Reference Rozalén, Huertas, Brady, Cama, García-Palma and Linares2008). Accordingly, the oriented SWy-3 and NaMnt samples were analyzed with XRD to examine the clay mineral structure. The XRD results showed no significant change in the XRD peak positions (Fig. 1), suggesting that the mineral composition of NaMnt remained similar to that of SWy-3.
Oriented XRD patterns of dry, untreated (SWy-3) and Na-saturated (NaMnt) montmorillonite samples

The total removal of some cations from clay minerals was suggested to be very difficult (Baeyens and Bradbury Reference Baeyens and Bradbury1997), and small cations (e.g. Mg2+) were presumably held very strongly in the octahedral vacancies in montmorillonite (Chorom and Rengasamy Reference Chorom and Rengasamy1996). The cations that are difficult to remove would not influence ion-exchange reactions. Table 3 lists exchangeable cations in SWy-3 and NaMnt samples. The total exchangeable cation concentrations included adsorbed cations plus various salts in the samples. These cations would participate in ion-exchange reactions and result in a complicated matrix. However, the NaMnt had very low concentrations of K+, Ca2+, and Mg2+ cations. The exchangeable K+, Ca2+, and Mg2+ cations in the NaMnt sample were not considered in this study due to their low content. Accordingly, Na+ was the only dominant exchangeable cation in NaMnt. The formula was (Na0.58)[Al3.01Fe(III)0.41Mn0.01Mg0.54Ti0.02][Si7.98Al0.02]O20(OH)4 adapted from The Clay Minerals Society (2020) to ensure charge neutrality in the clay unit, with a molecular weight (MW) of 744.75 g/mol.
Total exchangeable cations in untreated (SWy-3) and Na-saturated montmorillonite (NaMnt). Average ± standard deviations were based on N = 3

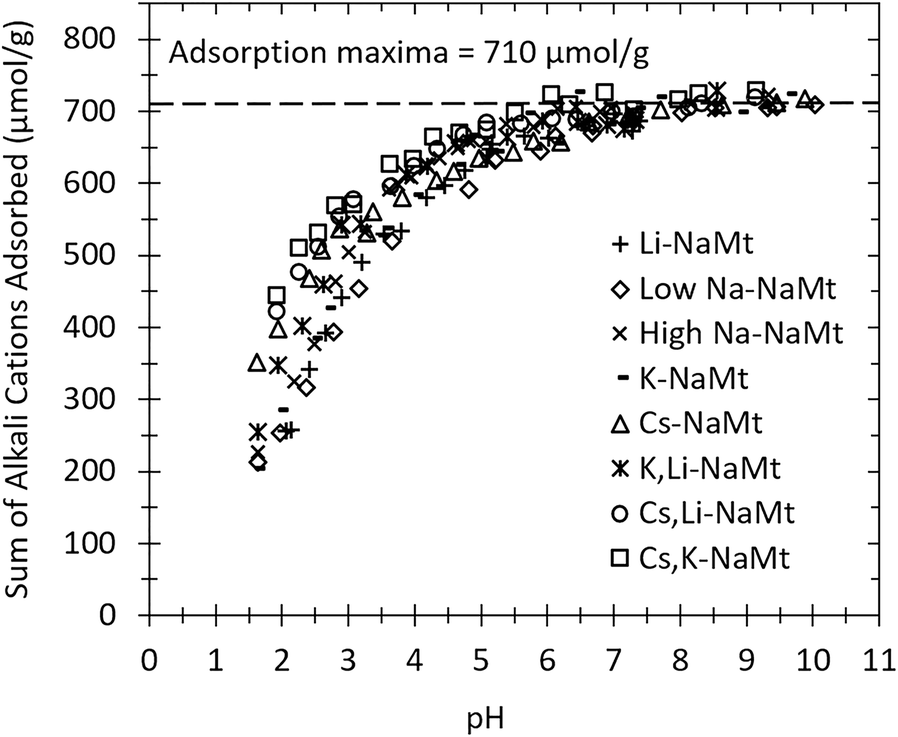
Based on the chemical formula of the NaMnt noted above, the theoretically calculated CEC from isomorphic substitution was 778.78 μmol/g (= 0.58/MW×106), which was very close to the reported CEC (764 μmol/g) of SWy-3 from The Clay Minerals Society (2020). The experimentally measured maximum amount of alkali cations adsorbed above pH 7 from different adsorption envelopes came to a similar value of 710 μmol/g (Fig. 2). This value was also very close to the total Na+ concentration extracted from the NaMnt (712.8 μmol/g, Table 3). The decrease in the measured values relative to the published or calculated values probably resulted from two contributing factors. One was the loss of small-size clay particles that were decanted with the supernatant solutions during the Na-saturation procedure, which tend to have a larger CEC (Stul and Van Leemput Reference Stul and Van Leemput1982). Another was the presence of feldspar, illite, and quartz impurities (Fig. 1). The CEC of feldspar (2.8–20 μmol/g, Nash and Marshall Reference Nash and Marshall1956), illite (75–240 μmol/g, Baeyens and Bradbury Reference Baeyens and Bradbury2004), and quartz (0 μmol/g) are much lower than montmorillonite (764 μmol/g, The Clay Minerals Society 2020). The primary mineral contributing to the CEC of NaMnt was montmorillonite because of the low concentrations and CEC of the other minerals present (e.g. illite, quartz, and feldspar). Accordingly, the model development discussed in the next section will treat the NaMnt as pure montmorillonite.
In the cation adsorption envelopes, the amount of adsorbed cations was constant at high pH (>7) but decreased at low pH (<7) (Fig. 2). The decrease in cation adsorption at very low pH (<3) could have been caused either by the dissolution of clay minerals or by the competition of H+ for adsorption sites (Baeyens and Bradbury Reference Baeyens and Bradbury1997; Poinssot et al. Reference Poinssot, Baeyens and Bradbury1999). The aqueous Al3+ and Fe3+ concentrations were analyzed at low pH to elucidate the major reason for the decrease in cation adsorption (Fig. 3). The aqueous Al3+ and Fe3+ concentrations increased rapidly as the pH decreased. The total Al and Fe contents in NaMnt were 4068.45 and 550.52 μmol/g, respectively, based on the chemical formula of NaMnt. Accordingly, the aqueous Al3+ and Fe3+ concentrations estimated the highest dissolution rates of NaMnt to be 0.1% and 1.2%, respectively. In closed containers, a very small amount of dissolution of Al3+ and Fe3+ cations will suffice to saturate the supernatant liquid. Conversely, the cation adsorption decreased by >42% of the total CEC at pH < 3 (~300 μmol/g, Fig. 2), which means that the large decrease in cation adsorption at low pH was mainly due to H+ competition rather than mineral dissolution.
Sum of alkali cations adsorbed on NaMnt for various conditions

Aqueous a Al3+ and b Fe3+ concentrations and clay dissolution at low pH for various conditions

With increasing Al3+ solubility at low pH, competitive adsorption of Al3+ cations is possible. The impact of mineral dissolution on the adsorption of other cations is a complex topic to resolve in adsorption modeling exercises. For example, Coulter and Talibudeen (Reference Coulter and Talibudeen1968), Coulter (Reference Coulter1969), and Bloom et al. (Reference Bloom, McBride and Chadbourne1977) observed an increase in CEC with adsorption of Al3+ on montmorillonite. In those studies, the Al3+ came from allochthonous sources; i.e. the Al3+ cations were added. In the present study, the Al3+ was from an autochthonous source, coming from the mineral sample itself. As the Al3+ ions in the clay mineral dissolved, a concurrent shift may have occurred in the clay’s net charge balance which, in turn, would impact the clay’s net adsorption behavior. As the Al3+ re-adsorbs on the same clay from whence it came, another re-shifting of the clay’s net charge balance may occur. The net effect of this Al desorption and re-adsorption could be a local reconfiguration of the clay mineral structure. The influence of Al3+ cations on cation adsorption was not addressed in this study because of its low aqueous concentration (at most 0.03 mmol/L at low pH), the low estimates on total solubility (<1.2%), and the similarity in the XRD patterns of Mnt samples at low and high pH values (discussed below).
Model Development
The CEC of clay minerals comes from isomorphic substitution and the protonation/deprotonation of broken edges. However, the model development presented here will focus only on interlayer sites for two reasons: (1) the adsorption capacity of interlayer sites is much larger than the edge sites; and (2) the constrained environments of interlayer sites have a greater retention strength than the edge sites.
First, the charge from isomorphic substitution accounts for the majority of the CEC on montmorillonite (Sposito et al. Reference Sposito, Skipper, Sutton, Park, Soper and Greathouse1999). Published values of the percentage of edge sites on montmorillonite varied from <1% to 15% of the total CEC (McKinley et al. Reference McKinley, Zachara, Smith and Turner1995; Schulthess and Huang Reference Schulthess and Huang1990; Baeyens and Bradbury Reference Baeyens and Bradbury1997; Tournassat et al. Reference Tournassat, Neaman, Villiéras, Bosbach and Charlet2003; Missana et al. Reference Missana, Benedicto, García-Gutiérrez and Alonso2014). The contributions of isomorphic substitution and interlayer adsorption sites were based traditionally on pH-independent adsorption data, while the edge sites are based on pH-dependent adsorption data or potentiometric titration curves (Bradbury and Baeyens Reference Bradbury and Baeyens1997; Fernandes and Baeyens Reference Fernandes and Baeyens2019). However, if cations (e.g. Na+, K+) are able to adsorb and exchange on interlayer sites, the H+ (or hydronium H3O+) cations should be able to do the same. Accordingly, pH-dependent reactions on interlayer sites should be included in ion-adsorption models (Barbier et al. Reference Barbier, Duc and Petit-Ramel2000; Bradbury and Baeyens Reference Bradbury and Baeyens2005; Missana and García-Gutiérrez Reference Missana and García-Gutiérrez2007). That is, some of the pH-dependent CEC data used to estimate the concentrations of edge sites are potentially interlayer sites instead.
Second, the cation adsorption strength in constrained environments (i.e. interlayer sites) can be much greater than that in non-constrained environments (i.e. edge and planar sites). The Cs+ cation was found by Dzene et al. (Reference Dzene, Tertre, Hubert and Ferrage2015) to be adsorbed more strongly in the interlayer sites of vermiculite than in the external (edge and basal) sites based on cation adsorption and desorption experiments. The Nanopore Inner-Sphere Enhancement effect (NISE effect; Ferreira and Schulthess Reference Ferreira and Schulthess2011; Schulthess et al. Reference Schulthess, Taylor and Ferreira2011) stated that a cation can be partially or fully dehydrated and adsorb strongly inside nanopore channels when the size of the pore is smaller than the hydrated ionic diameter. The interlayer space of montmorillonite ranges from 0 to 1 nm based on the water content and interlayer cations present (Ferrage et al. Reference Ferrage, Lanson, Sakharov and Drits2005; Iijima et al. Reference Iijima, Tomura and Shoji2010; Ohkubo et al. Reference Ohkubo, Okamoto, Kawamura, Guégan, Deguchi, Ohki, Shimizu, Tachi and Iwadate2018), which is in the same size range as most dehydrated and hydrated cations. Accordingly, the retention of cations tends to be stronger on interlayer sites than on edge sites.
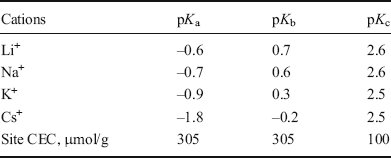
As noted in the Introduction, three types of interlayer adsorption sites on montmorillonite from a previous DFT simulation (Li et al. Reference Li, Schulthess, Co, Sahoo and Alpay2020) were used for the development of the ion-exchange model. All three sites were interlayer sites. The NaMnt montmorillonite has a very similar chemical composition to those used in the DFT study, where, assuming a random distribution of octahedral cations in the montmorillonite, the percentages of three groups of structures with different octahedral Fe-Mg distances (j) were approximately 43%, 43%, and 14%, respectively (Li et al. Reference Li, Schulthess, Co, Sahoo and Alpay2020). As discussed earlier, the NaMnt was treated as pure montmorillonite, particularly in terms of the types of adsorption sites present. The CEC might be smaller than expected due to impurities, but the distribution of sites should remain similar to those in montmorillonite. The maximum amount of cations adsorbed on NaMnt was 710 μmol/g (Fig. 2); accordingly, the CEC of each adsorption site was 305, 305, and 100 μmol/g for sites with j = 1, 2, and 3, respectively. These sites were labelled S a , S b , and S c for j = 1, 2, and 3, respectively.
The H+ cation exists in all aqueous solutions, and it is an inevitable competitor in ion-exchange reactions. Therefore, the H+ cation was considered as the reference cation for the presentation of all cation-adsorption equilibrium constants. On each site S i (i = a, b, or c), the Na+-H+ ion-exchange reaction was:

The unknown value of K for each site is given by the ratio of total activities of products over reactants:

where () and {} indicated the ionic activities of cations in solution or adsorbed on the solid surface. The known adsorption maxima (Γmax) for each site was the sum of adsorbed H+ and Na+ cations:

Thus, the only unknown parameters were the K constants of Na+ on each site, which were optimized based on the least square of errors using IExFit software. The optimization of the negative logarithm of K values (pK, Table 4) showed that the three-site ion-exchange model was able to fit the Na+ adsorption data very well for both low and high Na+ concentrations (Fig. 4). The pK values increased with sites S a < S b < S c , which means that the Na+ adsorption strength decreased relative to H+ adsorption in the order S a > S b > S c .
The negative logarithm of ion-exchange equilibrium constants (pK) optimized using an ion-exchange model for sites Sa, Sb, and Sc. The CEC for each site was obtained according to Li et al. (Reference Li, Schulthess, Co, Sahoo and Alpay2020) and a maximum retention value of 710 μmol/g (Fig. 2)

Adsorption envelopes of Na+ on NaMnt. The initial conditions are shown in Table 2. Lines are the predicted relationship using the ion-exchange model. The goodness-of-fit is Efron’s pseudo-R 2

When a coexisting cation M + (namely Cs+, K+, Li+) was present, additional ion-exchange reactions were involved:

with corresponding unknown equilibrium constants:

The nature (e.g. location and CEC) of adsorption sites and the value of K for each cation are characteristic for each clay mineral, and ideally this should hold true regardless of the presence of other minerals and competing cations. Therefore, the number of sites, CEC of each site, and the adsorption equilibrium constant of Na+ were kept constant in the presence of other cations. The known adsorption maxima for each site was defined as:

Thus, in these competitive ion-exchange reactions, the only unknown parameters were the pK values of the coexisting cations.
The optimization of the pK values showed that the competitive ion-exchange model was able to predict the retention of all the cations very well (Fig. 5, Table 4). The optimized pK values for different cations increased with sites S a < S b < S c , which means that the cation adsorption strength decreased relative to H+ in the opposite order. The pK values increased in the order Cs+ < K+ < Na+ < Li+ for sites S a and S b , but stayed the same for Cs+ and K+, and Na+ and Li+ on site S c , which indicated that the cation adsorption strength decreased in the opposite order on sites S a and S b .
Cation adsorption data of Na+-H+-M+ (M+: Li+, K+, or Cs+) on NaMnt as a function of pH. The initial conditions are shown in Table 2. Lines are predicted adsorption data using the ion-exchange model. The goodness-of-fit is Efron’s pseudo-R 2

The alkali cation adsorption strength has been studied widely on montmorillonite, and the hydration energy was suggested to be the determining factor for the isovalent cation adsorption selectivity on clay minerals (Teppen and Miller Reference Teppen and Miller2006; Rotenberg et al. Reference Rotenberg, Morel, Marry, Turq and Morel-Desrosiers2009). In the interlayer space of clay minerals, cations with lower hydration energy tend to dehydrate partially or fully and adsorb strongly (Teppen and Miller Reference Teppen and Miller2006; Salles et al. Reference Salles, Bildstein, Douillard, Jullien and Van Damme2007). The hydration energy of alkali cations in the interlayer space decreases in the order Li+ > Na+ > K+ > Cs+ (Salles et al. Reference Salles, Bildstein, Douillard, Jullien and Van Damme2007); thus, the K+ and Cs+ cations are more easily dehydrated, and are strongly adsorbed on these sites (Teppen and Miller Reference Teppen and Miller2006; Salles et al. Reference Salles, Bildstein, Douillard, Jullien and Van Damme2007). The pK values obtained in the present study (Table 4) were consistent with the proposed adsorption mechanisms for these alkali cations (Teppen and Miller Reference Teppen and Miller2006; Rotenberg et al. Reference Rotenberg, Morel, Marry, Turq and Morel-Desrosiers2009).
Model Testing
Using all the known adsorption parameters (i.e. the number of sites, CEC of each site, and equilibrium K constants), the cation adsorption in various chemical environments can be predicted by constructing their corresponding competitive ion-exchange models. First, the model was tested for competitive cation adsorption as a function of pH. When two types of coexisting cations M +1 and M +2 (namely Cs+, K+, Li+) were present, additional competitive ion-exchange reactions occurred. The cation adsorption maxima on site S i (i = a, b, or c) was:

Using the same known pK values from Table 4 and Γmax,Si values based on the previous DFT study (Li et al. Reference Li, Schulthess, Co, Sahoo and Alpay2020), the three-site competitive ion-exchange model showed that the predicted values agreed with the experimental data very well (Fig. 6). The consistency of the pK values in various reactions suggested that cation adsorption followed an ion-exchange reaction, and that the pK values were not influenced by the presence of co-existing cations.
Cation adsorption data of Na+-H+-M +1-M +2 (M+1,2: Li+, K+, or Cs+) on NaMnt as a function of pH. The initial conditions are shown in Table 2. Lines are predicted adsorption data using the ion-exchange model. The goodness-of-fit is Efron’s pseudo-R 2

Second, the model was tested with Cs+ adsorption isotherm data at pH 3.5, 5.5, and 8.3 (Fig. 7). The predicted Cs+ and Na+ adsorptions were obtained for various initial Cs+ concentrations using IExFit software. The model was able to predict the experimental Cs+ adsorption isotherm data very well. Thus, the competitive ion-exchange model was able to predict cation adsorption on NaMnt over a wide range of pH, Cs+ concentrations, and in the presence of competing cations with the same CEC and pK values. Moreover, the prior determination of the number of sites and CEC of each site on NaMnt reduced the number of unknown variables in the model, which increased the certainty and confidence in the model optimization results.
Experimental data and predictions from the ion-exchange model and Langmuir equation of cation adsorption on NaMnt at pH a 3.5, b 5.5, and c 8.3. ▲ and ● represent the adsorbed Cs+ and Na+ experimental data, respectively. The goodness-of-fit is Efron’s pseudo-R 2

Comparison of Ion-Exchange Model with Langmuir Isotherm
The Langmuir isotherm is one of the most widely used adsorption models (Table 5). The Langmuir isotherm is based on an adsorption reaction on one type of site: S + A ⇌ SA. For Cs+ adsorption, the Langmuir isotherm predicts the amount adsorbed (q) in μmol/g as

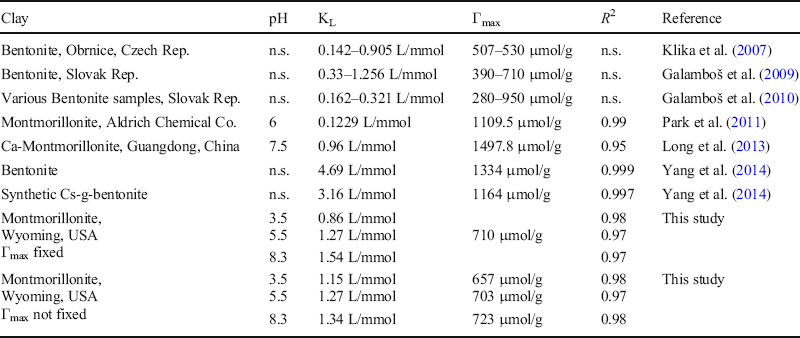
where c is the equilibrium Cs+ concentration (mmol/L), Γmax is the maximum amount of cation adsorbed (μmol/g), and KL is the Langmuir constant. The Langmuir isotherm for Cs+ adsorption on NaMnt was optimized using LMMpro software which will optimize both KL and Γmax values, as well as optimize the KL value using a fixed Γmax value (710 μmol/g in this study). Both results are shown in Table 5 and Fig. 7.
Recently published Langmuir models for Cs+ adsorption on montmorillonite. R 2 is the coefficient of determination, and KL is the Langmuir constant

n.s.: not specified
The cation adsorption isotherm was predicted very well with both the ion-exchange model and the Langmuir equation. Compared to the Langmuir equation, however, the ion-exchange model has several advantages. First, the Langmuir equation does not consider the adsorption of H+ cations. The influence of the H+ cation on Cs+ adsorption was demonstrated by the increase in the CEC and equilibrium KL constant (from 0.86 to 1.27 and 1.54 L/mmol) with increasing pH in the Langmuir equation (Table 5). Ideally, the KL constant at equilibrium and total CEC should be the same for the same cation and solid surface regardless of pH changes. Conversely, K did not change in the ion-exchange model at different pH conditions. Second, the Langmuir equation can predict only the adsorption of one cation (namely Cs+ in this study), while the ion-exchange model predicts all the competing cations in the system. For example, Fig. 7 showed a good prediction of Na+ desorption by the ion-exchange model, which cannot be done by the Langmuir model. Third, various studies have shown that multiple types of adsorption sites exist on montmorillonite (Nolin Reference Nolin1997; Tertre et al. Reference Tertre, Prêt and Ferrage2011; Missana et al. Reference Missana, Benedicto, García-Gutiérrez and Alonso2014; Siroux et al. Reference Siroux, Beaucaire, Tabarant, Benedetti and Reiller2017; Martin et al. Reference Martin, Wissocq, Benedetti and Latrille2018; Wissocq et al. Reference Wissocq, Beaucaire and Latrille2018). The Langmuir equation is based on a single type of site, which does not elucidate the real nature and property of adsorption sites on montmorillonite. Conversely, combining the DFT study (Li et al. Reference Li, Schulthess, Co, Sahoo and Alpay2020) with the ion-exchange model presented in this study provided information not only about the number, location, and chemical structure of each adsorption site (based on the octahedral Fe-Mg distance), but also the CEC and retention strength of each site.
Klika et al. (Reference Klika, Kraus and Vopálka2007) also compared the Langmuir equation with a one-site ion-exchange model that did not include H+ cations in the exchange reaction. Both models were able to predict Cs+ adsorption on bentonite as a function of the bentonite/water ratio and Cs+ concentration very well. However, the ion-exchange model was suggested to be more convenient because of its ability to be used over a wider range of conditions with a single set of model parameter values, while the parameters of the Langmuir model varied with experimental conditions.
The wide application of the Langmuir isotherm in the literature (Table 5) suggests that this equation works very well for the prediction of adsorption data, even though it may not properly clarify real adsorption mechanisms on solid surfaces. The validity of the Langmuir isotherm to predict adsorption data comes from its mathematical similarities to the ion-exchange model. The Cs+ adsorption isotherm on NaMnt involved a three-way ion-exchange competition (H+-Na+-Cs+). The total adsorbed Cs+ was the sum of the Cs+ adsorbed on three types of sites. According to the ion-exchange reactions, the total amount of adsorbed Cs+ on NaMnt (q, μmol/g) was

where q 1, q 2, and q 3 were the maximum adsorption capacity for each site on NaMnt (μmol/g); K 1, K 3, and K 5 were the adsorption equilibrium constants of Na+ on sites S a , S b , and S c in NaMnt; K 2, K 4, and K 6 were the adsorption equilibrium constants of Cs+ on sites S a , S b , and S c in NaMnt; and (Na+) and (Cs+) were the aqueous equilibrium Na+ and Cs+ concentrations. In Eq. 9, the H+ competition was constant because the equilibrium aqueous pH was fixed for each Cs+ isotherm. The q 1 to q 3 and K 1 to K 6 values were obtained directly from Table 4. Equation 9 can be modified into three components (one for each site):

where K x =
 , K y =
 , K z=
 , and c o =
 . While the Cs+ concentration is changed in the experiment, the Na+ concentration changes as a direct result of the Cs-Na exchange reactions. In Eq. 10, the
 ratio is the independent variable. Whenever each of the component values in Eq. 10 is significant, the corresponding
 ,
 , and
 values become insignificant and can be ignored. Accordingly, Eq. 10 simplifies to:

Equation 11 has the same format as the Langmuir isotherm (Eq. 8), which explains why the ion-exchange model yields similar curves as the Langmuir equation.
Numerous studies have been conducted to predict ion adsorption on 2:1 clay mineral surfaces using the Langmuir isotherm (Table 5), which assumes implicitly that the reaction is an adsorption reaction (S + A ⇌ SA) rather than an ion-exchange reaction (SA+B ⇌ SB+A) on a single type of surface site. Even though the Langmuir isotherm was able to predict the cation adsorption data very well, this was nothing more than a mathematical coincidence with the ion-exchange model predictions for specific experimental conditions. That is, the Langmuir isotherm was validated (as in ‘shown to be useful’) for a narrow range of conditions, but was not verified (as in ‘shown to be truthful’) when applied to a wide range of conditions. The competitive multi-site ion-exchange model proposed here was verified by DFT simulations (Li et al. Reference Li, Schulthess, Co, Sahoo and Alpay2020) for the three sites of the model as well as the relative CEC of each site. The model was tested using various adsorption data over a wide range of pH, Cs+ concentrations, and multiple competing cations, which validated the proposed model. This also suggests that many published studies that used Langmuir isotherms should be revisited and reevaluated using ion-exchange models. Furthermore, if cations or anions are involved in the models, these models should also include competitive H+ or OH– ions in their exchange reactions.
Relationship Between Interlayer Structure and pK Values
The reported pK values are a measure of the retention strength of cations relative to H+ cations. The retention strength of cations is essentially a result of the total energies of two competing environments: total energy of adsorption on the surface sites versus total energy of hydration in the aqueous phase. A high (or more positive) pK value denotes a weakly adsorbing cation, probably outer-sphere adsorption, and a low (or more negative) pK value denotes a strongly adsorbing cation, probably inner-sphere adsorption. An adsorbing cation is not strictly either inner-sphere or outer-sphere adsorbed, but rather it is a combination of the two with a wide range of possibilities (Ferreira et al. Reference Ferreira, Schulthess and Giotto2012; Salles et al. Reference Salles, Douillard, Bildstein, El Ghazi, Prélot, Zajac and Van Damme2015), and this results in a wide range of pK values for different ions. Not surprisingly, the adsorption strength of monovalent ions is often shown to be closely associated with their hydration energies (Teppen and Miller Reference Teppen and Miller2006; Salles et al. Reference Salles, Bildstein, Douillard, Jullien and Van Damme2007). If the adsorption pK values are influenced by the relative degree of hydration of an adsorbing ion averaged across its total retention time, then it should follow that these pK values will also influence the interlayer dimensions of 2:1 clays.
Montmorillonite is expansive, and the interlayer cation has an influence on its interlayer dimension (Fig. 8). The samples were analyzed while wet to ensure the in situ hydration condition of the interlayer cations using XRD. The XRD analysis of cation-saturated montmorillonite showed that the d 001 value of HMnt (15.2 Å) was similar to those of LiMnt (15.9 Å) and NaMnt (15.6 Å), which suggested the interlayer thickness of the hydrated H+ cation (such as the hydronium cation, H3O+) was similar to the interlayer thickness of hydrated Li+ and Na+ cations. The d 001 values decreased progressively for LiMnt and NaMnt, followed by a broad peak for KMnt (13.6 Å) and a broad peak for CsMnt (12.5 Å). The interlayer dimension follows the hydration energies of these alkali cations, and similar results were observed in the literature for montmorillonite samples (Ferrage et al. Reference Ferrage, Lanson, Sakharov and Drits2005; Iijima et al. Reference Iijima, Tomura and Shoji2010; Ohkubo et al. Reference Ohkubo, Okamoto, Kawamura, Guégan, Deguchi, Ohki, Shimizu, Tachi and Iwadate2018).
XRD patterns of wet montmorillonite saturated with Li+ (LiMnt), Na+ (NaMnt), K+ (KMnt), Cs+ (CsMnt), and H+ (HMnt) cations. The d 001 values (Å) are also shown. The pH values were between 6 and 7 for alkali cation-saturated montmorillonite, and <1 for the HMnt

The hydration properties of SWy-1 montmorillonite were investigated by Ferrage et al. (Reference Ferrage, Lanson, Sakharov and Drits2005) by modeling experimental XRD patterns; those authors found that the d 001 values at 80% relative humidity were 15.49, 15.28, and 12.04 Å when the interlayer cations were Li+, Na+, and K+ cations, respectively. The hydration states of these interlayer cations were suggested to be heterogeneous, with hydrated Li+ and Na+ consisting mostly of two layers of water molecules, and hydrated K+ consisting mostly of one layer of water. A similar study by Morodome and Kawamura (Reference Morodome and Kawamura2011) showed that hydrated Cs+ contained one layer of water when the d 001 was 12.2 Å.
Collapse of the interlayer region of montmorillonite has been observed widely in other Cs+-adsorption experiments (Iijima et al. Reference Iijima, Tomura and Shoji2010; Ohkubo et al. Reference Ohkubo, Okamoto, Kawamura, Guégan, Deguchi, Ohki, Shimizu, Tachi and Iwadate2018). The collapse was suggested to be related to the low hydration energy of the Cs+ cation (Cornell Reference Cornell1993; Salles et al. Reference Salles, Bildstein, Douillard, Jullien and Van Damme2007; Iijima et al. Reference Iijima, Tomura and Shoji2010; Ohkubo et al. Reference Ohkubo, Okamoto, Kawamura, Guégan, Deguchi, Ohki, Shimizu, Tachi and Iwadate2018). The interlayer Cs+ was shown to have a greater affinity toward the clay surface than toward the water molecules using computational molecular mechanics, which resulted in the dehydration of interlayer Cs+ cations and the collapse of the interlayer (Teppen and Miller Reference Teppen and Miller2006).
The XRD pattern of NaMnt changed as a function of the Cs+ competitive adsorption at pH 8.3 (Fig. 9). The d 001 value of NaMnt did not change when 5% Cs+ was adsorbed. When 15% of the Cs+ was adsorbed, the peak at 15.6 Å became very small, and a new peak at 12.5 Å appeared. As the Cs+ concentration increased, the Cs+ cations displaced the interlayer Na+ cations, which decreased the number of stacked montmorillonite layers dominated with interlayer Na+ and resulted in a broader XRD peak at 15.6 Å. When the adsorbed Cs+ reached 33%, the peak at 15.6 Å disappeared, which suggested that the number of stacked montmorillonite layers dominated with interlayer Na+ was too low to create an XRD peak. The new broad peak at 12.5 Å indicated the formation of stacked montmorillonite layers with Cs+.
XRD pattern of wet NaMnt samples from Cs+ adsorption isotherms at pH 8.3 with different percentages of adsorbed Cs+ from Fig. 7c. The NaMnt and CsMnt labels indicate the Na+- and Cs+-saturated clay samples, respectively. The d 001 values (Å) are also shown

Iijima et al. (Reference Iijima, Tomura and Shoji2010) also observed that the interlayer space decreased with increasing exchange of Cs+ for Na+ cations on montmorillonite. Multiple peaks appeared in their XRD pattern when the aqueous Cs+ concentration was ~1–10 mmol/L, which suggested that multiple interlayer spaces exist in the transition phase. Similarly, Ohkubo et al. (Reference Ohkubo, Okamoto, Kawamura, Guégan, Deguchi, Ohki, Shimizu, Tachi and Iwadate2018) observed the coexistence of several d 001 peaks in montmorillonite with 36% and 59% Cs+ exchange fractions in their XRD patterns, which suggested that Cs+ and Na+ competed for the interlayer space. These authors proposed that the competition between Cs+ and Na+ cations in the interlayer space resulted in a non-flat and geometrically heterogeneous interlayer space. However, a non-flat geometry will not yield any distinct peaks based on kinematical scattering theory (Moore and Reynolds Reference Moore and Reynolds1989). Instead, the presence of two peaks suggested the presence of heterogeneous interlayer spaces (a mixture of different interlayer spaces in the clay particle), with a variable distribution of dominance of Cs+ or Na+ ions in the interlayers. This alternate interpretation of the two coexisting XRD peaks is consistent with Pauling’s rule #5, where the number of different kinds of constituents in a crystal environment tends to be small. This alternate interpretation is also consistent with the observation that the pK values in Table 4 did not need to change when competitive cations were introduced in the adsorption envelope experiments (Figs. 5 and 6). According to the NISE effect (Ferreira and Schulthess Reference Ferreira and Schulthess2011; Schulthess et al. Reference Schulthess, Taylor and Ferreira2011), shrinkage of the interlayer space past specific threshold dimensions should impact the retention strength and pK values of the adsorbing ions. However, as using constant pK values resulted in good data fit in different chemical environments, the retention strength of cations appeared to be independent of the presence of other ions. This, in combination with the XRD data, suggests that some segregation of the interlayer cations existed with minimal ion-ion interactions and influence.
The peak position in the XRD patterns of montmorillonite did not change with pH for samples from the same cation adsorption envelope (Fig. 10). This indicated that the clay interlayer structure was consistent as a function of pH. The XRD patterns of montmorillonite with K-Li-Na, Cs-Li-Na, and Cs-K-Na ion-exchange reactions showed broadening of the 12.5 Å peak toward smaller d 001 values (Fig. 11). This suggested that the interlayer structures of three competing cations (Fig. 11) were more heterogeneous than the samples of two competing cations (Figs. 8, 9, and 10).

XRD pattern of wet NaMnt samples from K,Li-NaMnt, Cs,Li-NaMnt, and Cs,K-NaMnt adsorption reactions at pH 7 from Fig. 6. The d 001 values (Å) are also shown

Using complex impedance spectroscopy and water adsorption isotherms on montmorillonite, Salles et al. (Reference Salles, Douillard, Bildstein, El Ghazi, Prélot, Zajac and Van Damme2015) observed the diffusion coefficients of Li+ and Na+ increased with relative humidity (RH), and reached a plateau at high RH (around 80%) that were similar to that in bulk water. Conversely, the diffusion coefficients of K+ and Cs+ reached a maximum at low RH (20% and 10%, respectively), and then remained constant as RH increased. The change in diffusion coefficients suggested that Li+ and Na+ were easily hydrated in the interlayer space at high RH and adsorbed via outer-sphere adsorption, but K+ was hydrated with one water layer and adsorbed via inner-sphere adsorption, and Cs+ was barely hydrated and adsorbed via inner-sphere adsorption independent of RH (Salles et al. Reference Salles, Douillard, Bildstein, El Ghazi, Prélot, Zajac and Van Damme2015). The pK values obtained in this study (Table 4) and the XRD patterns in Figs 8 to 11 were consistent with the adsorption mechanisms of outer- and inner-sphere retention for these alkali cations proposed by Salles et al. (Reference Salles, Douillard, Bildstein, El Ghazi, Prélot, Zajac and Van Damme2015).
Conclusions
Although traditional methods of model-fitting experimental adsorption data can confirm the number of uniquely different adsorption sites present, they cannot confirm definitively the location of these adsorption sites on the clay mineral. This results in much uncertainty in the validity of the parameters introduced in the model. The construction of competitive ion-exchange models for montmorillonite can be simplified if some of the parameters needed are obtained independently from the experimental values it seeks to describe. The current study showed successfully that traditional construction of an ion-exchange model can be enhanced with results from a previously published DFT study (Li et al. Reference Li, Schulthess, Co, Sahoo and Alpay2020). The DFT study offered information on the number of sites, the location, and the percentage of each adsorption site present. The remaining parameters (total adsorption maximum and pK values) were obtained from curve-fitting the experimental adsorption envelope data. Cation adsorption strengths from strongest to weakest were Cs+ > K+ > Na+ > Li+. With all the parameters kept constant, the ion-exchange model was tested using multiple cation competitions as a function of pH, and various Cs+ concentrations at three different pH values. The goodness-of-fit for all these tests were very good.
The Langmuir equation also fitted the Cs+ adsorption isotherm very well. However, the goodness-of-fit of a model does not verify the mechanisms implied by the model. This Langmuir equation resembles the ion-exchange model when the pH is fixed, which suggests that many published studies that used Langmuir isotherms should be revisited and reevaluated using ion-exchange models. Ion-exchange models offer a more mechanistic interpretation of the reactions involved (e.g. the nature of desorbed cations and the implication of competitive H+ ions), and are able to predict the adsorption of all coexisting exchangeable cations over a wide range of chemical conditions.
The measured d 001 values for the cation-saturated montmorillonite samples were consistent with their hydration energies and adsorption pK values. Interlayer spaces increased as follows: Cs+ < K+ < Na+ < Li+. In the presence of multiple competing cations, the broadening and presence of multiple d 001 XRD peaks suggested that the cations in the interlayers may be segregated.
ACKNOWLEDGMENTS
The authors acknowledge the assistance of Dawn Pettinelli and Deborah Tyser of the University of Connecticut Soil & Nutrient Analysis Lab. This work was supported by the USDA National Institute of Food and Agriculture, Hatch project accession number 1013470.
Funding
Funding sources are as stated in the acknowledgment.
Compliance with Ethical Statements
Conflict of Interest
The authors declare that they have no conflict of interest.