INTRODUCTION
Plantain (Musa acuminata × Musa balbisiana, AAB), a major food and cash crop in West and Central Africa and of great importance in Cameroon (Temple et al. Reference Temple, Kwa, Fogain and Mouliom Péfoura2006), is mainly cropped on small farms and in home gardens (Crouch et al. Reference Crouch, Crouch, Madsen, Vuylesteke and Ortiz2000). A typical plantain field generally contains a wide range of annual and perennial types (Devos & Wilson Reference Devos and Wilson1983; Yao Reference Yao1988; Achard et al. Reference Achard, Malézieux, Robin, Ganry, Bertschinger and Anderson2002) and different plantain varieties often from various plantain types, e.g. a mixture of French and False horn varieties. There is a lack of knowledge on growth, development and suitability of plantain varieties to the context in which they are grown (Odah et al. Reference Odah, Aziadekey, Tozo, Akpavi, Koukouma, Guelly, Kokou, Assignon, Akogo, Aidam, Akpagana, Kenny, Ait-Oubahou, Zinsou and Gbeassor2013). Currently, the choice of varieties grown is generally driven by farmers’ habits and local knowledge rather than by standardized knowledge on their performance. Increasing variety-specific knowledge is a first step to help farmers improve production of their cropping systems.
More than 135 varieties have been described in the African Center for Research on Bananas and Plantains (CARBAP) reference collection, with a wide range of morphologic and agronomic traits, e.g. inflorescence type, plant size, fruit orientation, fruit number, fruit colour, etc. (Swennen et al. Reference Swennen, Vuylsteke and Ortiz1995; De Langhe et al. Reference De Langhe, Pillay, Tenkouano and Swennen2005). The structure of the inflorescence and of the male bud determines four plantain sub-groups: ‘French’, ‘French horn’, ‘False horn’ and ‘True horn’ plantains. In each group, pseudostem height is used to classify varieties into ‘giant’, ‘medium’ and ‘small’ sizes. Through these sub-groups, the following agronomic parameters, which are considered as yield components, are extremely variable: length of crop cycle, number of emitted leaves, number of hands and fruits per bunch, individual fruit weight, etc. (De Langhe et al. Reference De Langhe, Pillay, Tenkouano and Swennen2005). The main hypothesis is that this morphological diversity produces variability in biological processes involved in yield elaboration, i.e. biomass allocation to fruits, and in suitability to the growing context. The resulting hypothesis is that new plantain-like hybrids, with a different genetic base, have different yield processes. An understanding of these differences can provide the basis for variety-specific production strategies.
Crop models are effective tools for understanding yield elaboration and evaluating agronomic performance (Brisson et al. Reference Brisson, Mary, Ripoche, Jeuffroy, Ruget, Nicoullaud, Gate, Devienne-Barret, Antonioletti, Durr, Richard, Beaudoin, Recous, Tayot, Plenet, Cellier, Machet, Meynard and Delécolle1998; Jones et al. Reference Jones, Hoogenboom, Porter, Boote, Batchelor, Hunt, Wilkens, Singh, Gijsman and Ritchie2003; Keating et al. Reference Keating, Carberry, Hammer, Probert, Robertson, Holzworth, Huth, Hargreaves, Meinke, Hochman, McLean, Verburg, Snow, Dimes, Silburn, Wang, Brown, Bristow, Asseng, Chapman, McCown, Freebairn and Smith2003; Dorel et al. Reference Dorel, Achard and Tixier2008). Plant growth, i.e. accumulation of biomass, and development, i.e. onset of various growth stages, depend on the interaction of radiation interception, phenology and dry matter allocation to organs. Assessing the suitability of a variety for given climatic and cultural conditions requires the integration of all of these parameters in a global crop model. Crop models have been used successfully to better understand the interaction of varietal performance with cropping conditions; the development of dynamic models has been necessary to capture the specificities of the crop (Casadebaig et al. Reference Casadebaig, Guilioni, Lecoeur, Christophe, Champolivier and Debaeke2011).
The present paper proposes a crop model that describes growth, development and yield elaboration based on field data from five commonly cropped real plantain varieties in Cameroon and four plantain-like hybrids (see ‘Materials and Methods’ for details). Data from a field experiment were used to obtain values for most parameters concerning growth, development and biomass allocation. Other parameter values were obtained from the literature or by model fitting. The aim was to represent, understand and compare the details of yield elaboration between these nine studied varieties. The results provide new information about commonly cropped plantain varieties and represent the first step towards benchmarking plantain agronomic performances. They also highlight that increased knowledge of plantain physiology is needed to better model the performance of plantain varieties, leading to more efficient cropping systems.
MATERIALS AND METHODS
Field experiment
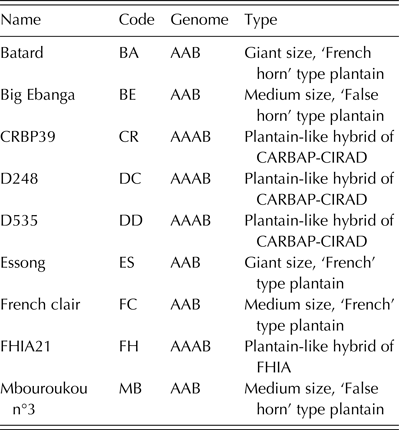
In a field experiment, growth, development and yield parameters of nine varieties were assessed. The varieties were five real plantains that are commonly cropped in Cameroon and four plantain-like hybrids (Table 1). Real plantains are triploid varieties (AAB) (Daniells et al. Reference Daniells, Jenny, Karamura and Tomekpe2001), while hybrids are tetraploid varieties (AAAB). Varieties CR and FH (see Table 1 for variety abbreviations) are well-known hybrids that have been evaluated in rural communities for several years (Dzomeku et al. Reference Dzomeku, Bam, Adu-Kwarteng, Darkey and Ankomah2007, Reference Dzomeku, Armo-Annor, Adjei-Gyan, Ansah, Nkakwa and Darkey2008; Hauser Reference Hauser2010; Garming et al. Reference Garming, Espinosa, Guardia and Jimenez2013), while DD and DC are new hybrids developed by the CARBAP and International Center of Agricultural Research for Development (CIRAD) collaborative breeding programme. The nine varieties studied have a wide range of genetic, growth and developmental characteristics, and represent a substantial portion of plantain diversity with three plantain sub-groups included (French, French horn and False horn) as well as new diversity being developed through plantain breeding.
Names, codes, genomes and taxonomic information for the nine varieties in the current study. ‘A’ and ‘B’ in the genome description indicate the level of ploidy from acuminata and balbisiana genomes, respectively

The experiment was conducted at the CARBAP agronomic station (4°34′N; 9°38′E; 79 m a.s.l.) in Njombé (Littoral Province, Cameroon) from June 2009 to December 2010. The area has a young brown andosol derived from a volcanic platform. The humid tropical climate has two main seasons: an 8-month rainy season from mid-March to mid-November and a 4-month dry season. Daily climatic data were obtained using an automatic meteorological station (Campbell Scientific Inc., Logan, UT). Additionally, two Tinytag™ data loggers (Gemini Data Loggers Ltd., Chichester, UK) measured temperature at the experiment site at 1 m above soil level. During the crop cycle studied, the total rainfall was 2610 mm, the monthly mean temperatures ranged from 25·0 to 27·4 °C, and the daily mean global radiation ranged from 7·8 to 13·8 MJ/m2. Plant materials consisted of healthy and homogeneous plantlets that were produced by a pathogen-free in vivo vegetative method (Kwa Reference Kwa2003). These materials were arranged in a completely randomized block design with five replicates and nine plantlets per variety per replicate (45 plantlets per variety, 405 plantlets in total). Plantlets were planted in a 2 × 3 m2 pattern, leading to 1667 plantlets/ha. Non-limiting cropping conditions were achieved by providing mineral nutrition, irrigation, and control of weeds, pests and diseases. Mineral nutrition followed an intensive programme that is recommended for sweet banana monoculture systems in the area (Lassoudière Reference Lassoudière2007) and that provided quantities of nutrients in excess of known plantain needs (Marchal & Malessard Reference Marchal and Malessard1979): each plant was fertilized twice per month such that the totals applied by harvest per plant were 270 g nitrogen, 140 g phosphorus, 900 g potassium, 400 g calcium, 300 g magnesium and 100 g sulphur. Irrigation was applied to prevent water stress and was based on weekly data from six tensiometers. Weed competition was eliminated by manual clearing until the third month and by non-selective herbicide applications after that. Black Sigatoka disease caused by Mycosphaerella fijiensis was controlled by weekly fungicide application and manual pruning of diseased leaves. Plant-parasitic nematodes (Radopholus similis in particular) were controlled by nematicide application every 3 months. The banana weevil Cosmopolites sordidus was controlled by deploying a high density of pheromone traps, which were emptied weekly, and by insecticide application. A homogenous population of plantains was maintained by early sucker selection and weekly desuckering from the third month after planting. Potential production conditions were ascertained for nutrition by analysis of leaves at flowering, and by weed, pest and disease monitoring.
All 405 plants were measured twice each month from planting to harvest, totalling 24 and 35 measures per plant per cycle, according to variety. These morphologic and agronomic measures resulted in the characterization of parameters needed to model growth, development and yield elaboration. At each observation date, pseudostem height and girth (at 50 cm above soil level) were measured. Emitted (i.e. the leaves produced by the trees), living and dead leaves were also counted and ranked at each observation date. The length and width of each emitted leaf were measured, and the data were used to calculate leaf area (Murray Reference Murray1960). Green leaf area of each plant was estimated monthly by the OTO (for ‘leaves One, Three, One’) model (Dépigny et al. Reference Dépigny, Achard, Lescot, Djomessi, Tchotang, Ngando and Poix2015). At flowering and harvest, one plantain of each replicate (five plants per variety) was uprooted, dried and weighed by organ (bulb, pseudostem, leaves, bunch and sucker). Monthly estimates of the biomass of each organ for each plant were obtained from these morphologic and dry matter data. At harvest, which was determined when at least one finger of the bunch had turned yellow, bunches with rachis were weighed; the dry matter of rachis and fruits was measured for one bunch per replicate (five bunches per variety). All data were analysed per replicate and per variety, leading to five datasets per variety.
AAB model
A dynamic model describing crop growth, development, and yield elaboration of a plantain crop, was built. The model, which was named the ‘AAB model’, was developed with Stella® software (ISEE Systems, Inc., Lebanon, NH). Its main objective was to integrate parameters describing growth, development and yield of the nine varieties studied. It was used to better understand yield elaboration and yield components as affected by variety.
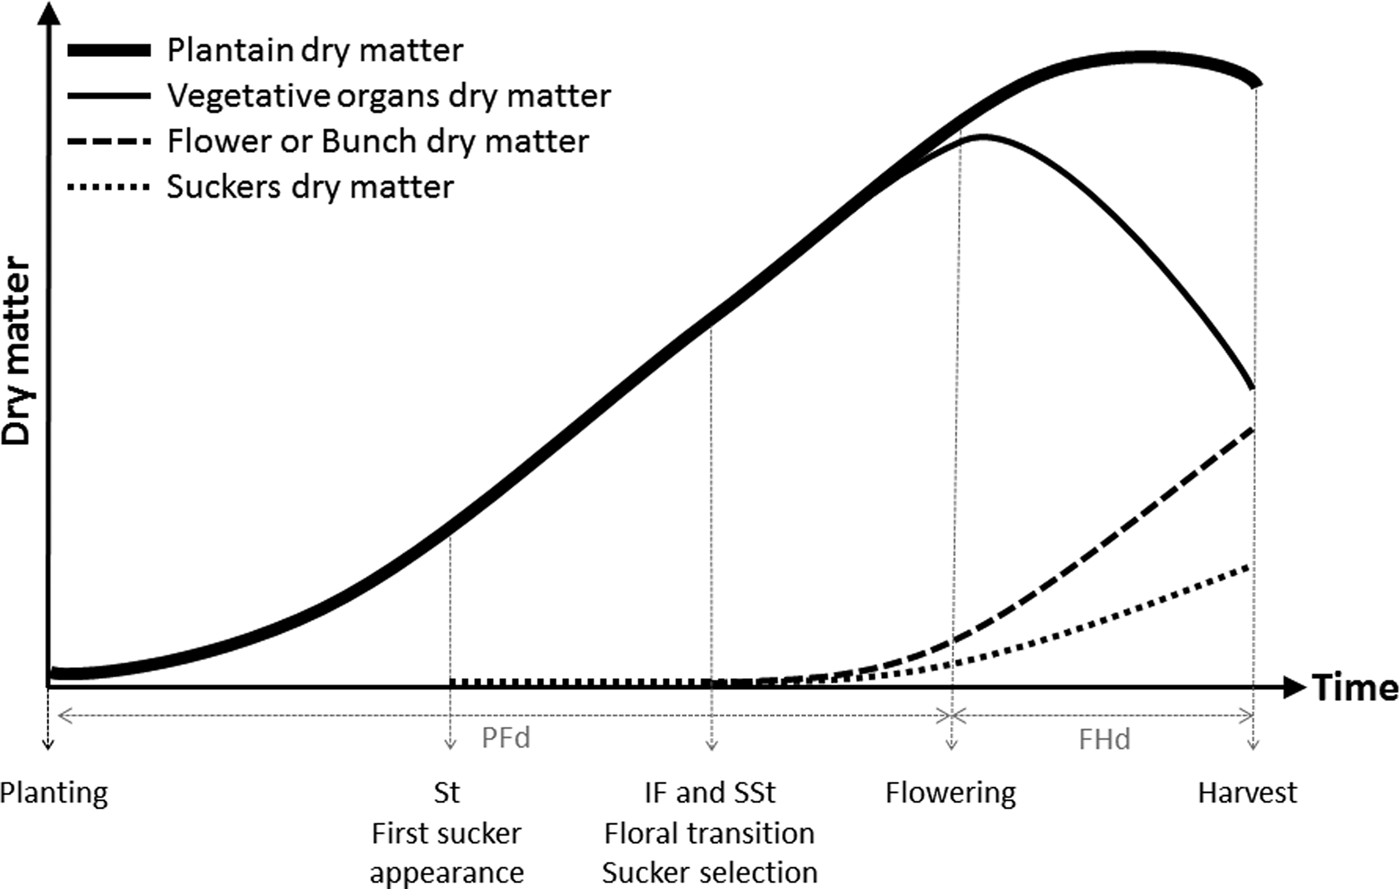
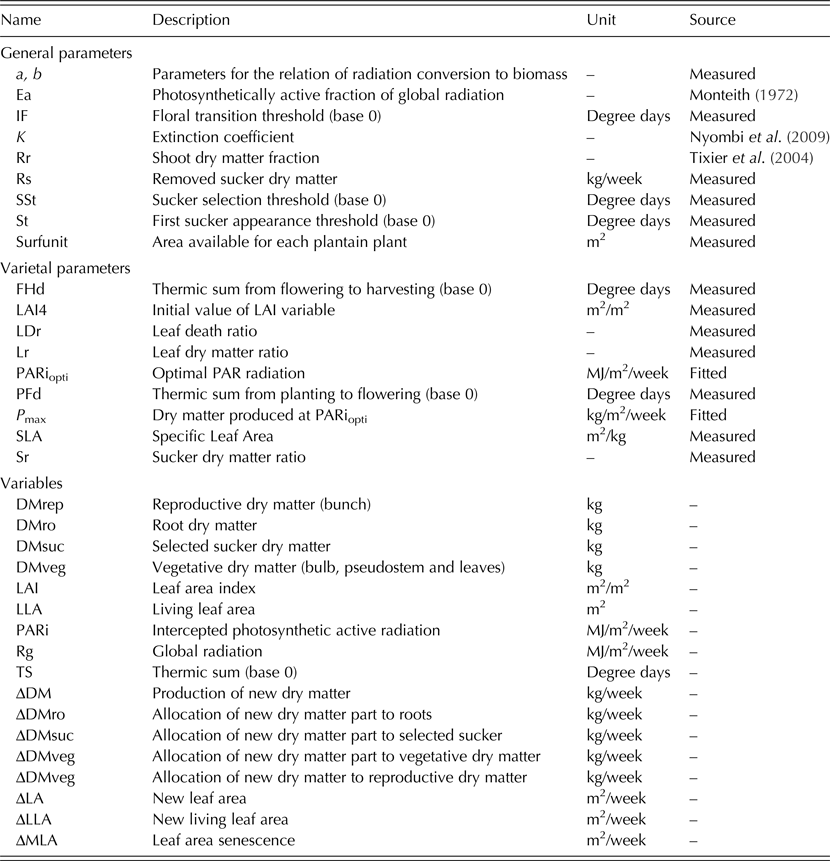
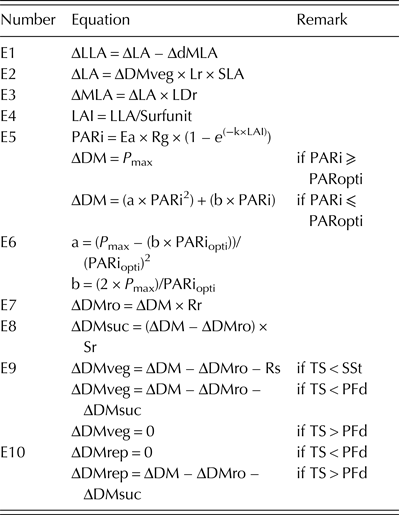
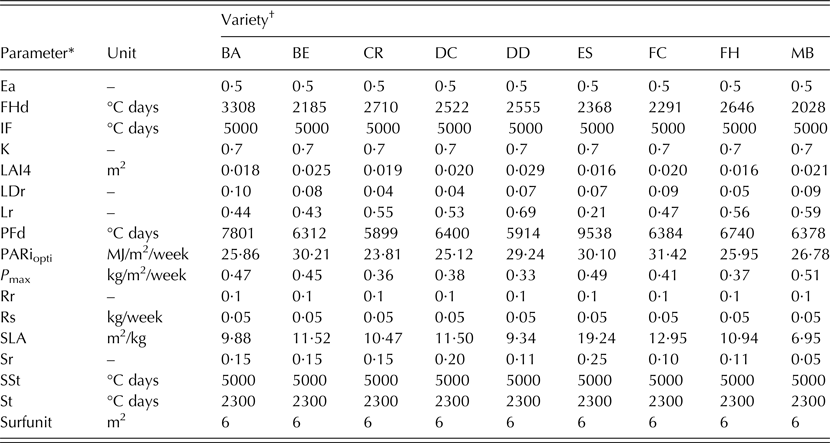
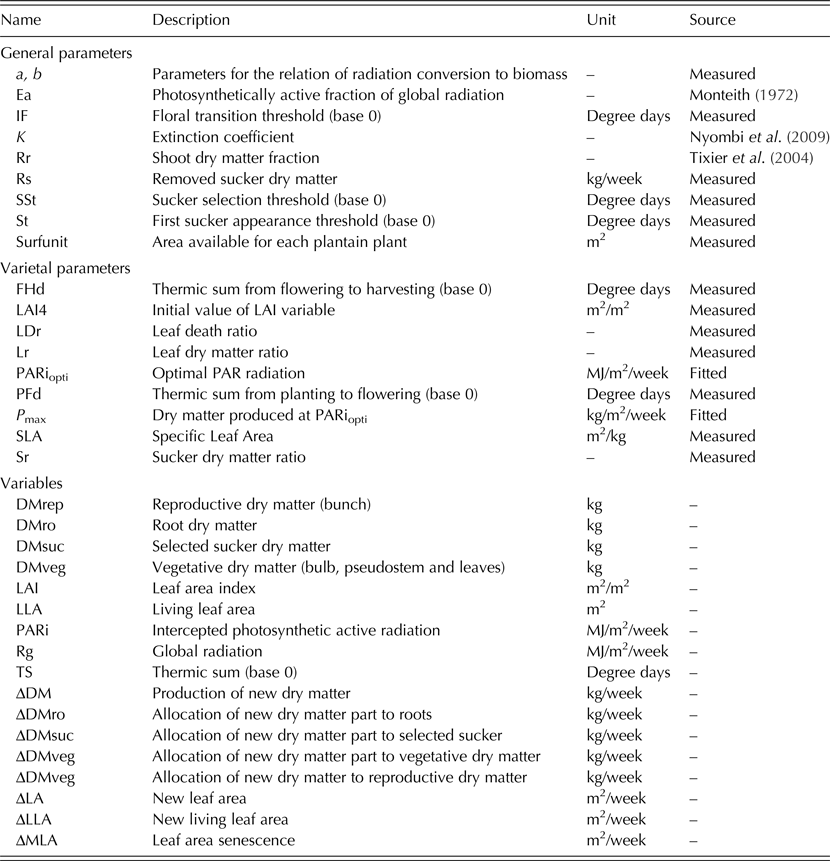
The AAB model is a stock-and-flow model based on equations of radiation interception, conversion of radiation into dry matter and allocation of dry matter among different organs. The model runs at a weekly time step and uses weekly cumulative climatic inputs, i.e. temperature and global radiation. Outputs are the weekly simulated dry matter weights of different organs of an average plantain plant from a homogenous field (Fig. 1). The model includes two types of parameters (Table 2): (i) general parameters obtained from the literature or field experiment and assumed not to vary among varieties, and (ii) varietal parameters directly measured in field experiment, e.g. thermic sum from flowering to harvest, leaf death ratio, etc. Model variables are also presented in Table 2, and the model equations are presented in Table 3. Like banana crop development in the SIMBA model (Tixier et al. Reference Tixier, Malezieux and Dorel2004; Dorel et al. Reference Dorel, Achard and Tixier2008), plantain crop development in the AAB model is driven by the accumulation of heat units. Thermal sums and thresholds determine the time of first sucker appearance (St), sucker selection (SSt), flowering (PFd) and harvest (FHd). Thermal sums are calculated weekly with a 0 °C base temperature. Global radiation (Rg) is intercepted by living leaf area (LLA), which is calculated as the difference (E1) between new leaf area produced (E2) and leaf area senescence (E3). Dry matter allocated to leaf area and lost by leaf senescence on a weekly basis are defined by the leaf dry matter ratio (Lr) and the leaf death ratio (LDr) parameters, respectively. The fraction of the photosynthetically active radiation intercepted (PARi) is calculated with the Lambert–Beer equation (Monteith Reference Monteith1972) based on the photosynthetically active fraction of global radiation (Ea), global radiation (Rg), leaf area index (LAI) derived from LLA (E4) and crop-specific extinction coefficient (K) (E5). New dry matter (ΔDM) is produced according to a parabolic relationship between intercepted radiation and dry matter creation (E6), with an optimal value of PARi (PARiopti) corresponding to a maximum value of dry matter production (P max); parameters a and b in the equation (E6) are directly derived from PARiopti and P max, making possible the simulation of all responses to radiation for each variety. Newly produced dry matter (ΔDM) is partitioned among plant organs: (i) during the entire crop cycle, a part of ΔDM is allocated to roots according to the Rr rate (E7); (ii) from first sucker appearance to sucker selection, a fixed part of ΔDM is lost by desuckering according to the Rs rate, and a part of ΔDM is allocated to the selected sucker (ΔDMsuc) as soon as sucker selection is carried out according to the Sr rate (E8); (iii) during the vegetative stage which ends at flowering, ΔDM net from roots and sucker parts is allocated to vegetative organs including bulb, pseudostem and leaves (E9); and (iv) after flowering, ΔDM net from root and sucker parts is allocated to reproductive organs (E10).
Illustration of the dry matter growth of plantain's organs (bulb, pseudostem, leaves and flower or bunch), as simulated by the AAB model. Bunch dry matter and selected sucker dry matter increase from the beginning of the floral transition period (IF). The beginning of flowering and harvest are determined according to the thermal thresholds PFd and FHd.

General and varietal parameters, and variables of the AAB model
Equations of the AAB model, including parameters defined in Table 2

Model calibration and evaluation
Except for PARiopti and P max, model parameters were measured in the field experiment or obtained from the literature (Table 2). Measured parameters were derived from the data analysis of the five replicates of each variety (45 plants per variety and nine plants per replicate). Leaf dry matter ratio and sucker dry matter ratio (Sr) values were calculated as the average ratio between the total green leaf area biomass and the total plant biomass, and the average ratio between the selected sucker biomass and the total plant biomass, respectively. Specific leaf area (SLA) values were obtained by dividing the green leaf area and the weight of these functional leaves, measured on the five uprooted plants per variety. Leaf area index was measured 4 weeks after planting (LAI4). The sucker selection threshold (SSt) was forced by field management considerations and dates: in the field experiment, it was done at 5000 dd (degree-days) after planting. According to observations in the field experiment, floral transition was assumed to occur at the same time as sucker selection; thus SSt and floral transition threshold (IF) parameters were assumed to have the same value. Dry matter lost weekly by desuckering was also measured during the field experiment: samples of eliminated suckers were weighed to estimate the Rs parameter. Crop-specific extinction coefficient was estimated from the literature (Nyombi et al. Reference Nyombi, Van Asten, Leffelaar, Corbeels, Kaizzi and Giller2009) and from other export banana models (Tixier et al. Reference Tixier, Malezieux and Dorel2004; Dorel et al. Reference Dorel, Achard and Tixier2008).
For each variety, photosynthetic parameters (PARiopti and P max) were determined from each of the five replicates. Parameters and initial values were set from observations and determined the set of parameters PARiopti and P max that minimized the square differences (SSD) between measured and simulated LAI and vegetative dry matter (DMveg) from planting to flowering. This method, which involved 3000 simulations for each replicate, enabled determination of the five best combinations of photosynthetic parameters (PARiopti and P max) for each variety. The effect of genotype and plantain type on these estimated values of PARiopti and P max was assessed with analysis of variance (ANOVAs) using Microsoft® Excel XLSTAT©.
For each replicate and each variety, the associated combination of parameters was used to test the ability of the model to predict yield elaboration by simulating the bunch biomass associated with each replicate. The model accuracy for a given variety was evaluated by comparing observed and simulated bunch weights and was expressed by the average relative root-mean-square difference (RRMSE) of the five replicates. Finally, to determine the difference among varieties in terms of intrinsic parameters and to identify trends regarding the effect of each parameter on observed yield, a principal component analysis (PCA) was performed on measured and fitted varietal model parameters using the FactoMineR package in R (Kostov et al. Reference Kostov, Bécue-Bertaut and Husson2013). Observed yield and variety were added as complementary variables on the factors map but were not accounted for in the analysis itself.
RESULTS
Model parameters
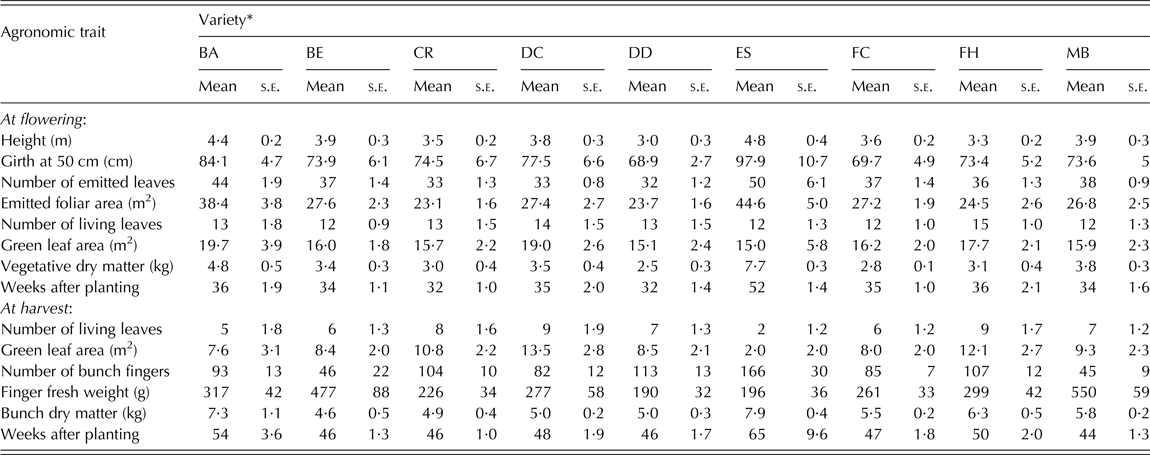
Table 4 presents agronomic data describing the growth, development and yield for each of the nine varieties in the field experiment. Table 5 presents model parameters derived from the data analysis. At flowering, giant real plantain varieties had the highest vegetative dry matter (ES: 7·7 kg and BA: 4·8 kg; average value of 6·3 kg) compared to a maximum value of 3·8 kg (MB) and an average value of 3·2 kg for all other varieties. This trend was also evident in the dimensions of vegetative organs: the average pseudostem of giant real plantain varieties had a height of 4·6 m, a girth of 91 cm and a total emitted leaf area of 41·5 m2, while maximum values for all other varieties were 3·9 m for height (BE, MB), 77·5 cm for girth (DC) and 27·6 m2 for total leaf area (BE). Vegetative organs were larger for real plantains than for plantain-like hybrids: pseudostem height ranged from 3·6 m (FC) to 4·8 m (ES) for real plantains and from 3 m (DD) to 3·8 m (DC) for plantain-like hybrids; girth ranged from 73·9 cm (BE) to 97·9 cm (ES) for real plantains and from 68·9 cm (DD) to 77·5 cm (DC) for plantain-like hybrids; and emitted leaf area ranged from 26·8 m2 (MB) to 44·6 m2 (ES) for real plantains and from 23·7 m2 (DD) to 27·4 m2 (DC) for plantain-like hybrids. The number of emitted leaves was proportional to the height and ranged from 32 (DD) for the smallest variety to 50 (ES) for the highest. Values for Lr, SLA, LAI4 and Sr were determined by analysing these data for each variety: Lr ranged from 0·21 (ES) to 0·69 (DD); excluding MB, Lr values were smaller for real plantains than for plantain-like hybrids (the average values were 0·39–0·58, respectively). Specific leaf area ranged from 6·95 m2/kg (MB) to 19·24 m2/kg (ES), while LAI4 ranged from 0·016 m2 (ES) to 0·029 m2 (DD); LAI4 values were smaller for giant real plantain varieties and for those with long crop cycles (ES, BA and FH) than for other varieties. Finally, Sr ranged from 0·05 (MB) to 0·25 (ES).
Means and standard errors (s.e.) of major agronomic data of the nine varieties at flowering and harvest

* See Table 1 for explanation of the variety codes.

At harvest, giant real plantain varieties had heavier bunches (expressed as dry matter) than all other varieties (ES: 7·9 kg and BA: 7·3 kg; average value of 7·6 kg); the average value of all other varieties was only 5·3 kg. Among real plantains, giant varieties produced heavier bunches than other varieties (the average weight for FC, MB and BE bunches was 5·3 kg). Excluding giant varieties, plantain-like hybrids and real plantains had the same average value of 5·3 kg for bunch weight. Number of fingers per bunch ranged from 45 (MB) to 166 (ES); the two False horn varieties had fewer fingers (the average for MB and BE was 45·5) than all other varieties (the average was 107). Finger fresh weights were inversely proportional to number of fingers per bunch: False horn varieties had the highest values (MB: 550 g and BE: 447 g), while for the other varieties of real plantains, the average was only 258 g and the heaviest finger weighed only 317 g (BA). The giant real plantain ES had the smallest value for finger fresh weight (196 g).
Plantain-like hybrids had an average green leaf area of 24·7 m2 at flowering and 11·2 m2 (45%) at harvest. Green leaf area for real plantains was 32·9 m2 at flowering and only 7·1 m2 (24%) at harvest. The plantain-like hybrid FH had the highest percentage of green leaf area (49% of 17·7 m2), while the giant real plantain ES had the lowest percentage (4% of 15 m2). The number of living leaves had a similar trend and clearly differed between real plantains and plantain-like hybrids: the number ranged from 12 (BE) to 15 (FH) at flowering and from 2 (ES) to 9 (FH, DC) at harvest. Analysis of foliar data enabled determination of the leaf death ratio parameter, LDr, for each variety. It ranged from 0·04 (CR, DC) to 0·1 (BA); LDr values were higher for real plantains than for plantain-like hybrids (the average values were 0·09 to 0·05, respectively).
The length of the crop cycle was represented by the number of weeks from planting to flowering and from planting to harvest. Among all nine varieties, flowering occurred from 32 (CR, DD) to 52 (ES) weeks after planting, and harvest occurred from 44 (MB) to 65 (ES) weeks after planting. Conversion of length of crop cycle into dd allowed calculation of the parameters PFd and FHd for each variety: PFd ranged from 5914 dd (DD) to 9538 dd (ES) and FHd ranged from 2028 dd (MB) to 3308 dd (BA).
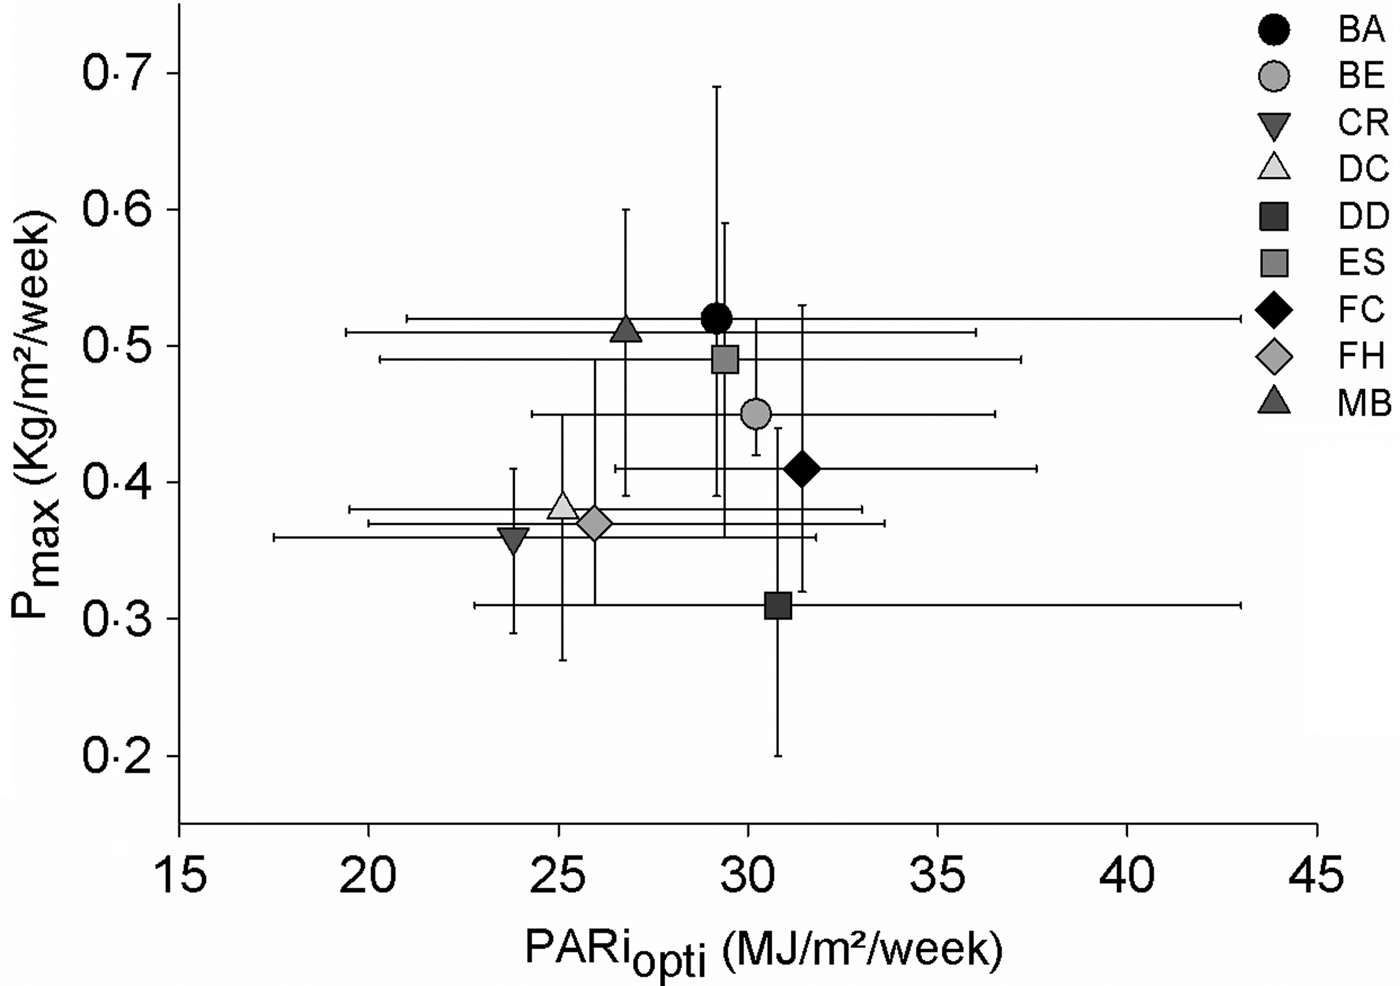
Table 5 also presents the photosynthetic parameters PARiopti and P max as estimated from the model: PARiopti ranged from 23·81 MJ/m2/week (CR) to 31·42 MJ/m2/week (FC), while P max ranged from 0·33 kg/m2/week (DD) to 0·51 kg/m2/week (MB). Real plantains (BA, BE, ES, FC, MB) and plantain-like hybrids (CR, DC, DD, FH) formed two distinct groups (Fig. 2), i.e. for a similar level of PARi, P max values were higher for real plantains than for plantain-like hybrids. Analysis of variance confirmed that PARiopti (F 1,43 = 4·65; P < 0·05) and P max (F 1,43 = 31·59; P < 0·001) values were significantly higher for real plantains than for plantain-like hybrids. Among real plantains, PARiopti (F 1,23 = 0·56; P = 0·461) and P max (F 1,23 = 0·11; P = 0·740) values did not differ significantly.
Model evaluation of PARiopti and P max values for the nine varieties (described in Table 1). The central point is the average value simulated for the field experiment replicates. Error bars show the range of simulated values. Real plantains (BA, BE, ES, FC and MB) and plantain-like hybrids (CR, DC, DD and FH) formed two distinct groups. See Table 1 for explanation of variety codes.

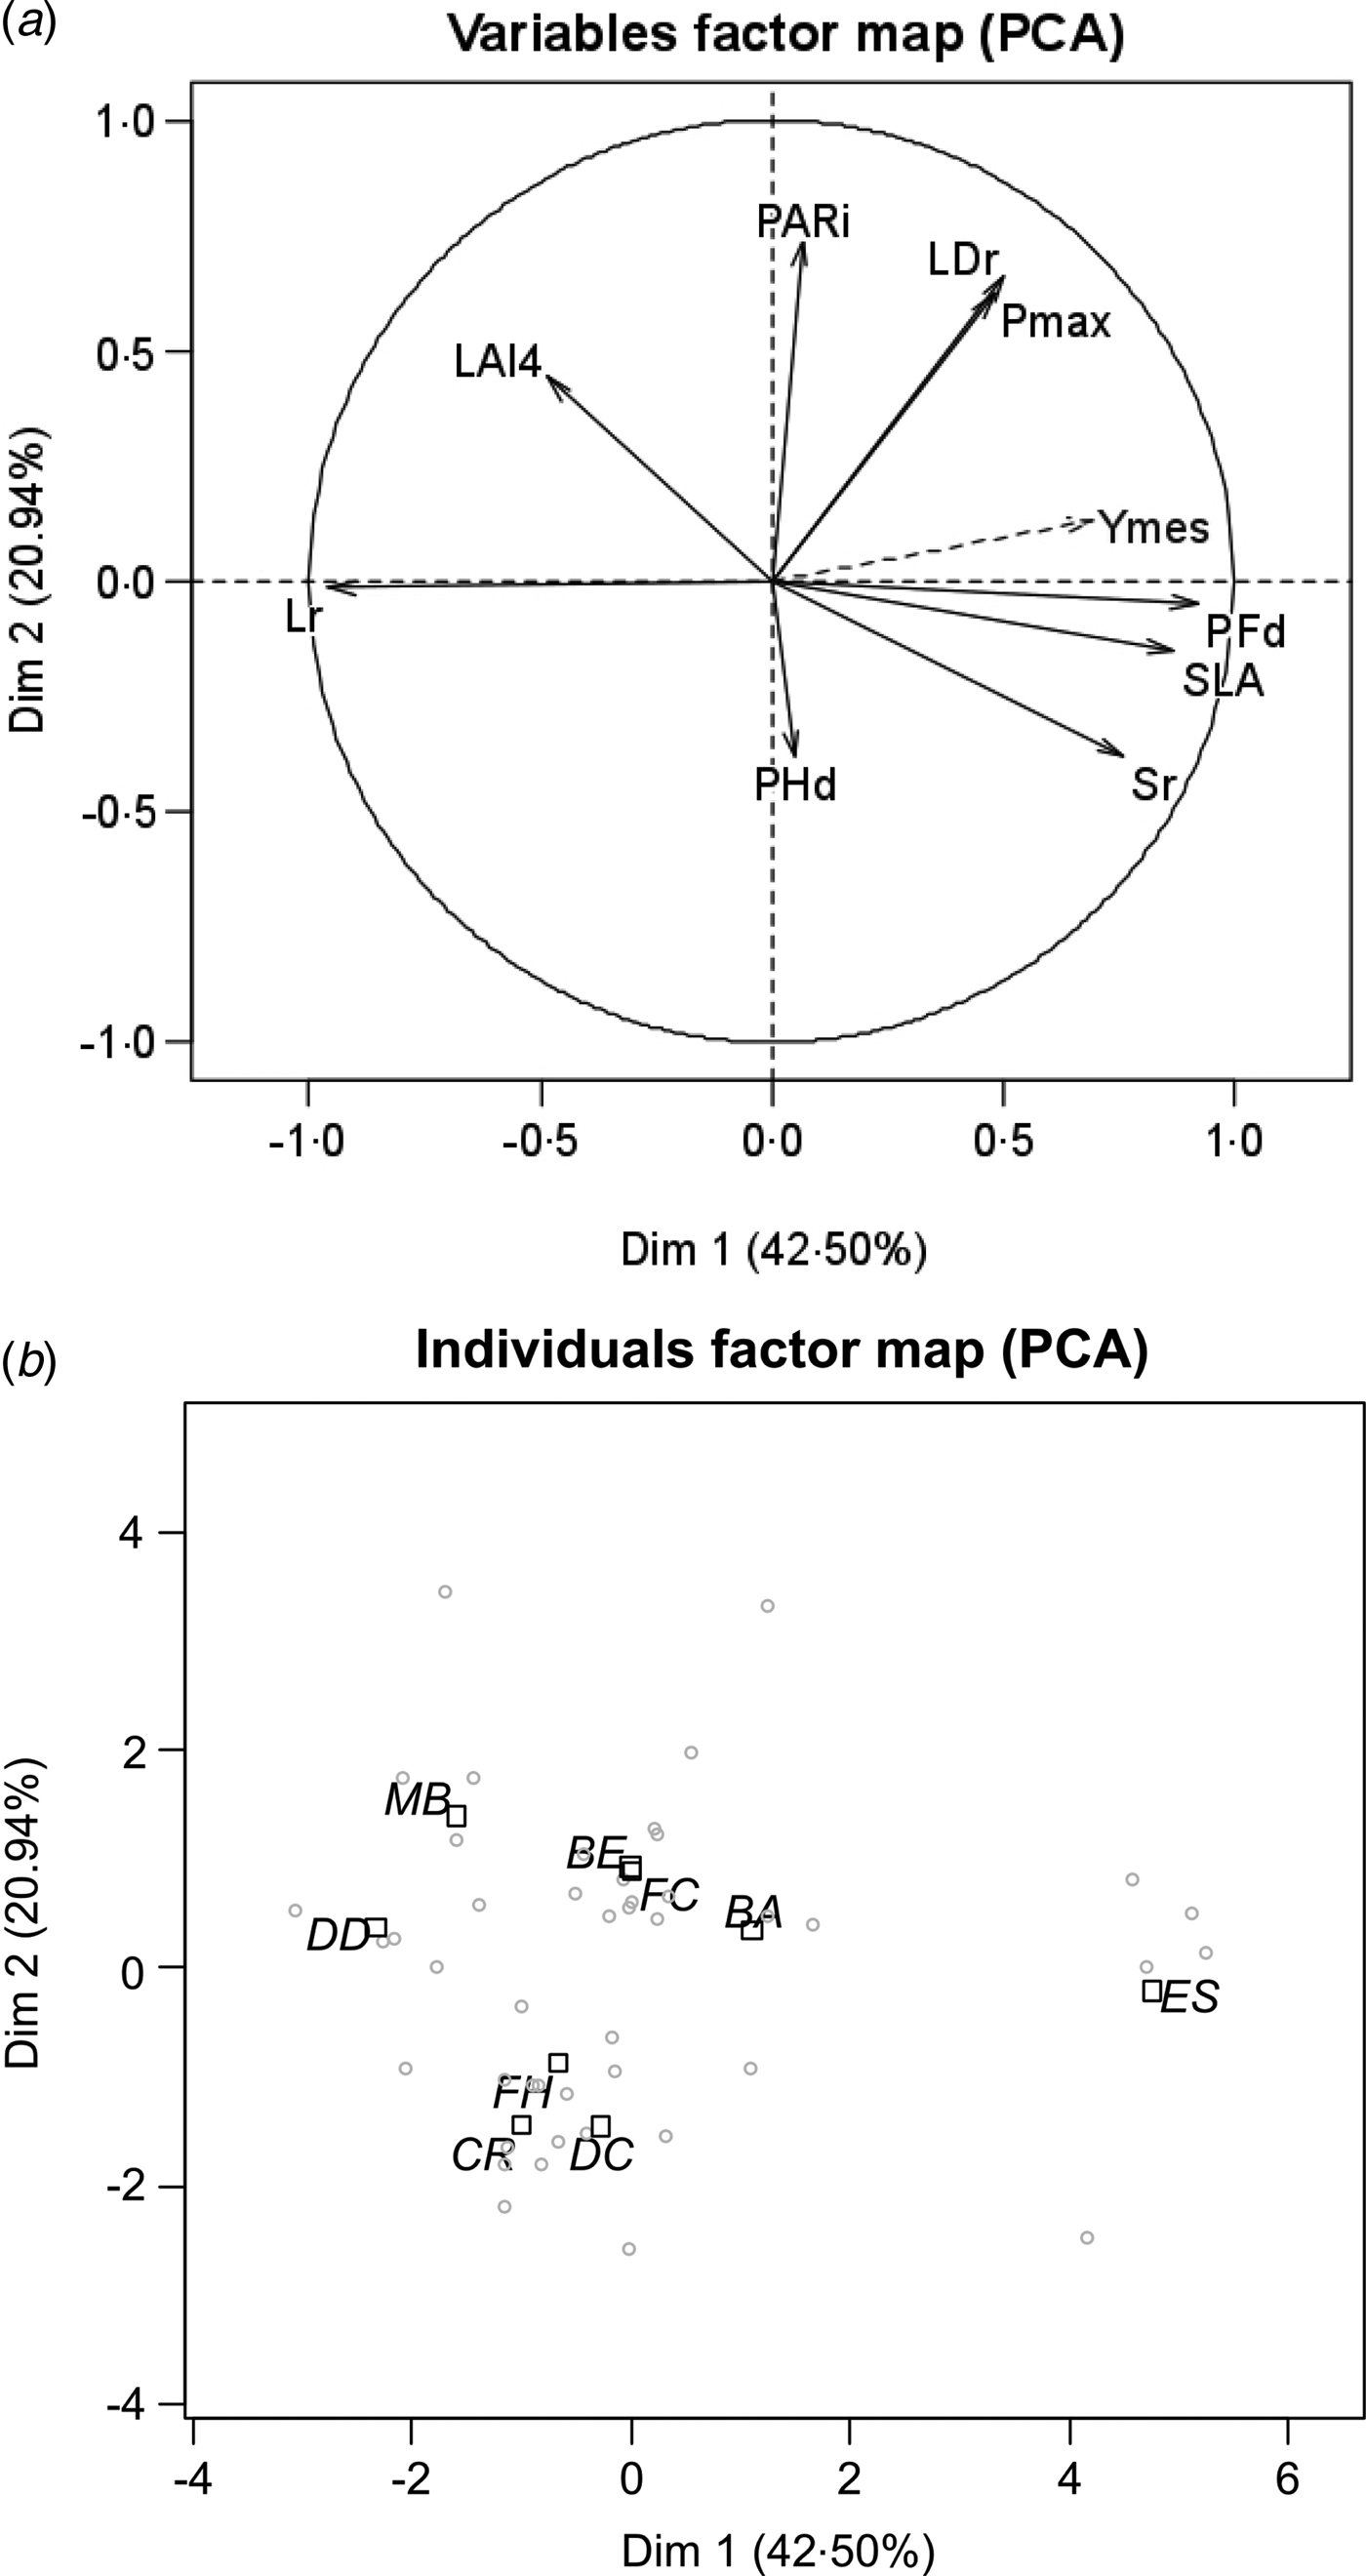
In the PCA analysis, the first two axes explained 63·44% of the variability of parameters between varieties and replicates (Fig. 3(a)). The first axis (42·50%) was primarily associated with parameters PFd and SLA (positive effects) and Lr (negative effect), and was less strongly associated with Sr (positive effect). The second axis (20·94%) was associated with PARi (positive effect) and less strongly with PHd (negative effect). P max and LDr were equally and positively associated with both axes 1 and 2. The parameter LAI4 was positively associated with the first axis and negatively associated with the second axis. The position of the measured yield in the variables factor map showed that the yield was mainly and positively associated with the first axis. On the individual factor map (Fig. 3(b)), three groups were evident: real plantain ES was positively described by the first axis but was clearly different from the other varieties; real plantains except for variety ES (BA, BE, FC and MB) and plantain-like hybrids except for variety DD (CR, DC and FH) were separated by the second axis and were positively associated with that axis in the case of real plantains and negatively associated with that axis in the case of plantain-like hybrids.
Principal Component Analysis of the parameters of the nine varieties (described in Table 1) with (a) the variables factor map for model parameter axes 1 and 2, and (b) the position of varieties on the individuals factor map for axes 1 and 2. The dotted arrow shows measured yield. The grey dots indicate measured yield for each replicate. Interestingly, measured yield was strongly associated with both phenological (PFd) and structural (SLA and Lr) parameters. See Table 1 for explanation of variety codes.

Model evaluation
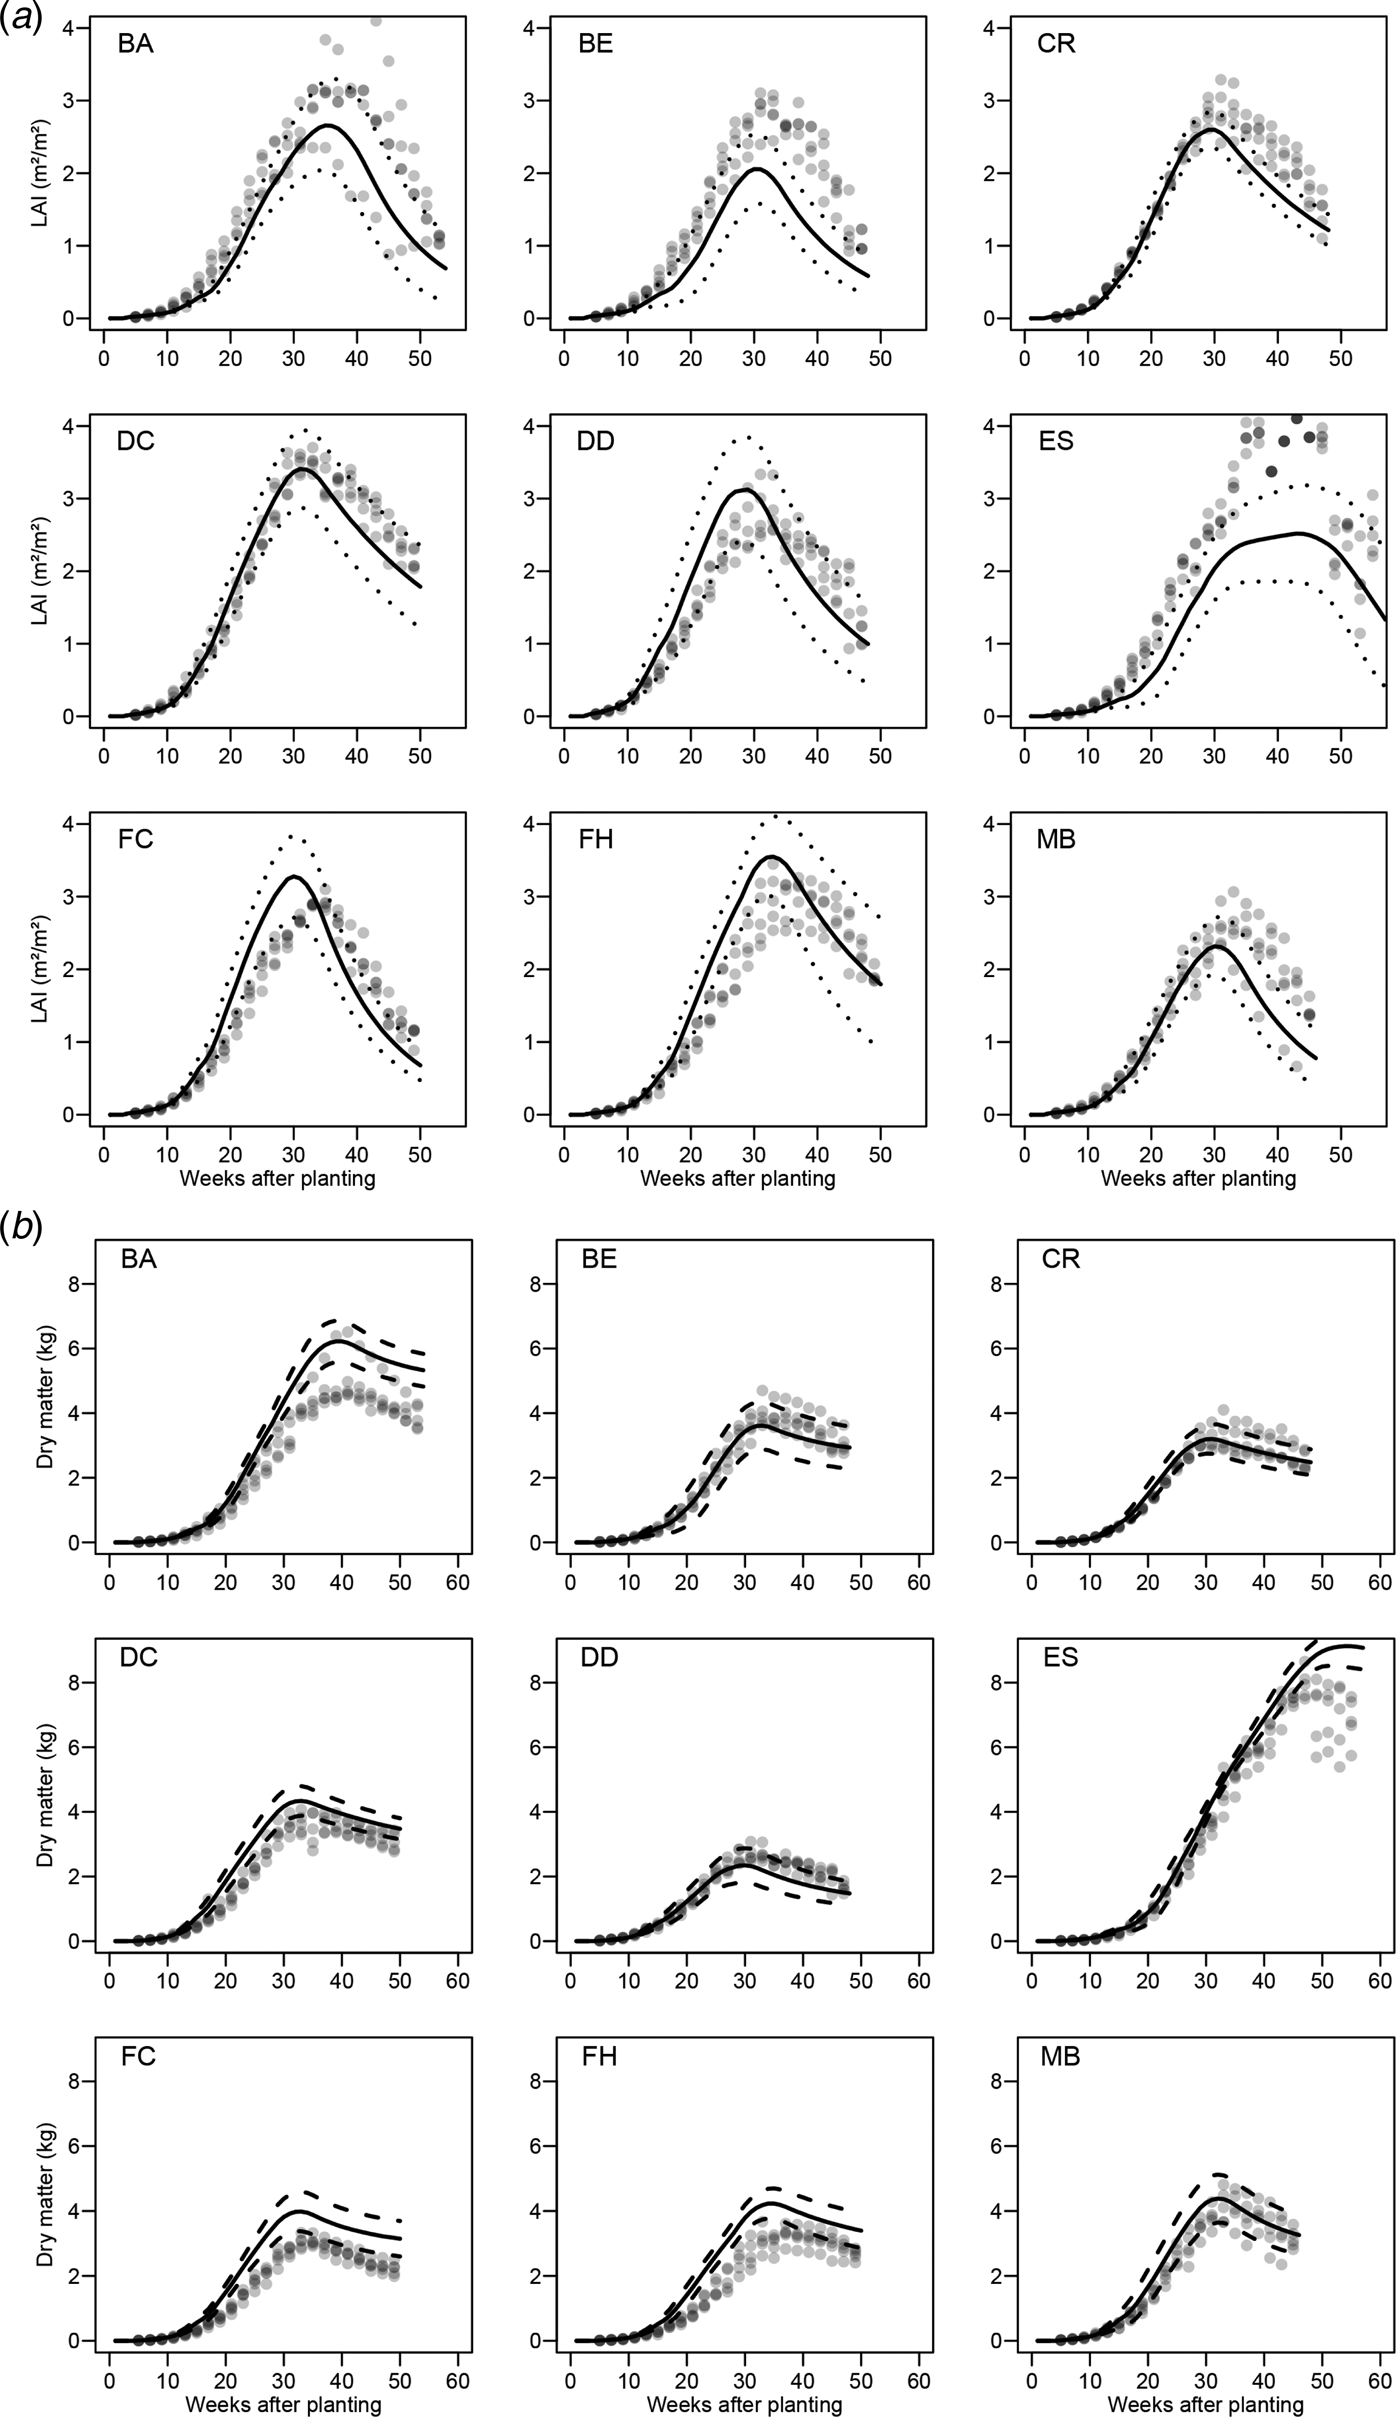
The first model evaluation compared measured and simulated values of the variables DMveg and LAI. Figure 4(a) presents measured and simulated values for the variable LAI. Overall, the model correctly described the measured LAI trend. This was especially true before the 30th week: for varieties CR, DC and MB, simulated values were close to measured values; for varieties BA, BE and ES, simulations were slightly above measured values; and for varieties DD, FC and FH, simulations were slightly below measured values. After the 30th week, the model tended to underestimate LAI values. The measured values for varieties BA and ES had high variability after the 30th week, which was also demonstrated by the standard errors in Table 4. Figure 4(b) presents measured and simulated values for the variable DMveg. Overall, the model better represented DMveg than LAI. Simulated vegetative dry matter for varieties BE, CR, DD and MB were similar to measured values while simulated values were lower than measured values for varieties BA, DC, FC and FH. Nevertheless, the measured trend in DMveg was always well represented by the simulated data, except for variety ES.
Simulated and measured values per week for (a) leaf area index (LAI) and (b) vegetative dry matter (DMveg) for the nine varieties (described in Table 1). Full curves represent mean simulated values, and dotted lines represent the range of simulated values. The grey dots represent values measured in the field experiment (each point represents one replicate of a given variety, with nine plants per replicate).

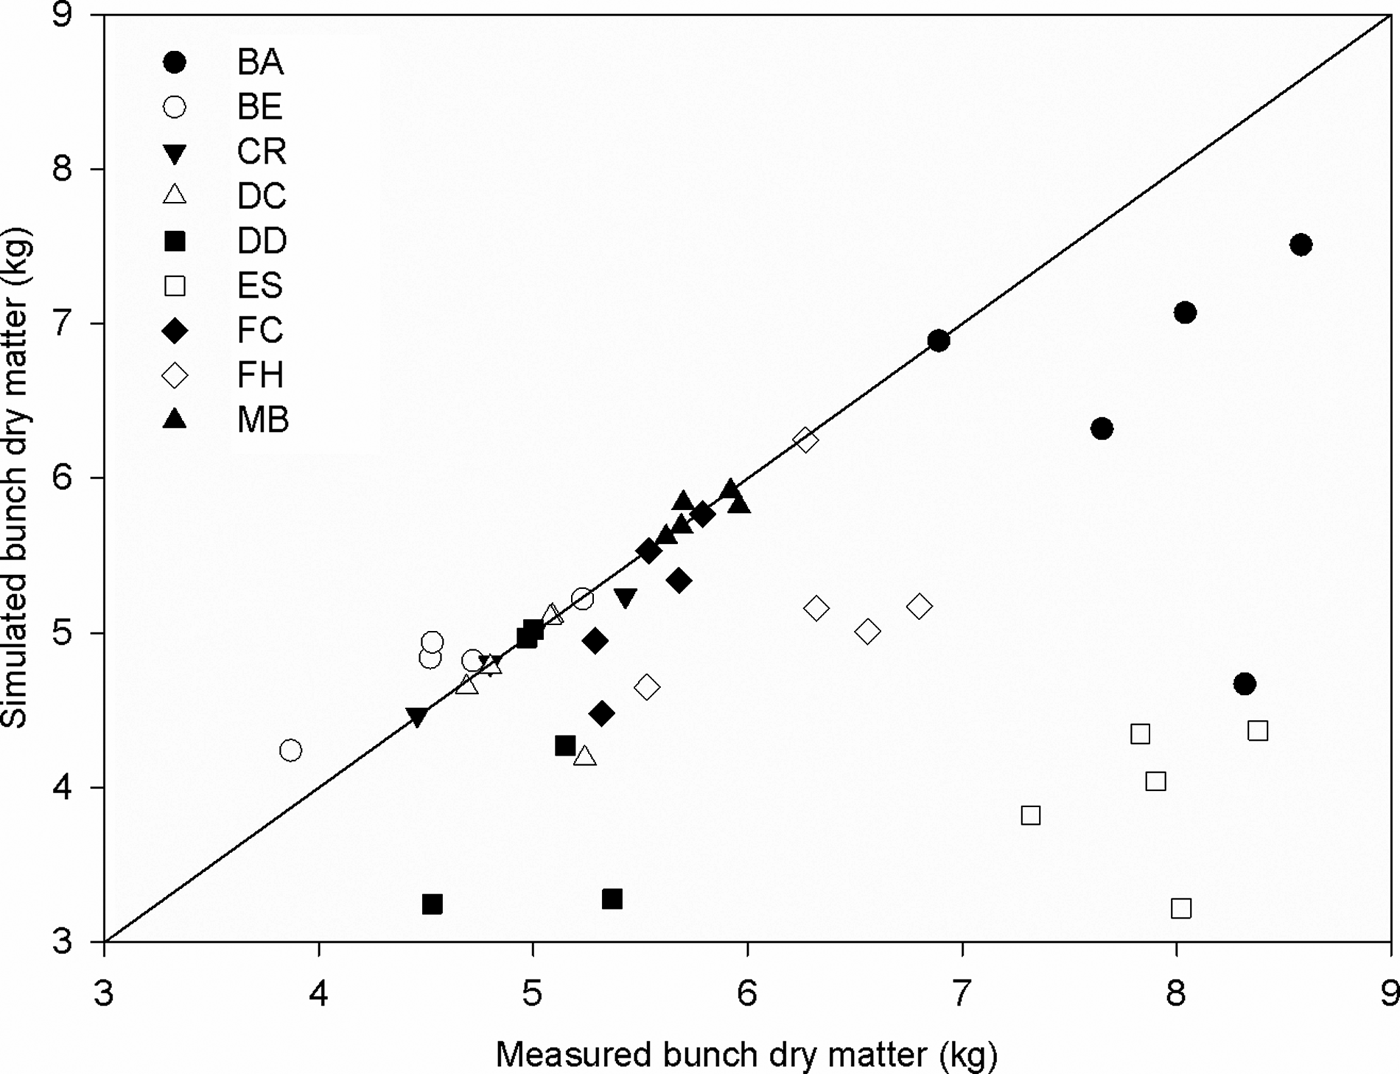
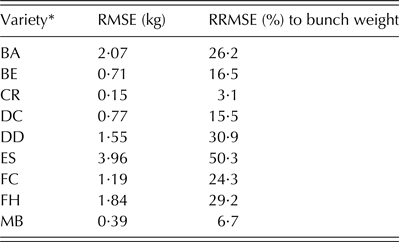
The second evaluation assessed the predictive capacity of the model. This evaluation compared simulated and measured bunch weights, expressed in dry matter. Figure 5 presents measured and simulated bunch weights at harvest for each variety and each replicate of the field experiment. Measured bunch weights ranged from 3·87 kg (BE) to 8·32 kg (BA), with an average value of 5·87 kg. Simulated bunch weights ranged from 3·22 kg (ES) to 7·51 kg (BA), with an average value of 5·03 kg. Simulated values were close to measured values for varieties BE, CR, DC, MB and FC. Except for variety BE, the model generally underestimated bunch weights; this error was particularly evident for variety ES and for some replicates of varieties BA, DD and FH. The relative error of prediction of bunch weights (RRMSE) ranged from 3·1% (CR) to 50·3% (ES) (Table 6).
Observed and simulated bunch weights, expressed in kilograms of dry matter, for the nine varieties (described in Table 1). Each dot represents a replicate (nine plants per replicate), and each coloured symbol represents a variety in the field experiment. The model was accurate to predict the bunch dry matter for BE, CR, DC, MB and FC. Inversely, the prediction was clearly underestimated for the giant variety ES. See Table 1 for explanation of variety codes.

Root-mean-square error (RMSE) and relative root-mean-square error (RRMSE) of measured compared with simulated bunch weights expressed in kilograms of dry matter and in the percentage of measured bunch weights. The model was accurate (CR and MB) and weak (ES and DD), independently to their genome (real plantains or plantain-like hybrids)

* See Table 1 for explanation of the variety codes.
DISCUSSION
Model parameters
The field experiment enabled a direct evaluation of parameters that describe the growth, development and yield elaboration of five real plantain varieties and four plantain-like hybrids. Using the data from the field experiment, varieties were compared both between and within the groups. Among the real plantains, giant varieties had larger dimensions for all organs (bulb, pseudostem, leaves and bunch), leading to greater bunch biomass relative to that of smaller varieties. The giant varieties, however, have longer crop cycles, which reduce their annual yield potential. Average bunch weights did not differ significantly among real plantain types, but number of fruits and fruit weights clearly differed between False horn and French varieties, i.e. False horn varieties had half the number of fruits but twice the fruit weight of French varieties. The between-variety variability of these observations are consistent with previous reports of relatively high levels of plantain diversity (Osuji et al. Reference Osuji, Okoli, Vuylsteke and Ortiz1997; De Cauwer & Ortiz Reference De Cauwer and Ortiz1998; De Langhe et al. Reference De Langhe, Pillay, Tenkouano and Swennen2005). The comparison of agronomic parameters between real plantains and plantain-like hybrids reflects breeding choices. The most significant difference concerns the duration of leaf area: although total emitted leaf area was greater for real plantains, green leaf area at flowering and at harvest was greater for plantain-like hybrids. This is consistent with the fact that these plantain-like hybrids were selected primarily for their resistance to Black Sigatoka (Tomekpe et al. Reference Tomekpe, Kwa, Dzomeku and Ganry2011; Irish et al. Reference Irish, Goenaga, Rios, Chavarria-Carvajal and Ploetz2013; Ortiz Reference Ortiz2013). Higher green leaf area at flowering and at harvest reflects this resistance to foliar diseases well. However, in the conditions of the current experiment, the higher green leaf area of plantain-like hybrids did not lead to heavier bunches. The chemical control of pest and diseases (especially Black Sigatoka) masked the advantage of resistant hybrids that produced bunches of similar weight compared with real plantain varieties, although leaf number at flowering and harvest of the plantain-like hybrids were significantly greater.
Although the robustness of parameter estimation could be increased by conducting additional experiments in different locations, only two parameters were estimated by fitting in the current study. All others were measured directly, which reduced the uncertainty in parameter estimation. The model revealed substantial differences in values of PARiopti and P max among varieties. Given a similar radiation level and near-optimal cropping conditions in the present study, photosynthetic efficiency was higher for real plantains than for plantain-like hybrids. This significant difference between real plantains and plantain-like hybrids was highlighted in the ANOVA and PCA analysis. It is possible to clearly separate these two genotypes on the second axis of the PCA, an axis that was associated with parameters concerning photosynthetic efficiency and crop cycle length. Together, the results suggest that real plantains have a higher production potential than plantain-like hybrids, partly because they are better able to convert radiation into dry matter. This result is consistent with the hypothesis that the quantity of the balbisiana genome in a cultivar increases its drought tolerance and its ability to convert radiation into dry matter (Simmonds Reference Simmonds1966; Thomas et al. Reference Thomas, Turner and Eamus1998). Nevertheless, the current results also suggest that plantain-like hybrids could be more suitable than real plantains for conditions of lower light or partial shade. Few publications, however, have addressed this point. Although studies on real plantains (Norgrove & Hauser Reference Norgrove and Hauser2002) and plantain-like hybrids (Hauser Reference Hauser2010) have concluded that shade reduces growth, the shade tolerance of real plantains v. plantain-like hybrids has not been studied. Finally, the PCA analysis of the model parameters showed that plantain yield involved the interaction of most parameters, which indicates the importance of considering all of the processes affecting yield elaboration and crop performance. Length of the crop cycle and leaf area dry matter ratio were strongly linked to yield, indicating that the maintenance of green leaf area after flowering, i.e. when leaf emission stopped, positively affects yield. The importance of PARiopti and P max also suggests that the efficiency of converting intercepted radiation into dry matter should be considered in benchmarking of the potential production of plantain varieties. Because the method put forward on the current paper for determining LDr and photosynthetic parameters PARiopti and P max is time consuming, it would be useful to find alternative methods to determine these photosynthetic parameters.
AAB model representativeness
Three groups of varieties can be distinguished in terms of the ability of the AAB model to predict bunch biomass: the fit was accurate for varieties CR and MB, good for varieties BE, DC and FC, and mediocre for varieties BA, DD, ES and FH. In the group with accurate fit (with RRMSE < 6·7%), the error was < 0·2 kg of dry matter per bunch through all replicates; there was very good agreement between observations and simulations of leaf area index and vegetative dry matter at each observation date. In the group with good fit (15·5% < RRMSE < 24·3%), either leaf area index or vegetative dry matter were simulated correctly. In the group with mediocre fit (RRMSE > 25%), there was globally a poor agreement between observations and simulations of leaf area index and vegetative dry matter. This last group contained mostly giant real plantain varieties (ES, BA), long crop cycle varieties (ES, BA and FH), and the plantain-like hybrid DD. The poor results obtained for this group might have several possible explanations. The first is that the dry matter reallocation processes during the reproductive period were described too simply in the AAB model. Indeed, it is suspected that giant varieties, according to the large dimensions of their organs, are able to reallocate much more dry matter to the bunch than varieties with smaller organs (Nyombi et al. Reference Nyombi, Van Asten, Leffelaar, Corbeels, Kaizzi and Giller2009). This explanation would be consistent with the supposed resilience of giant varieties and their potential to produce similar bunch weight regardless of cropping conditions. Research is needed to increase understanding of the reallocation processes and source–sink relationships in small, medium and giant plantain varieties. The second possible explanation is that floral transition was weakly accounted for in the AAB model. Because floral transition is very difficult to determine based on morphological observations only (Barker & Steward Reference Barker and Steward1962; Ganry Reference Ganry1980), it would be valuable to develop a new method for determining this crucial stage. Future models dedicated to plantains, especially for giant varieties, should include more processes of remobilization of assimilates among plants organs, e.g. from pseudostem to bunch. More ecophysiological studies are needed to fill gaps of knowledge on these processes.
Increasing capacity to benchmark plantain varieties
The AAB model is a first step towards developing a tool to help farmers design more productive plantain-based cropping systems. Integrating morphologic and agronomic parameters allowed an estimation of their contributions to yield elaboration and highlighted the major roles of photosynthetic efficiency and maintenance of leaf area. To improve the ability of the AAB model to assess plantain varieties in diverse cropping systems and under different environmental conditions, a better understanding of the following is required: dry matter allocation as a function of variety size; time of floral transition; the basal temperature (temperature threshold below which the plant phenology is stopped); and growth and yield responses to temperature, fertilization and drought. The assessment and comparison of plantain varieties would be facilitated by determining the relationships between traits and functions linked to growth and development. Such a ‘functional traits’ approach (Damour et al. Reference Damour, Dorel, Quoc, Meynard and Risède2014) should enable researchers to more rapidly estimate some model parameters or to directly assess some functions linked to agronomic performance. For instance, it would be valuable to assess photosynthetic conversion parameters through simple measures (e.g. pigment concentration). Similarly, it would be valuable to identify functional traits associated with pest and disease tolerance.
The great diversity of plantains is an important advantage for farmers who attempt to select varieties that fit their climatic conditions, markets and local habits. The present study highlights the value of modelling for characterizing and utilizing this diversity.
The authors wish to especially thank the EcoPlantain team for their rigorous and patient observations of the 405 plantains monitored twice a month during more than 2 years in this experiment: Médard Talla Djomessi, Frédéric Tchotang, David Essome Ngando, Désirée Fofack, Jean-Désiré Namachoï, Jean-Pierre Ebongue, and many other CARBAP staff who contributed. The authors also thank Bernard Kengni and his team for technical support. This study, which is part of the agronomic collaborative CARBAP-CIRAD EcoPlantain project, was co-financed by CIRAD and CARBAP core budgets.