


Orthographic codification can be defined as a unique arrangement of letters that defines a written word, as well as other general aspects of writing such as the dependencies in the word sequence or the letter position (Tanzman, 1984, cited in Castles & Nation, Reference Castles, Nation and Andrews2006). In accordance with Perfetti (Reference Perfetti, Gough, Ehri L. and Treiman1992), skilled processing implies acquiring fully specialized orthographic representations so that the context is unnecessary to recognize specific words. It is a highly automatized process and cannot be consciously subjected to strategic control. These characteristics allow the reader to provide more attentional resources to other reading aspects such as text significance (Ehri, Reference Ehri1995). The orthographies of different languages are classified on the basis of the complexity of their letter (or logograph) to sound correspondence. According to this there are languages with shallow orthographies, in which the phonemic and orthographic codes are isomorphic, and the phonemes of spoken words are represented by graphemes in a simple and direct way (Frost, Katz, & Bentin, Reference Frost, Katz and Bentin1987). In languages with deep orthographies this relation is more opaque, and the same letter may represent different phonemes in different words (Frost et al., Reference Frost, Katz and Bentin1987). This orthographic difference affects lexical access: while in English is mediated by both phonemic and orthographic codes, in more shallow languages the readers tend to use phonemic codes to recognize the words (Frost et al., Reference Frost, Katz and Bentin1987). Orthographic consistency and its corresponding instructional regime could lead to the adoption of different reading strategies across languages based on visual or whole word recognition in deep orthographies and on phonological recognition in shallow ones (Wimmer et al., Reference Wimmer, Schurz, Sturm, Richlan, Klackl, Kronbichler and Ladurner2010). Spanish, like Dutch, Italian and German, is considered a language with a regular orthography, thanks to their regular orthography, children can easily acquire phonological recoding strategies given the high feed-forward consistency between spelling and phonology (Ziegler & Goswami, Reference Ziegler and Goswami2006).
The visual word form Area (VWFA) or occipitotemporal area (OT), where the fusiform and lingual gyri stand out, has been linked to the orthographic analysis of words. Activations have been reported in the left hemisphere’s fusiform gyrus when faced with words in tasks requiring relatively simple manipulation or processing, such as visual priming (Glezer et al., Reference Glezer, Jiang and Riesenhuber2009), lexical decision (Cohen et al., Reference Cohen, Lehéricy, Chochon, Lemer, Rivaud and Dehaene2002), or decision on the morphological structure of words (Binder, Medler, Westbury, Liebenthal, & Buchanan, Reference Binder, Medler, Westbury, Liebenthal and Buchanan2006; Kronbichler et al., Reference Kronbichler, Klackl, Richlan, Schurz, Staffen, Ladurner and Wimmer2009). Nevertheless, this area is also activated by perception and naming visual objects and in the processing of several other kinds of stimuli, and therefore its specialization in reading has been questioned (Price and Devlin, Reference Price and Devlin2003).
Just as posterior occipital-temporal brain areas are related to a first level of orthographic processing, the long-term orthographic representations are related to bilateral inferior frontal brain areas, concretely the inferior frontal gyrus (IFG) (Richards et al., Reference Richards, Aylward, Berninger, Field, Grinme, Richard and Nagy2006). Dorsal portions of the left IFG (Brain Area BA 44/45) have been classically related to phonological processes, and their ventral portions (BA 47/45) are more related to semantic processing (Poldrack et al., Reference Poldrack, Wagner, Prull, Desmond, Glover and Gabrieli1999; Vigneau et al., Reference Vigneau, Beaucousin, Herve, Duffau, Crivello, Houde and Tzourio-Mazoyer2006). Nevertheless, several works have been linked the left and right inferior frontal giri to orthographic processing, in addition to phonology and semantics. The work by Booth, Cho, Burman, and Bitan (Reference Booth, Cho, Burman and Bitan2007) showed that, in a task in which the participants had to decide if two spoken words had the same spelling for the rhyme, the conditions with conflicting phonology and orthography were associated with greater activation in the left inferior frontal gyrus (Booth et al., Reference Booth, Cho, Burman and Bitan2007). The work by Richards et al. (Reference Richards, Berninger and Fayol2009) suggests that good spellers activated the left precentral gyrus, the postcentral gyrus, the left inferior frontal gyrus and the right superior frontal gyrus more than the poor spellers in a task where the subjects had to decide if both words in different pairs of words were both correctly spelled. In the work by Newman and Joanisse (2011), the participants were asked to perform several lexical decision tasks, and the authors manipulated the possible reliance on orthography by varying the degree on which non-word stimuli were more or less orthographically typical. They used four different stimulus types: Low-frequency homophones, high-frequency homophones, non-homophonic control words, and pseudowords. The authors of the study also controlled the possible effects of word-likeness on phonological activation. To control it, both pseudohomophones and pseudowords may possess word bodies typical of English orthography, a condition named by the authors’ as word-like context, or may not possess it (non-word-like context). In addition all stimuli on word-like context resembled phonologically English words (e.g., pseudohomophones such as HEET, and pseudowords such as GEET) (Newmann & Joanisse, 2011). Their results suggested that pseudohomophones in the word-like context, that shared a high degree of similarity to low-frequency words produced greater activations relating to non-words in the precentral gyrus and in left inferior frontal gyrus (BA 44 and BA 47). Other works that studied the effect of word regularity in Chinese reading, suggest that the different IFG areas contributes in orthographic to phonological conversion (Peng et al., Reference Peng, Ding, Perry, Xu, Jin, Luo and Deng2004), and other works using rhyming and spelling tasks also pointed out the role of the parts opercularis of the left IFG in the orthographic and phonological integration (Bolger et al., Reference Bolger, Hornickel, Cone, Burman and Booth2008).
Also, as we stated before, some works suggested that orthographic processing could activate both left and right IFG. The work by Edwards, Pexman, Goodyear, and Chambers, (2005), that used a similar methodology than the study of Newmann and Joanisse (Reference Newmann and Joanisse2001), suggests that the processing of pseudohomophone words largely activated the bilateral inferior frontal gyri, when compared to the tasks in which the subjects were asked to process consonant strings or pseudowords. Similar results were observed in the work by Zhan, Yu, and Zhou, (2013), in which the participant’s had to perform several lexical decision tasks in Chinese language. The authors suggested that the pseudohomophones that shared the first constituent with the base word were they were made activated the bilateral IFG, the left parietal lobule and the left angular gyrus. The work by Richards et al. (Reference Richards, Aylward, Berninger, Field, Grinme, Richard and Nagy2006) suggests that normal children showed significantly greater right inferior frontal gyrus activations in orthographic processing tasks, and the activations of dyslexic children in this area tend to normalize after an orthographic treatment, which consisted in a exposure to polysyllabic real words that contained some spelling units that corresponded to more than one phoneme, or did not correspond to any phoneme (Richards et al., Reference Richards, Aylward, Berninger, Field, Grinme, Richard and Nagy2006).
Taken together, the above mentioned works suggested that the IFG, besides are related to ortographic processing that in some cases may be relatively independent of the phonological and semantic processing. Nevertheless, the majority of the studies previously mentioned have been conducted on deep orthographies. Standard Spanish is a language with a shallow orthography in which however, some phonemes could be mapped onto two or three different letters and in Mexican Spanish, and other additional sounds are also equivalent. For example, the phoneme /s/ matches the graphemes “c”, “s” and “z”; the phoneme /x/ matches the graphemes “x”, “g” and “j”; the phoneme /j/ matches “y” and “ll”; and the phoneme /b/ matches “b” and “v”. Therefore, in Spanish it is relatively common to write pseudohomophones (words with an orthographic error but with the same phonology as the correct one) or to recognize a pseudohomophone as a valid word during reading. For example cilantro [coriander] – is correctly spelled with a “c”, but the general population frequently accepts pseudohomophones such as “silantro” and “zilantro” as valid words. Although these mistakes do not significantly compromise reading comprehension in normal persons, they do cause the speakers of Mexican Spanish, to make numerous pseudohomophone spelling mistakes, something observable in the general population (Gómez-Velázquez et al., Reference Gómez-Velázquez, González-Garrido, Guàrdia-Olmos, Peró-Cebollero, Zarabozo-Hurtado and Zarabozo2014). In fact, in this same study, it was observed that the low spelling skills (LSS) group make three to four times more orthographic errors than the high spelling skills (HSS) group, but both groups present normal reading speed and comprehension indexes (Gómez-Velázquez et al., Reference Gómez-Velázquez, González-Garrido, Guàrdia-Olmos, Peró-Cebollero, Zarabozo-Hurtado and Zarabozo2014). For these reasons, the study of the effect of orthographic processing in Mexican Spanish may be interesting. The majority of the studies cited above is performed in deep orthographies, and as we stated above the differences in orthographic processing may affect word recognition (Frost et al., Reference Frost, Katz and Bentin1987) and reading strategies (Wimmer et al., Reference Wimmer, Schurz, Sturm, Richlan, Klackl, Kronbichler and Ladurner2010). In addition, given that Mexican-Spanish is a shallow language but some phonemes could be mapped onto two or three different letters, we are able to build pseudohomophones that only differ on one letter with their base-word, while, unlike in languages with deep orthographies such as Chinese and English, they share the exact phonology, and the same semantic representation with the correct-written word. This allows us to design an experiment to study the orthographic processing that will differ of those used in the studies described above.
The main objective of the present study was to explore the possible differences in behavior and in brain area activation patterns during the processing of pseudohomophone errors in two groups of people. Both groups were comprised of normal readers, but one presented high spelling skills (HSS) and the other low spelling skills (LSS) because, as we have said, great differences exist in the Mexican population in orthographic recognition between normal readers. Also we aim to do this using a different kind of task that those used in previous studies. We applied two experimental tasks in which the participants were exposed to either words spelled correctly (75% of total stimuli) and words that contain a pseudohomophone orthographic error that was made by the substitution of a single grapheme in the word; the original word always was a high or relatively high frequency word (see Appendix). The substitution of the grapheme preserves the phonology of the original word and the designed pseudohomophone constitutes a relatively common spelling mistake. For this reason the pseudohomophones designed in the present study also preserved the semantics of the original word: (example: for example, ‘sapato’, whose correct spelling is “zapato” [shoe]). In the first task (bloks A and B. named spelling recognition task) the participants were required to indicate whether the word was spelled correctly or else contained a pseudohomophone orthographic error. In block A, 50% of the words were spelled correctly and the remaining 50% contained an orthographic error. In block B, 100% of the words were spelled correctly. In the second task (blocks C and D, named letter-searching task) the participants were instructed to answer whether the word presented contained the vowel “i” or not. 50% of the words of two blocks contained the target bowel. In block C, 50% of the words were spelled correctly and 50% contained a pseudohomophone orthographic error. In block D, 100% of the words were spelled correctly. The experiment contained a total of 80 words (60 spelled correctly and 20 pseudohomophones). All the words were presented only once during the experiment and the pseudohomophones were not made by the modification of the 60 correctly spelled words (see Appendix). The mean frequency of words of every block was controlled and these means did not differ significantly. Thus, we have proposed to study orthographic recognition by means of an explicit and an implicit task. This type of paradigm, which is related to concrete cognitive processing, has been used in other reading-related studies (Brunswick, McCrory, Price, Frith, & Frith, Reference Brunswick, McCrory, Price, Frith and Frith1999; Peng et al., Reference Peng, Ding, Perry, Xu, Jin, Luo and Deng2004).
Accordingly, our main hypothesis is that HSS people would be more efficient when they pay explicit attention to orthographic errors than the LSS people. However, for implicit orthographic recognition, the performance of HSS people would be worse than that of LSS people; as we stated above orthographic processing is an automated ability, and probably it will be true in the case of the HSS participants. For this reason we expect that HSS group makes two tasks, the recognition of a letter and the detection of orthographic error and the LSS only makes the letter-searching task. This is because HSS people have automatized the recognition of orthographic errors and this automation may interfere with a new task in which people only need to recognize whether a letter is present independently from whether the word is spelled correctly or not, an effect similar to the Stroop effect. This effect has been expressed as the existence of a “reader instinct” (Paulesu, Brunswick, & Paganelli, Reference Paulesu, Brunswick, Paganelli, Brunswick, McDougall and de Mornay-Davies2010; Cone, Burman, Bitan, Bolger, & Booth, Reference Cone, Burman, Bitan, Bolger and Booth2008). There is evidence of covert word-processing in tasks in which words where presented for very short periods of time and when these words where not attended (Peng et al., Reference Peng, Ding, Perry, Xu, Jin, Luo and Deng2004). We expect that these described effects of automatization by Peng et al. (Reference Peng, Ding, Perry, Xu, Jin, Luo and Deng2004) and Paulescu et al. (2010) in reading may be observed also on the orthographic processing in the HSS group. Although it should be noted that there are no studies using tasks similar to those we used in our work and therefore this second hypothesis is somewhat speculative. For brain activation, according to Edwards et al. (Reference Edwards, Pexman, Goodyear and Chambers2005), Richards et al. (Reference Richards, Aylward, Berninger, Field, Grinme, Richard and Nagy2006), Booth et al. (Reference Booth, Cho, Burman and Bitan2007), and Zhan et al. (Reference Zhan, Yu and Zhou2013) we hypothesize that the detection of orthographic errors will activate bilateral inferior frontal gyri, and that this effect will be greater in the HSS group. According to our second behavioral hypothesis, HSS people will show similar activations in the implicit and in the explicit task because HSS participants will tend to conduct an involuntary orthographic recognition during the implicit task, while LSS people will not show activation in inferior frontal gyri since their poor orthographic automated skills will impede to conduct involuntary orthographic recognition when they were focused on a letter-searching task.
Method
Participants
Twenty-four young adults (M = 21.83 years, SD =5.02, 10 women) participated in the experiment. They were all pure right-handed, (in all cases the score was +1.0) in accordance with the Edinburgh Handedness Inventory (Oldfield, Reference Oldfield1971), with normal or corrected vision and no history of neurological illness or learning disorder. They all signed an informed consent and received economic compensation for their participation, in accordance with the permission and recommendations of the Ethical Committee of the Instituto de Neurociencias of the University of Guadalajara, Mexico. They were assigned to two groups (High Spelling Skills – HSS, or Low Spelling Skills – LSS) according to their performance on five tasks that assessed their orthographic knowledge, particularly the use of pseudohomophone spelling in words (b-v, c-s-z, g-j, ll-y, h-no h). These tasks involved pseudohomophone spellings, dictation of a letter, dictation of a list of words, detection of pseudohomophone errors in a text, and a free-topic essay. The tasks were applied to all participants prior to the neuroimaging registration to discriminate the participants’ performances. In a previous study, these tasks had presented an adequate reliability value (α = .833) and a very high discriminability capability to distinguish between groups with different orthographic abilities (t = 11.608; p < .001) in a sample of 827 young adults (Gómez-Velázquez et al., Reference Gómez-Velázquez, González-Garrido, Guàrdia-Olmos, Peró-Cebollero, Zarabozo-Hurtado and Zarabozo2014). To be assigned to the HSS or LSS groups, we considered the 15th and 85th percentiles of the total number of errors across all tasks (7 or less, and 31 or more, respectively).
A reading performance test was also applied prior to the neuroimaging studies. It involved reading a 154–word text aloud. The participants were asked to read as fast and accurately as possible and told that they would be asked about the task at the end. Finally, five questions related to the text were scored with 2, 1, and 0 points for complete comprehension, partial comprehension, and misinformation or lack of response, respectively.
Stimuli and procedure
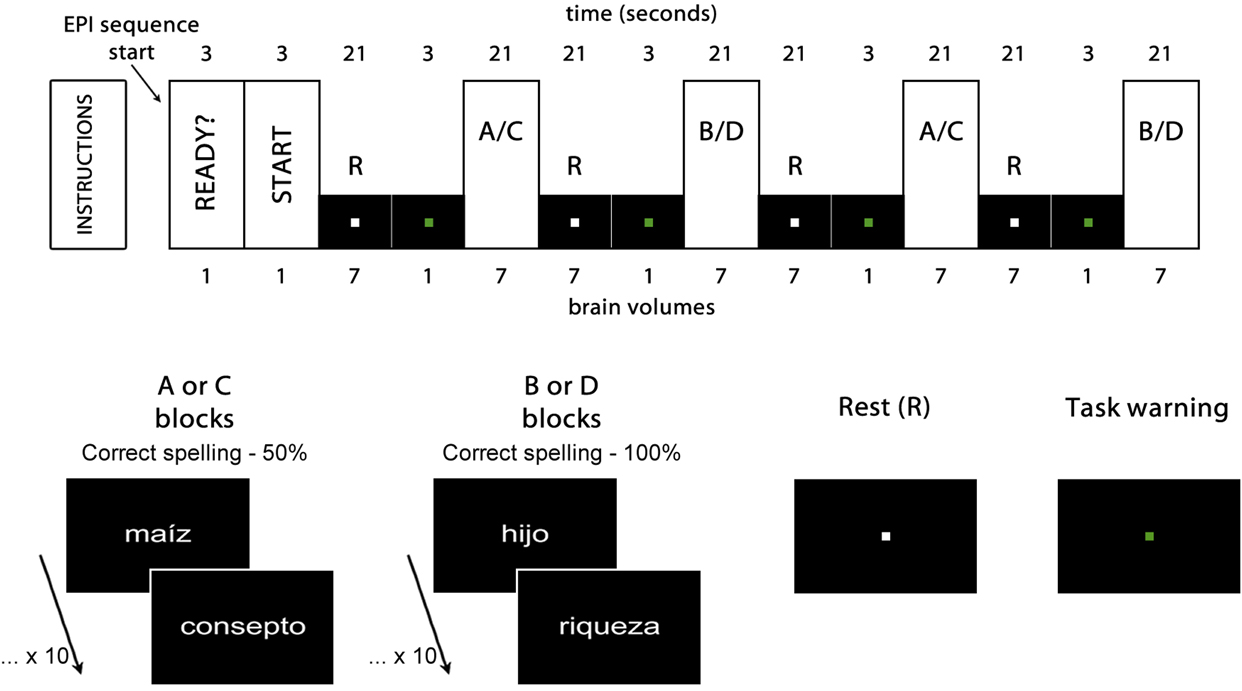
Two experimental tasks were applied in which the participants were exposed to 60 words spelled correctly in Spanish and to 20 words with a pseudohomophone orthographic error (for example, ‘sapato’, whose correct spelling is “zapato” [shoe]). In the first task (blocks A and B, spelling recognition task), the participants were required to indicate whether the word was spelled correctly or else contained a pseudohomophone orthographic error. In block A, 50% of the words were spelled correctly and the remaining 50% contained an orthographic error. In block B, 100% of the words were spelled correctly. In the second task (blocks C and D, letter-searching task) the participants were instructed to answer whether the word presented contained the vowel “i” or not. 50% of the words of two blocks contained the target vowel. In block C, 50% of the words were spelled correctly and 50% contained a pseudohomophone orthographic error. In block D, 100% of the words were spelled correctly. All the stimuli were presented only once during the experiment and the pseudohomophones were not made by the modification of the 60 correctly spelled words (see Appendix). The mean frequency of words of every block was controlled and these means did not differ significantly. Both the stimuli and the interval between them were 1 second long. Both tasks were counterbalanced across all participants. To present them, a block design was used: The stimuli were divided into 8 blocks with 10 stimuli into the blocks and presented pseudo-randomly. The stimuli were presented in white on a black background, with an Arial 60 font and a 300–pixel-per-inch resolution. To control the speed of recognition of very frequent words, the list of stimuli was balanced by using frequent and infrequent words according to the Computerized Lexicon of Spanish, LEXESP (Sebastián, Martí, Carreiras, & Cuetos, Reference Sebastián, Martí, Carreiras and Cuetos2000) and a frequency dictionary designed at our laboratory. The stimuli were presented using E-Prime software (Shneider et al., 2002) through an MR-safe goggle system. The list of stimuli used in this research may be consulted in Appendix.
Our methodology has some strength that should be briefly commented. The participants were selected very thoroughly from among students in their high school senior year or in their first college year, and according to their orthographic performance. The orthographic knowledge tasks administered to form the groups were very exhaustive, which allowed us to form the HSS and LSS groups with great knowledge of the participants’ orthographic competence at the time of inclusion in the study, thus providing us with great intra-group homogeneity regarding their current orthographic skills. Moreover, the HSS and LSS participants showed small differences in the rest of reading skills. Another strength is the fact that this is one of the few papers to explore the patterns of activation of brain areas during the recognition of pseudohomophone orthographic errors by comparing normal (non-dyslexic participants) on a type of orthographic error that is characteristic and exclusive of shallow orthographies.
Image acquisition
GE Excite HDxT 1.5 Tesla equipment (GE Medical Systems, Milwaukee, WI) and an 8–channel head coil were used. For each experimental task, 32 4– millimeterthick (mm) contiguous axial slices were obtained. An echo planar pulse sequence was used with a repetition time of 3 seconds, echo time of 60 milliseconds, 26–centimeter Field of View (FOV), and a 64 x 64 matrix. The voxel size used was 4.06 x 4.06 x 4 mm. From each experimental task, a total of 62 brain volumes were obtained. For reasons of image acquisition time and experimental design, 6 brain volumes per task were discarded (the two first volumes dedicated to a resting state, and four volumes dedicated to advising the experimental procedure initiation), thus leaving a total of 56 for later analysis (Figure 1).
Experimental design. Rest (R) and activation blocks A and B for the spelling recognition task, and C and D for the letter-searching task. The first two brain volumes were eliminated from the analysis, as well as the four task warning volumes. ‘Maíz’ [corn], ‘hijo’ [son] and ‘riqueza’ [wealth] are examples of correctly spelled words. ‘Consepto’ [concept] is an example of an incorrectly spelled word (pseudohomophone), with an s instead of a c, thus generating a pseudohomophone error.
The pre-processing and the statistical analysis of the images were conducted by means of the SPM8 computer package (http://www.fil.ion.ucl.ac.uk/spm/software/spm8/). The images were spatially realigned, readjusted to the voxel size, and normalized according to the Montreal Neurological Institute reference (MNI) –– and Talairach coordinates. For the smoothening, a Kernel Gaussian filter three times the voxel size was used on the x, y, z axes, following the recommendations of the SPM8 preprocessing procedure and in agreement with the results of Farràs, Guàrdia, and Peró, (2015). Based on the analysis of each group in each task, regions of interest were formed by means of the MarsBar software.
Results
Orthographic and reading performances
As mentioned above, we took the 15th and 85th percentiles of total errors in the orthographic tasks as cut-off points to form the HSS group (M = 4.42, SD = 2.11, range = 1–7) and LSS group (M = 42.58, SD = 9.99, range = 32–63).
A significant difference in reading speed was found between the groups (t(22) = 4.24, p < .001, r = .671), with a greater number of words per minute in the HSS group (M = 161.39, SD = 17.70) than in the LSS group (M = 135.42, SD = 11.73). Furthermore, when we considered modifications and omissions, there was a statistically significant difference between both groups (t(22) = 3.22, p < .01, r = .566), with fewer errors observed in the HSS group (M = 3, SD = 2.30) than in the LSS group (M = 7.25, SD = 3.96). Despite the differences observed in reading speed and accuracy, no differences were observed between the groups regarding comprehension (t(22) = 0.52, p = .61), although answers from the HSS group (M = 8.08, SD = 1.31) were slightly more adequate than those from the LSS group (M = 7.75, SD = 1.77).
Behavioral
The behavioral results from the experimental tasks were analyzed to compare the performance between the groups. To that end, several univariate covariance analyses (ANCOVA) were conducted for each dependent variable (number of correct answers and reaction time for each overall response) in relation to a) a comparison of the AB blocks, b) a comparison of the CB blocks, and finally c) the effect of tasks and blocks. The participant’s age was used as a covariate to extract the components caused by that factor. For each analysis, we carried out a factorial design involving orthographic competence (High or Low) as a between-groups factor, while the within-groups factor was the cognitive domain involved in the paired task (spelling recognition or letter-searching for the two first analyses). For the third analysis, two within-groups factors were used: the task (spelling recognition and letter-searching) and the different blocks of percentage of words spelled correctly (50% or 100%). We saved the third analysis to clarify the general effect between conditions. Table 1 shows the relevant statistics and the significance values of raw data for the number of correct responses in each task (detecting the existence of a pseudohomophone error in the spelling task, and detecting the existence of the i vowel in the letter-searching task) and the reaction time for all of the correct responses (yes or no depending on the stimulus). The complete contrast was analyzed according to Crombach’s alpha = .001 after applying Bonferroni correction.
Descriptive statistical results, mean and standard deviation (SD) for the raw number of correct answers and the reaction time for each experimental condition, adding the statistical significances from ANCOVA for each dependent variable*

* only estimated for the second-order interactions for the covariable effects. η 2 are the values of effect size only for significative contrast. 1-β are the power of each significative contrast.
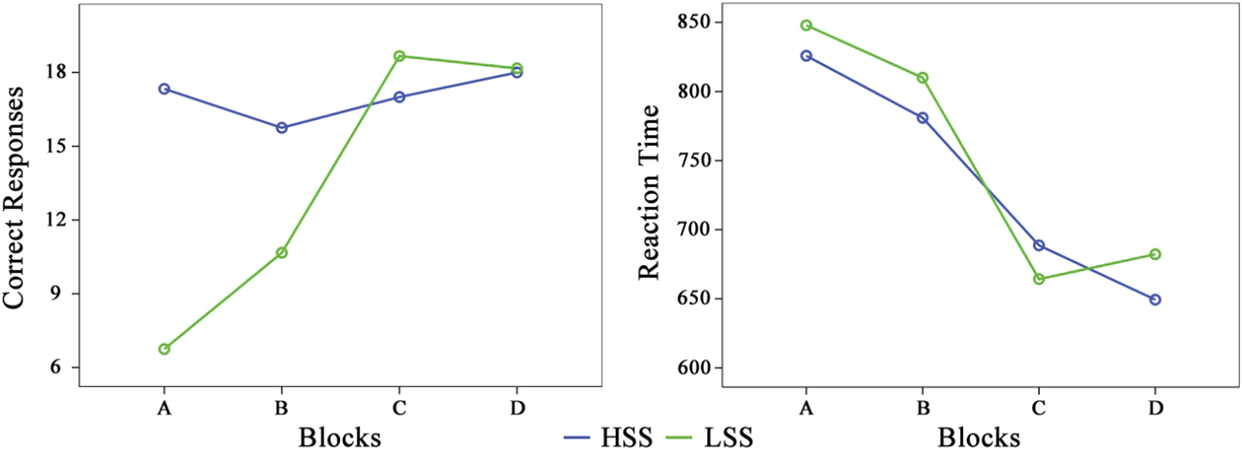
For the spelling task (AB), which involved the number of correct answers, only the group effect was statistically significant (F(1, 21) = 52.72, p < .001, η2 = .715) as well as the first order interaction Blocks x Group (F(1, 21) = 15.64, p = .001, η2 = .427). The HSS group had better results in the A blocks than in the B blocks, whereas the effect was the opposite for the LSS group, but the performance of the HSS is always better than the performance of the LSS. Regarding the reaction time, no source of variation was statistically significant.
In the second analysis, the letter-searching task (CD), regarding the number of correct answers, we found a statistically significant effect for the interaction Blocks x Group (F(1, 21) = 15.35, p = .001, η2 = .422). Therefore the HSS group presented a better performance in the D blocks while the LSS showed a better performance in the C blocks, and in the two blocks the performance of the LSS group is always better than the performance of the HSS group. As for reaction time, the interaction Blocks x Group was also statistically significant (F(1, 21) = 13.71, p = .001, η2 = .395); in the C block, the LSS group was faster than the HSS group, but this effect is contrary to the effect in the D block.
In the third analysis, we included the task (spelling and letter-searching) and the block (50% correctly spelled stimulus and 100% correctly spelled stimulus) as within-group factors, and the group (HSS and LSS) as a between-groups factor, so we conducted a mixed factorial analysis (2 x 2 x 2). As regards the number of correct answers, four of the sources of variation were statistically significant, including the effect associated with the covariable age (F(1, 21) = 2.07, p < .001, η2 = .762), and the effect associated with the group, (F(1, 21) = 23.31, p < .001, η2 = .526); in this case, the number of correct responses was higher in the HSS group than in the LSS group. However, the most interesting sources of variation were those related to the interaction Tasks x Group (F(1, 21) = 60.03, p < .001, η2 = .741) and Tasks x Blocks x Group (F(1, 21) = 27.17, p < .001, η2 = .564). Regarding the spelling task, the number of correct responses was higher in the HSS group than in the LSS, but this difference was lower in the B block. Conversely, for the letter-searching task, the number of correct responses was higher in the LSS group than in the HSS group. Regarding the reaction time, no source of variation was statistically significant. A simple way to observe the complexity of interaction effects in both dependent variables can be seen in Figure 2.
Effects on the number of correct answers and the reaction time according to the high (HSS) and low (LSS) spelling skills groups and their interaction with the type of task and block.
Neuroimaging
Based on the linear models of the SPM algorithm, we carried out a mixed factor ANOVA separately for each group with specific contrasts as follows: A > B, C > D, A > C and B > D. Greater region activation was observed in the LSS group when deciding on the word’s orthographic structure in the spelling recognition task. These activations appeared bilaterally, especially in two great groupings located in the inferior temporal gyrus, with a greater predominance towards the right hemisphere, and in the middle temporal gyrus, in the right hemisphere predominantly. Additionally, activations were also observed in this group in the right hemisphere’s supramarginal gyrus and in the middle portion of the frontal gyrus. Likewise, this group presented activation in subcortical regions such as the cerebellum, the parahippocampal gyrus, and the anterior cingulate region, all of them in the left hemisphere. In contrast, the group analysis of the HSS group revealed the activation of a small grouping located in the right hemisphere’s pre-central gyrus. The exact location of the aforementioned activations can be seen in Table 2 and graphically in Figure 3.
Activation of brain regions when attending to spelling (AB; spelling recognition task) and letter identification (CD; letter searching task). Listed are group, High and Low Spelling Skills (HSS and LSS); hemisphere (Left -L- and Right -R-) / anatomical region / Brodmann’s Area -BA-; MNI coordinates; and local maximum (Z) values in each cluster

All Z values are the value of the statistical contrast for the peak level in each cluster (significant at p < .0001 with threshold = .0001).
Statistical significance maps by regions for the spelling recognition task (A and B blocks) in the high (HSS, red-yellow) and low (LSS, blue-green) spelling skills groups.

When the participants had to decide on the presence of one letter in the words in the letter-searching task, independently from the spelling of the words, the analysis of both groups showed similar activations in the pre-central frontal gyri. Only the HSS group presented bilateral activations in the former region; regarding the latter region, the activations of the LSS group were anatomically inferior with respect to the other group. The activations in this task can be seen in Figure 4 and table 2.
Statistical significance maps by regions for the letter-searching task (C and D blocks) in the high (HSS, red-yellow) and low (LSS, blue-green) spelling skills groups.

The comparison of both groups between both tasks revealed an activation of the HSS group in the region of the right hemisphere’s middle frontal gyrus. Task comparisons showed an activation of the left hemisphere’s post-central gyrus, as well as bilateral activations of the superior temporal gyrus. Group interactions by task revealed activations in the posterior portion of the middle temporal gyrus and in the parahippocampalgyrus (Figure 5 and Table 3).
Statistical significance maps by regions based on the ANOVA analysis groups by tasks (blue to red show the statistical intensity effects).
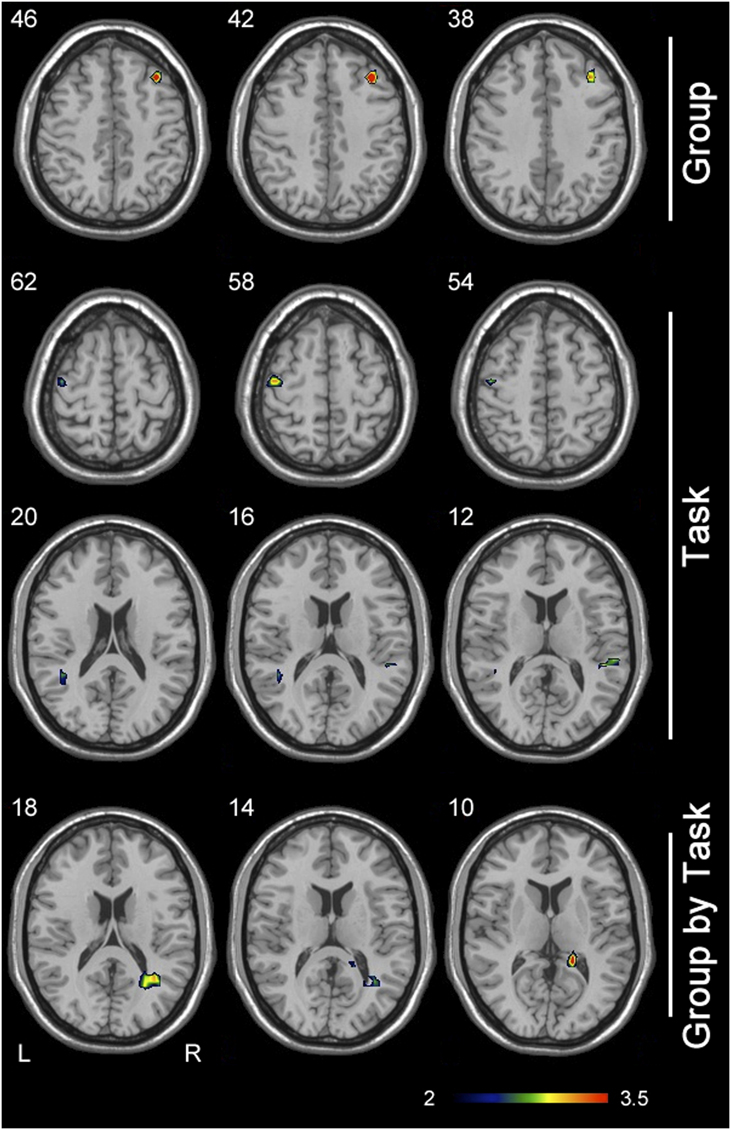
Activation of brain regions when comparing Group (HSS and LSS) and Task (AB and CD). Listed are contrast, hemisphere (Left -L- and Right -R-) / anatomical region / Brodmann’s Area -BA-, MNI coordinates and local maxima (Z) values in each cluster

All Z values are the value of statistical contrast for the peak level in each cluster (significant at p < .0001 with threshold = .0001).
To establish the impact of the experimental conditions on the brain signal analyzed, we studied the values of the parameters from the general linear model (GLM) estimated from the solutions by means of ordinary least square (OLS) of the contrasts defined for each experimental condition. In addition to the general analysis established on the second level defined on SPM8, it was deemed necessary to study the distribution of the estimates of the parameters associated with each contrast in each of the participants in each experimental group. In this manner, we used the βi values linked to the effect of the experimental conditions, and we analyzed the parameters for each contrast and participant by means of a mixed ANOVA of repeated measures, thus defining the competence levels as an inter-group effect, with the different contrasts analyzed as an intra-group effect. To avoid the possible “double dipping” effect described by Kriegeskorte, Simmons, Bellgowan, and Baker, (2009); all ANOVA contrasts were conducted using orthogonal coefficients so that effects were not overestimated. Likewise, the significances of this phase were carried out under the criteria of false discovery rate (FDR = .0001). Table 4 shows the significance values of the usual descriptive parameters and statistics.
Descriptive statistics of the distribution of βi parameters linked to each statistical contrast according to the group of competence (SE: Standard Error)

Based on this analysis, we were able to observe that the impact on the AB, AC, and BD contrasts was greater for the participants in the HSS group, exactly as in the case of the CD contrast, which was less intense. Obviously, the last contrast, ABCD, is of less interest because it is a comparison between non-strictly analogous tasks. It seems clear that the spelling recognition task (A and B blocks) caused a greater impact on the HSS group (F(3, 22)= 12.44, p < .001, η2 = .432) than on the LSS group, whereas the same was true for the letter-searching task (C and D blocks) F(3, 22) = 7.12, p = .037, η2 = .197), with a p value less significant than in the other contrast, but also statistically significant.
Discussion
According to the results from the spelling recognition task, the LSS group showed poorer behavioral performance (fewer correct responses and higher reaction times) compared to the HSS group. When the participant’s attention is focused on the orthographic structure of the words (spelling task blocks AB), the group with high skills (HSS) was faster and more accurate than the group with low skills (LSS), an expected result because the groups were formed according to this skill. However, when the participants had to detect the presence of a letter in the words (letter-searching task blocks CD); the answer pattern was the opposite. It is important to note that, in both tasks, we presented words spelled correctly and incorrectly. Previous to the conduction of the study, we believed that the group with high skills, which we consider to have reached an automation of the orthographic word structure, may conduct two tasks in blocks CD: identification of the letter in the presented stimulus (instruction done in these blocks) and an orthographic analysis (automation process). Meanwhile, the group with poorer orthographic skills probably only conducts the task regarding the instructions, the identification of a letter. Nevertheless, although our behavioral data seem support this interpretation, there are not previous experiments similar to this one on the literature; therefore this interpretation will be speculative. In addition as we will comment below in this section the fMRI data does not support this interpretation.
In our work, in the spelling task, the HSS group basically showed activations in the right inferior frontal regions. Some studies have related these regions with some aspects of the long term orthographic processing. In the work of Eckert et al. (Reference Eckert, Leonard, Richards, Aylward, Thomson and Berninger2003), the size of this structure was positively correlated with behavioral spelling measures. In other studies, healthy children showed more activation in right inferior frontal and right posterior parietal areas during orthographic mapping, and the activations in the same areas in dyslexic children increased and were normalized after an orthographic treatment (Richards et al., Reference Richards, Aylward, Berninger, Field, Grinme, Richard and Nagy2006). In addition the same study showed that normal and dyslexic people present different connectivity patterns in the inferior frontal gyrus and the visual Word Form Area. Also, the work by Edwards et al. (Reference Edwards, Pexman, Goodyear and Chambers2005) suggests that the processing of pseudohomophone words largely activated the bilateral inferior frontal gyri when compared to the tasks in which the subjects were asked to process consonant strings or pseudowords. The work by Zhan et al. (Reference Zhan, Yu and Zhou2013), also showed bilateral IFG activations during orthographic processing. These authors interpreted their results in the sense that right IFG activations may reflect the participation of cognitive control in lexical decision tasks, in tasks with effortful processing. There is also the possibility that processing the pseudohomophones of the present study recruited the right IFG because they share the same phonology and semantics of the original word and therefore the success on the task required both orthographic knowledge and active cognitive control.
Taken together, these studies are in line with the results of our work because they suggest an implication of right frontal regions in long term orthographic processing. However, Richards et al. (Reference Richards, Berninger and Fayol2009) selected good spellers and bad spellers from a normal reading skills group of children, and they found more activation in the left inferior frontal for the good spellers than for the bad spellers. Other works also showed that the discrimination between pseudohomophones and words spelled correctly activates left frontal inferior regions (Booth et al., Reference Booth, Cho, Burman and Bitan2007). Nevertheless the latter work also supports our results partially, as these authors found that a better performance in their task correlated with higher activations in the left inferior frontal gyrus in the situations with greater orthographic-phonological conflict. This result is, to some extent, similar to that obtained in the HSS group, because in the AB pair, in the A condition, 50% of the words were spelled correctly and, therefore, a more difficult task associated with greater activations in the inferior frontal gyrus in the HSS group. In addition, other authors show that there is an important functional connectivity between both homologous regions (Richards et al., Reference Richards, Berninger and Fayol2009), so it is possible that both right and left inferior frontal areas are involved in some way in the long term orthographic representation. Because the long term orthographic knowledge comes from multiple linguistic sources, for these authors, the left inferior frontal areas act as orthographic central executors, regulating the activity of multiple posterior brain areas that contribute to long term orthographic knowledge (Booth et al., Reference Booth, Cho, Burman and Bitan2007; Richards et al., Reference Richards, Aylward, Berninger, Field, Grinme, Richard and Nagy2006). The latter idea is also supported –to some extent–by the results obtained by the LSS group because if long term orthographic recognition has multiple linguistic origins (Richards et al., Reference Richards, Aylward, Berninger, Field, Grinme, Richard and Nagy2006), it is plausible that, in the absence of frontal inferior control, our participants show weak activations in multiple posterior brain areas when they try to detect orthographic errors. Not only did LSS participants show a different activation pattern than the HSS participants, but these activations were also significantly weaker.
These uncoordinated activation patterns for the orthographic detection task in the LSS group are in accordance with their behavioral performance–which is poorer–so it might be a link between the loss of inferior frontal activation and the inability to perform at the task. The fact that, in our study, we only obtained activations in the right inferior frontal gyrus and not bilateral may be due, in addition, to the fact that Spanish is a transparent language and therefore with a high feed-forward consistency between spelling and phonology. We should add to this the fact that the pseudohomophone stimuli used in our study only differ from the correctly spelled word in one letter which is in the same position where the correct letter would be and, as we mentioned in the introduction, these pseudohomophones are often accepted as a correct word. Accordingly, the participation of the left inferior frontal gyrus in the phonological and semantic processing of our stimuli would be practically the same in blocks A and B, and the activations observed during this pair of tasks in the right inferior frontal gyrus might be due to aspects of working memory and executive control of orthographic processing. Nevertheless, we must be cautious with this interpretation of the data given that our design does not allow us to study the involvement of these processes in the recognition of pseudohomophone errors directly.
Our results are also compatible with those of González-Garrido, Gómez-Velázquez, and Rodríguez-Santillán, (2014), who suggest that the electrophysiological correlates of orthographic errors processing have shown that adults with low orthographic abilities have problems in detecting orthographic rule violations, which could indicate weak representations in the orthographic lexicon or a difficulty in automatically accessing such representations.
The pattern of brain activation in both HSS and LSS groups on C-D blocks and the differences between groups are difficult to interpret. Both groups showed similar brain activations when performed this pair of tasks. In addition bilateral activations in the precentral frontal gyrus (which were observed in the letter search task for HSS participants) were not found in the explicit task, and therefore it’s difficult to link these activations to orthographic processing. In addition the HSS group did not show in the pair C-D the IFG activations that they showed in the pair A-B. It must be noted than in the pair A-B and C-D had the same proportion of pseudohomophones and correctly spelled words. Therefore, although the behavioral data seems to support the idea that the HSS group performed both tasks, orthographic detection and letter detection, the fMRI data does not support this idea.
Our study presents some limitations that should be noted. The most important one refers to the letter-searching task. In block C, the cognitive load and the set of tasks that the participants must conduct make it difficult to interpret the activations in this task in a meaningful anatomical way. Likewise, it is difficult to interpret the interaction effects group by task, where the HSS participants showed temporal activations and the LSS participants showed hippocampal activations. It is possible that a combination of our spelling task with the task implying the reading of pseudowords could provide a wider perspective about the relationship between brain activations and orthographic knowledge.
Another limitation of our study is the sample size we selected, which may be considered rather small. However, this should be seen as a relative limitation. The criteria to confirm the groups were strict, and the method of assignment to the groups, following the extreme values criteria, allowed us to maximize the possible differences. This made data interpretation rather clear in terms of brain activation despite the relatively small sample size (Friston, Reference Friston2012; Logothetis, Reference Logothetis2002). Apart from the sample size, the regularity of the effects and the activations found in the intra-group effects guarantee the homogeneity of the sampling and the correct application of the experimental procedure.
Yet another limitation of our paper might be the choice of a block design instead of an event-related design. The main reason to use a blocked-design was that it allowed us to use much less stimuli than an event-related design. It should be noted that the kind of pseudohomophones used in our work was different of those used in previous studies. In our case we must design a set of stimuli that differ from the real word in only one letter and that conserves the same phonology and semantics of the original word, because our stimuli must have some probability to be identified as a real word (less probability in the HSS group, higher probability in the LSS participants). In order to do this, both the pseudohomophones and the valid words had to be a high or relatively high frequency word to avoid that the lack of knowledge of the stimuli influenced the participant’s response (something that could occur with lower frequency words in the LSS group). In addition other important objectives on the task building was to avoid the repeated exposition of both psseudohomophones and correct words and to avoid that the pseudohomophones were modifications of other valid words presented during the experiment to minimize possible decays in BOLD signal due to a repeated exposition to the stimuli. All these reasons made that our study was very difficult to perform using an event-related design. Nevertheless, the brevity of the blocks and the short duration of the experiment probably impeded that the participants adopted automated response strategies. In addition the high correct response rates of HSS and the difference in response rates between HSS and LSS participants group on the pair AB suggests that our experiment is suitable for a block-design that could provide valid information in both behavioral and neuroimaging data.
To sum up, our work suggests that the HSS group was able to successfully perform the orthographic error decision task and showed activations in the right inferior frontal regions that have been mentioned in some studies with the long orthographic processing. On the other hand, the LSS group was not able to perform the same task successfully and showed a pattern of brain activations that included temporal, frontal and subcortical regions. Further studies should be conducted to determine whether the patterns of activation observed in this study appear in spotting tasks for other types of orthographic errors or if, instead, spotting pseudohomophone errors activates a pattern in good and bad spellers somewhat different from that of other types of errors.
Appendix: Relation of stimuli used.



