
1. Introduction
In the absence of flows, many microorganisms, such as single-celled algae and bacteria, tend to swim in preferred directions, causing accumulations of cells that can drive hydrodynamic instabilities and patterns, termed bioconvection (Pedley & Kessler Reference Pedley and Kessler1992; Hill & Pedley Reference Hill and Pedley2005; Bees Reference Bees2020). For algae, the biased motion may be upwards against gravity (gravitaxis) or towards light (phototaxis), both of which can lead to high cell concentrations near the upper surface. For many cells that are typically more dense than the fluid in which they swim, the resulting stratification may initiate an overturning instability. In addition, the cells will also be subject to viscous torques so instabilities can arise in uniform suspensions far from boundaries, called gyrotactic instabilities. Gyrotaxis is the result of the combined effect of viscous and gravitational torques, which can cause swimming cells to drift across streamlines and focus in downwelling regions of the flow, with their negative buoyancy driving additional downwelling (Pedley, Hill & Kessler Reference Pedley, Hill and Kessler1988). Together, the two mechanisms of gravitaxis and gyrotaxis are responsible for gyrotactic bioconvection (Kessler Reference Kessler1985a; Bees Reference Bees2020), which can occur in a closed container in the absence of other external stimuli (such as chemical gradients, chemotaxis or light).
Freely swimming microorganisms are ubiquitous in the natural world, and impact all aspects of our lives. However, many cells spend much of their lives closely associated with boundaries, with biased swimming motion and instabilities occurring in confined environments, from tubes (see figure 1a) to porous structures, such as in soil, and antibiotic-resistant biofilm formation on practically every surface from medical devices to ship hulls (Sauer et al. Reference Sauer, Stoodley, Goeres, Hall-Stoodley, Burmølle, Stewart and Bjarnsholt2022). Industrial applications are plagued by inefficiencies due to the fouling of industrial photo-bioreactor walls (Borowitzka Reference Borowitzka1999), and we, of course, rely on the proper functioning of our closely confined microbiome. Therefore, it is necessary to gain a proper understanding of suspensions, their swimming behaviour in flows in tubes and channels, and their potentially complex interaction with boundaries. The study of bioconvection in elementary confined environments allows us to develop such knowledge and pursue a systematic process of simplification.
(a) Gyrotactic plumes in a suspension of Chlamydomonas reinhardtii of concentration  $\sim$10
 $^5$ cells cm
 $^{-3}$, illustrating the development of asymmetric gyrotactic plumes in a vertical Hele-Shaw channel between two parallel glass slides of separation 1 mm, and chamber height and width 7.5 and 2.5 cm, respectively, when the mean flux
 $Q$ is zero; images (i) and (ii) are 30 s apart. (b,c) Bioconvection in a suspension of Chlamydomonas augustae of concentration
 ${\sim }1.6 \times 10^6$ cells cm
 $^{-3}$ in the vertical Hele-Shaw apparatus with chamber height and width 2.5 and 7.5 cm, respectively, at (b) onset (images every 10 s from fully mixed), demonstrating a gyrotactic instability, and (c) a later time (300 s), highlighting the formation of bottom standing plumes. (d) Bioconvection in a tapered vertical Hele-Shaw apparatus between two glass slides of width 1 mm at the top and touching at the bottom in a suspension of C. augustae with cell concentration
 ${\sim }5 \times 10^6$ cells cm
 $^{-3}$; individual gyrotactic plumes are initiated in the top third via a gyrotactic instability, propagate through the middle third, and dissipate in the bottom third. Images (a-i) and (a-ii) are due to H.O. Caldag and M.A. Bees; images (b–d) are due to J.O. Kessler and M.A. Bees.

Active matter systems of motile or force-exerting particles, which consume energy to move and are thus out of equilibrium, provide a natural framework for theoretical investigations (Simha & Ramaswamy Reference Simha and Ramaswamy2002; Pedley Reference Pedley2010; Ramaswamy Reference Ramaswamy2010). In dense suspensions, hydrodynamic stresses associated with the swimming motion of individual cells cannot be ignored, and the Stokesian instabilities studied in the context of active polar matter become relevant (Simha & Ramaswamy Reference Simha and Ramaswamy2002; Saintillan & Shelley Reference Saintillan and Shelley2008; Pedley Reference Pedley2010; Chatterjee et al. Reference Chatterjee, Rana, Simha, Perlekar and Ramaswamy2021; Jain et al. Reference Jain, Rana, Ramaswamy and Perlekar2024; Rana et al. Reference Rana, Chatterjee, Ro, Levine, Ramaswamy and Perlekar2024). In this paper, we will restrict attention to the non-trivial dynamics of dilute suspensions; the cells swim in a mean direction that is a function of the gradient of the fluid velocity, and are advected by the flow that they collectively drive by their negative buoyancy. However, we note that there is much to be explored in the intermediate semi-dilute regime, particularly in confined environments where we expect active stresses, such as swimming-induced stresslets, to play a qualitative role (Pedley & Kessler Reference Pedley and Kessler1992; Simha & Ramaswamy Reference Simha and Ramaswamy2002; Thampi Reference Thampi2022).
Consider a suspension of algal cells in a downward channel flow. At small volume fractions, the focused cells form plume structures along the centreline (Kessler Reference Kessler1985a,Reference Kesslerb; Bees Reference Bees2020). An intriguing observation in experiments is the occasional migration of plumes of cells towards the vertical walls, which is typically attributed to a small degree of tilt or to phototactic bias under illuminated conditions (figure 1a), but are there other, hydrodynamic, mechanisms for this asymmetry?
In figures 1(b,c), we see bioconvection plume structures forming in a vertical Hele-Shaw apparatus, at early and late times, illustrating both gyrotactic instabilities and long-time bottom standing structures, respectively. The distance between the two glass plates in this experiment is just 1 mm, so it is tempting to attempt to average in the direction into the page and thus consider only a two-dimensional bioconvective structure in the horizontal and vertical directions. But can this be justified? In fact, there are upwelling regions as well as downwelling between the glass plates, and whilst cells will tend to focus at the centre of the channel where the local flow is downwelling, they will migrate towards slow-moving flow at the glass boundaries in upwelling zones; cells will be transported at a greater velocity than the cross-sectional mean flow when it is downwards in the channel, and at a smaller velocity than the mean when it is upwards. In addition, it is not clear whether the flow and cell concentration profiles are likely to be symmetric across the channel. These aspects will play a very interesting role in the overall pattern formation, and the resolution will provide the foundation for systematically constructing an averaging process.
In this paper, we investigate the above questions directly by considering solutions in a two-dimensional vertical channel geometry (see figure 2), with some unexpected results. There is a surprising complexity of solutions from equations that, at first glance, look relatively straightforward. We explore the solutions using both analytical and numerical methods, making good use of two distinct simulation techniques, Eulerian and Lagrangian, that generate results with remarkably good agreement. To access all solutions, one must choose the model formulation and its boundary conditions very carefully and in a non-trivial way, not least because it is hard to approximate a solution constrained by no-flux boundary conditions if there are few swimmers present at the boundary. In addition, the presence of the cells can drive fluid flow down the channel, but so can a pressure gradient. These two driving mechanisms combine to determine the mean flux, but it is not unique. Alternatively, one may attempt to impose the mean flux to establish the required pressure gradient, but once again, uniqueness is not guaranteed, particularly for small positive or negative flow rates. In particular, and in contrast to investigations in the literature (e.g. Hwang & Pedley Reference Hwang and Pedley2014b), we do not impose symmetry (it is easier to enforce zero cell flux in the centre of the channel where cells are present). It turns out that asymmetric solutions arise naturally and are more stable in some instances than symmetric solutions. We explore the nature of the nonlinear bifurcation structure as the mass flow and pressure are varied, and investigate the secondary blip and varicose instabilities using the two distinct numerical approaches. This structure depends to a large extent on the non-dimensional parameters, namely the Schmidt, Richardson and Péclet numbers. This allows us to construct a modified quasi-two-dimensional theory for bioconvection in a Hele-Shaw cell and similar geometries, which for some aspects compares favourably with experimental results. Finally, we discuss our results in the context of the literature, and describe some open questions.

2. Outline of experimental observations
The present paper is primarily a theoretical study; experimental results will be published in full elsewhere. However, some experimental observations and results are included here to motivate the theoretical study and to allow qualitative comparison.
Suspensions of biased motile cells often exhibit hydrodynamic instabilities that are reminiscent of classical convection patterns when shallow layers are observed from above (Pedley & Kessler Reference Pedley and Kessler1992; Bees Reference Bees2020). For deeper cultures of cells, the emergent structures typically consist of a succession of descending plumes that can form either at the upper surface or, for gyrotactic cells, throughout the suspension. To explore the initiation of gyrotactic plumes and long-term behaviour, we conduct some experiments in a vertical Hele-Shaw apparatus formed from two microscope slides (thickness 1.055 mm) with further slides acting as spacers. We used UV-curing glass glue to fix the apparatus in place. Tapered Hele-Shaw cells were constructed similarly, but no spacer was used at the bottom of the container.
We follow the general cell culture and quantitative experimental approach of Williams & Bees (Reference Williams and Bees2011) for C. augustae (Wille). Cultures of motile cells were grown on Bold's Basal Medium under cool-white lights (1500 lx) with 12 h:12 h L:D photoperiod. Experiments were conducted at a constant temperature  $20\pm 2\,^{\circ }$C on concentrated cultures (3–5 weeks old) in the middle of their light period when the cells appear consistently active. Cells were concentrated by allowing the negatively gravitactic cells to swim upwards through absorbent cotton wool placed at the top of the culture flask. To avoid the cells sticking to glass surfaces, the Hele-Shaw apparatus was rinsed in a small amount of the culture medium of low cell concentration. Illumination was provided by a stable 660 nm red LED diffuse backlight array (Edmund Optics), avoiding heating and a phototactic response (Foster & Smyth Reference Foster and Smyth1980). Mixing of the suspension was achieved using a metal wire.
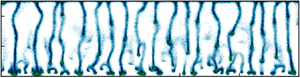
The images in figure 1(b) are characteristic of a gyrotactic instability, with plume structures appearing in a few tens of seconds throughout the fluid layer. Over time, these individual plumes reorganise into more regularly spaced structures, as seen in figure 1(c). Plumes initiated at the top of the suspension are associated with an overturning instability (upswimming dense cells accumulate at the top), which interacts further down with plumes formed by gyrotactic instabilities. Towards the bottom of the chamber, we see ‘bottom standing plumes’ that sit upon a concentrated layer of cells at the bottom. Bottom standing plumes have been described previously by Pedley & Kessler (Reference Pedley and Kessler1992) and Ghorai, Singh & Hill (Reference Ghorai, Singh and Hill2015), but the precise mechanism for their existence remains elusive. The bottom standing plumes phenomenon and associated high cell concentration at the bottom are self-generated and, paradoxically, due to the tendency of bottom-heavy cells to swim upwards: gyrotaxis leads cells to be recirculated in the downwelling flows surrounding plumes that descend from above and become entrained in the plume heads when they interact with the lower boundary. Interestingly, the wavelength of the long-term pattern decreases with depth; wavelengths are halved midway down, and halved again close to the bottom. The wavelength at the top is 4.7 mm, halfway down it is 2.5 mm, and at the bottom it is 1.3 mm.
Experiments in a tapered vertical Hele-Shaw apparatus display qualitatively different behaviour, as observed in figure 1(d). Here, gyrotactic plumes are initiated in the upper third of the apparatus, descend through the middle third, and dissipate in the bottom third. Typically, there are no cells at all near the bottom of the vessel (sometimes the bottom quarter, with the precise exclusion zone depending on mean cell concentration), despite adequate vessel width (for example,  $250\,\mathrm {\mu }$m compared to a cell diameter less than
 $10\,\mathrm {\mu }$m). Near the bottom, plumes are observed to slow and broaden sufficiently for cells to swim out and upwards on average. In addition, we see a grouping of approximately three individual plumes in broader plume heads creating channels of clear upwelling fluid. This is clearly a distinct behaviour due to the increasing proximity of the vessel walls with depth, and thus increasing resistance to fluid flow. There are qualitative features of these experiments that we will return to in § 5.
3. Modelling gyrotactic bioconvection: two approaches
Consider the flow geometries depicted in figure 1. The suspension velocity  ${\boldsymbol u}$ is governed by the Navier–Stokes equations with a buoyancy term that takes account of the difference in density between the gyrotactic cells and the fluid,
 $\Delta \rho$, such that
 \begin{equation} \rho\,\frac{{\rm D}{\boldsymbol u}}{{\rm D} t} ={-} \boldsymbol{\nabla} p_{e} + n n_0 \mathcal{V}\,\Delta \rho\,{\boldsymbol g} + \boldsymbol{\nabla} \boldsymbol{\cdot} \varSigma,\quad \boldsymbol{\nabla} \boldsymbol{\cdot} {\boldsymbol u} = 0, \end{equation}
where  ${\boldsymbol u}({\boldsymbol x},t)$ is the velocity of the suspension,
 $n_0$ is the average number of cells per unit volume,
 $n({\boldsymbol x},t)$ is the cell concentration normalised by
 $n_0$ (such that the average cell concentration is equal to unity),
 $p_{e}({\boldsymbol x},t)$ is the excess pressure,
 $\rho \equiv 1 \,{\rm g}\,\,{\rm cm}^{-3}$ is the fluid density,
 $\rho +\Delta \rho$ is the cell density,
 $\mathcal {V}$ is the volume of an individual cell, and
 ${\boldsymbol g}$ is the gravitational acceleration. The stress tensor
 $\varSigma$ may include terms that account for swimming stresslets or Batchelor stresses. However, here we assume that the suspension is sufficiently dilute that it may be considered a Newtonian fluid with
 $\boldsymbol {\nabla }\boldsymbol {\cdot } \varSigma =\mu \,\nabla ^2 {\boldsymbol u}$, where
 $\mu$ is the fluid viscosity.
As experiments are over a relatively short time; the birth and death of an individual are ignored. We will see that there is an abundance of complexity in this system, so we will assume for simplicity that the cells are spherical, and use either a two-dimensional Lagrangian or an Eulerian description to study the cell density dynamics, as laid out below.
3.1. Lagrangian description
The evolution equations for the centre-of-mass position  ${\boldsymbol X}_\alpha$ and the orientation vector
 ${\boldsymbol p}_\alpha$ of
 $N_p$ gyrotactic organisms in a suspension are given by
 \begin{equation} \left.\begin{gathered} \frac{{\rm d}{\boldsymbol X}_{\alpha}}{{\rm d} t} = {\boldsymbol u}({\boldsymbol X}_{\alpha},t) + V_s {\boldsymbol p}_\alpha, \\ {\rm d} {\boldsymbol p}_\alpha = \frac{{\rm d} t}{2B} [{\boldsymbol i}-({\boldsymbol i}\boldsymbol{\cdot} {\boldsymbol p}_\alpha){\boldsymbol p}_\alpha] + \frac{{\rm d} t}{2}\,{\boldsymbol \omega} \times {\boldsymbol p}_\alpha + \sqrt{2 d_r}\,{\rm d} W_\alpha, \end{gathered}\right\} \end{equation}
where the cell index is  $\alpha =1,\ldots, N_p$,
 ${\boldsymbol i}$ is the unit vector in the vertical (
 $-{\boldsymbol x}$) direction,
 ${\boldsymbol p}$ is the unit vector
 $(p_{\alpha x},p_{\alpha y},p_{\alpha z})$,
 $B$ is the gyrotactic reorientation time scale,
 $d_r$ is the rotational diffusivity,
 ${\boldsymbol \omega }=\boldsymbol {\nabla } \times {\boldsymbol u}$ is the vorticity vector, and
 ${\rm d}W_{\alpha}$ is a standard Wiener process.
In the experimentally relevant regime where the flow is dominantly planar,  ${\boldsymbol \omega }= \omega \hat {\boldsymbol {k}}$, and the reorientation time scale is much smaller than the diffusivity
 $B<1/d_r$, we can reasonably make the assumption that
 $p_{\alpha x}^2+p_{\alpha y}^2 \gg p_{\alpha z}^2$. For this regime, the Lagrangian dynamics simplifies to
 \begin{equation} \left.\begin{gathered} \frac{{\rm d}{\boldsymbol X}_{\alpha}}{{\rm d} t} = {\boldsymbol u}({\boldsymbol X}_{\alpha},t) + V_s {\boldsymbol p}_\alpha, \\ {\rm d} {\theta}_\alpha = \frac{{\rm d} t}{2}\left[\omega + \frac{1}{B}\sin(\theta_\alpha)\right] + \sqrt{2 d_r}\,{\rm d} W_\alpha, \end{gathered}\right\} \end{equation}
where the orientation of cell  $\alpha =1,\ldots, N_p$ is given by
 ${\boldsymbol p}_\alpha =(\cos (\theta _\alpha ),\sin (\theta _\alpha ))$,
 $B$ is the gyrotactic reorientation time scale,
 $d_r$ is the rotational diffusivity,
 $\omega$ is the vorticity, and
 ${\rm d}W_{\alpha}$ is a standard Wiener process. From the positions
 ${X}_\alpha (t)$, we obtain the number density field
 $n({\boldsymbol x},t) \equiv \sum _{\alpha } \delta ({\boldsymbol x} - {\boldsymbol X}_\alpha )$, where the Dirac delta function may be approximated by a cosine formula (see (6.28) in Peskin Reference Peskin2002). Together, (3.1a,b) and (3.3) describe the coupled hydrodynamics and dynamics of swimmers, and will be referred to as the GL equations.
3.2. Eulerian description
The number density field  $n$ satisfies a cell conservation equation of the form
 \begin{equation} \frac {\partial n}{\partial t} ={-} \boldsymbol{\nabla}\boldsymbol{\cdot} {\boldsymbol J},\quad \mbox{with flux}\ {\boldsymbol J} = [n ({\boldsymbol u} + {\boldsymbol U}) - \boldsymbol{\mathsf{D}} \boldsymbol{\cdot}\boldsymbol{\nabla} n], \end{equation}
where the flux terms represent advection by the flow  ${\boldsymbol u}$, drift relative to the flow with mean swimming velocity
 ${\boldsymbol U} ({\boldsymbol x},t)$, and swimming diffusion with diffusion tensor
 $\boldsymbol{\mathsf{D}}({\boldsymbol x},t)$. We use the approximate functions obtained by Bearon, Bees & Croze (Reference Bearon, Bees and Croze2012) for the dependence of the swimming velocity
 ${\boldsymbol U}$ and the diffusion tensor
 $\boldsymbol{\mathsf{D}}$ on vorticity. These are based on generalised Taylor dispersion (GTD) theory for biased swimming cells in a steady linear shear flow (Hill & Bees Reference Hill and Bees2002), such that
 \begin{equation}
{\boldsymbol U} = V_s
\begin{bmatrix} -P(\sigma; {\boldsymbol a}^x,{\boldsymbol
b}^x) \\ -\sigma\,P(\sigma;
{\boldsymbol a}^y, {\boldsymbol b}^y)
\end{bmatrix}\quad {\rm and}\quad
{\boldsymbol{\mathsf{D}}} = \frac{V_s^2}{d_r}
\begin{bmatrix} P(\sigma; {\boldsymbol a}^{xx},{\boldsymbol
b}^{xx}) & \sigma\,P(\sigma; {\boldsymbol a}^{xy}
{\boldsymbol b}^{xy}) \\ \sigma\,P(\sigma; {\boldsymbol
a}^{xy} {\boldsymbol b}^{xy}) & P(\sigma; {\boldsymbol
a}^{yy},{\boldsymbol b}^{yy}) \end{bmatrix}, \vphantom{\begin{bmatrix} -P(\sigma; {\boldsymbol a}^x,{\boldsymbol
b}^x) \\ -\sigma\,P(\sigma;
{\boldsymbol a}^y, {\boldsymbol b}^y)
\end{bmatrix}_{\tfrac{1}{2}}}
\end{equation}
where  $\sigma =\omega /(2 d_r)$ is the non-dimensional vorticity, and
 $P(\sigma ; {\boldsymbol a},{\boldsymbol b})$ may be approximated as
 \begin{equation} P(\sigma; {\boldsymbol a},{\boldsymbol b})=\frac{a_0 +a_2 \sigma ^2+a_4\sigma^4}{1+b_2 \sigma^2+b_4 \sigma^4}, \end{equation}
with the  ${\boldsymbol a}$ and
 ${\boldsymbol b}$ coefficients given in table 1 (Bearon et al. Reference Bearon, Bees and Croze2012). The advantage of the GTD approximation is that it provides simple explicit expressions for mean swimming and diffusion components as a function of the flow gradient (but see also Fung, Bearon & Hwang (Reference Fung, Bearon and Hwang2022) for an alternative local approximation model). However, formally, the GTD approach applies only to cases where there is a steady linear shear flow, and does not always do so well in other cases (Bearon, Hazel & Thorn Reference Bearon, Hazel and Thorn2011; Jiang & Chen Reference Jiang and Chen2020). Despite these apparent limitations, the GTD approach has been used successfully in capturing macroscale phenomena, such as Taylor dispersion in a tube, qualitatively and quantitatively much better than other approaches (Croze, Bearon & Bees Reference Croze, Bearon and Bees2017), and we will see that the Eulerian numerical results using this formulation agree strongly with the independent Lagrangian scheme, suggesting that the GTD approach can provide a very good approximation beyond its formal range of validity.
Parameter values for the coefficients  ${\boldsymbol a}$ and
 ${\boldsymbol b}$ obtained for dimensionless shear strength
 $\lambda \equiv 1/(2 B d_r)=2.2$, adapted from Bearon et al. (Reference Bearon, Bees and Croze2012). Superscripts indicate the components.

In the Eulerian framework, (3.1a,b) and (3.4)–(3.6) describe the fluid and cell dynamics. In what follows, we will refer to these as the GE equations. Furthermore, we show that the simplified GL equations and the GE equations that use GTD theory show excellent agreement.
4. Bioconvection in a vertical channel
The sketch in figure 2 presents a vertical channel geometry, parallel to the downward pointing  $x$-axis, with the
 $y$-axis across the channel. At the channel walls, we impose zero normal cell flux along with no-slip conditions for the flow:
 ${\boldsymbol j} \boldsymbol {\cdot } {\boldsymbol J} (x,0) ={\boldsymbol j} \boldsymbol {\cdot } {\boldsymbol J} (x,2h) =0$ and
 ${\boldsymbol u}(x,0)={\boldsymbol u}(x,2h)=0$. To facilitate numerical approximation, we assume that the domain is periodic in
 $x$ over the length scale
 $L > h$. Additionally, the flow is maintained at a fixed volumetric flow rate
 \begin{equation} Q^*\equiv \int_0^{2h} u_x \,{{\rm d}y}, \end{equation}
which is, necessarily, constant along the entire channel.
In all of our analysis and simulations, we choose parameters corresponding to a suspension of Chlamydomonas augustae (sometimes identified as Chlamydomonas nivalis) in a channel of half-width  $h=1 \,\textrm {cm}$, with
 $\nu =0.01 \,\textrm {cm}^2\,\textrm {s}^{-1}$,
 $V_s=0.0063 \,\textrm {cm}\,\textrm {s}^{-1}$,
 ${\mathcal {V}}=5 \times 10^{-10} \,\textrm {cm}^3$,
 $\rho =1 \,\textrm {g} \,\textrm {cm}^{-3}$,
 $\rho + \Delta \rho =1.05\,\textrm {g} \,\textrm {cm}^{-3}$,
 $g=980 \,\textrm {cm}\,\textrm {s}^{-2}$,
 $d_r= 0.067\,\textrm {s}^{-1}$ and
 $n_0 \approx 10^{5}$.
4.1. Non-dimensional quantities
By choosing the characteristic length scale as  $h$ and the characteristic velocity scale as
 $V_s$, we find that the dimensionless numbers that describe the flow are the dimensionless flow rate
 $Q\equiv Q^*/(V_s h)$, the Schmidt number
 $Sc\equiv \nu d_r/V_s^2$, the swimming Péclet number
 $Pe\equiv h d_r/V_s$, and the Richardson number
 $Ri\equiv n_0 {\mathcal {V}}\,\Delta \rho \,g h/\rho V_s^2$. Alternatively, if we choose the characteristic velocity scale as
 $\nu /h$, then we get
 $Q_1\equiv Q^*/\rho \nu$,
 $Sc\equiv \nu d_r/V_s^2$, and the Rayleigh number
 $Ra \equiv n_0 {\mathcal {V}}\, \Delta \rho \,g h^3/\rho \nu ^2$ as the appropriate dimensionless group. The two dimensionless groups are related
 $Ra=(Pe/Sc)^2\,Ri$ and
 $Q_1\equiv (Pe/Sc) Q$. Following Hwang & Pedley (Reference Hwang and Pedley2014a), we characterise the system using
 $(Q,Sc, Pe, Ri)$.
For the C. augustae suspension, we choose  $Ri \approx 90$,
 $Sc \approx 16.8$ and
 $Pe \approx 10.6$. We investigate the suspension dynamics by varying the dimensionless flow rate
 $Q$. To understand the dependence of our results on the solution viscosity, for a few cases, we also study the dependence on
 $Sc \approx 16.8- 80$.
4.2. Streamwise homogeneous solutions (one-dimensional)
Using the GE equations, we first investigate the steady-state streamwise homogeneous solutions in a vertical channel. Using the incompressibility condition and no-slip boundary condition, the equations for streamwise velocity  $u_x(y)$ and number density
 $n(y)$ become
 \begin{equation} \left.\begin{gathered}
\frac{\partial u_x}{\partial t} = \nu\,\frac{\partial^2
u_x}{\partial y^2} + \alpha (n-1) - \frac{{\rm d} p_e}{{\rm d}\kern0.7pt x},\\ \frac{\partial n}{\partial t} =
\frac{\partial}{\partial y} \left[{-}n U_y + D_{yy}\,
\frac{\partial n}{\partial y} \right],
\end{gathered}\right\}
\end{equation}
with  $\alpha \equiv n_0 {\mathcal {V}} \delta \rho g$.
At steady state, we require
 \begin{equation} \left.\begin{gathered} \nu\,\frac{{\rm d}^2 u_x}{{{\rm d}y}^2} = \frac{{\rm d} p_e}{{\rm d}\kern0.7pt x} - \alpha (n-1),\\ \frac{{\rm d} n}{{\rm d}y} = \left(\frac{a^y_0}{2 V_s a_{0}^{yy}}\right) \frac{{\rm d} u_x}{{\rm d}y}\,n, \end{gathered}\right\} \end{equation}
where we have assumed weak flow to retain only the leading-order terms in  $U_y$ and
 $D_{yy}$, and imposed the no-flux condition for the number density. Note that whilst the current paper makes use of the closed-form expressions from the GTD approximation, any rational approach that possesses the correct symmetry for the swimmers will produce the weak flow expressions for the biased swimmer dynamics employed above.
Multiplying the first equation by the velocity gradient to rewrite the number density in terms of the velocity derivatives, integrating and re-substituting yields the second-order differential equation
 \begin{equation} \frac{{\rm d}^2 u_x}{{{\rm d}y}^2} - \frac{\gamma}{2} \left(\frac{{\rm d} u_x}{{\rm d}y}\right)^2 + \beta u_x = \frac{\beta}{\gamma} -A\gamma, \end{equation}
where  $A$ is a constant, and we define
 $\gamma \equiv {a^y_0}/{(2 V_s a_{0}^{yy})}$ and
 $\beta \equiv (\alpha \gamma /\nu ) [1 + (\textrm {d} p_e/{\textrm {d}x})/\alpha ]$. Substituting
 $v = u_x-C/\beta$, where
 $C \equiv \beta /\gamma - A\gamma$, yields
 \begin{equation} \frac{{\rm d}^2 v}{{{\rm d}y}^2} - \frac{\gamma}{2} \left(\frac{{\rm d} v}{{\rm d}y}\right)^2 + \beta v = 0. \end{equation}
A relationship between  $Q$, the pressure gradient, and biological parameters can be found by integrating (4.4) over the entire domain (using (4.3)), such that
 \begin{equation} C=\frac{\beta}{2h}\,Q - \frac{\gamma}{4 h} \int_{0}^{2h} \left(\frac{{\rm d} u_x}{{\rm d}y}\right)^2 {{\rm d}y} + \frac{1}{\nu}\,\frac{{\rm d} p_e}{{\rm d}\kern0.7pt x}. \end{equation}
Equation (4.5) is a differential equation of quadratic Liénard type (Strogatz Reference Strogatz2018), and following the analysis in Chicone (Reference Chicone1987) (alternatively, solving the second equation of (4.3) and substituting into the first, and comparing with the earlier result (4.5) and (4.6)), we find the integral
 \begin{equation} \frac{1}{2} \left(\frac{{\rm d} v}{{\rm d}y}\right)^2 - \frac{\beta}{\gamma}\,v - \frac{\beta}{\gamma^2} - k \exp(\gamma v) =0, \end{equation}
where  $k$ is a constant. It immediately follows that the solutions of (4.5) are a set of periodic orbits surrounding the centre
 $(v,\textrm {d} v/{\textrm {d}y})=(0,0)$, which are bounded by the separatrix defined by
 $k=0$.
Due to the no-slip boundary condition, we have  $u_x=0$ at the walls. Using (4.7), it is clear that permitted solutions must satisfy
 $\textrm {d} u_x/{\textrm {d}y}|_{y=0} = \pm \textrm {d} u_x/{\textrm {d}y}|_{y=2h}$. Note that for the positive case,
 $\textrm {d} p_e/{\textrm {d}x}=0$.
We refer the reader to Bees & Hill (Reference Bees and Hill1999) for a similar discussion regarding solutions in an unbounded domain.
4.2.1. Direct numerical simulations
Using direct numerical simulations (DNS) of (4.2), we explore the variety of homogeneous solutions and verify the prediction of the integral (4.7). The spatial domain of length  $2h$ is discretised using
 $N_x=128$ uniformly spaced collocation points. We numerically integrate (4.2) in the vorticity-streamfunction formulation (Perlekar & Pandit Reference Perlekar and Pandit2009) to maintain a constant flow rate and satisfy the incompressibility condition. The concentration nodes lie between the link joining adjacent vorticity nodes (Ghorai & Hill Reference Ghorai and Hill1999). Note that in the one-dimensional setting, we may rewrite the vorticity as
 $\omega =-\partial _y u_x$ and the streamfunction as
 $\psi =\partial _{yy} \omega$. We run our simulations for at least
 $t V_s/h > 6 \times 10^5$ time units to achieve a steady state. Unless specified otherwise, we fix
 $Ri=90$ and
 $Sc=17$.
4.2.2. Zero mass flow:  $Q=0$

For  $Q=0$, the trivial solution
 ${\boldsymbol u}=\textbf {0}$ and
 $n=1$ satisfies (4.2). However, this solution is linearly unstable (as noted in Pedley Reference Pedley2010). In fact, starting from the trivial solution with a random perturbation as initial condition and numerically integrating (4.2), we find that this leads to asymmetric steady-state flow and concentration profiles that consist of a near-wall downflow (
 $u_x>0$) region where, consistent with the gyrotactic mechanism (Bees Reference Bees2020), organisms cluster, and a single upflow (
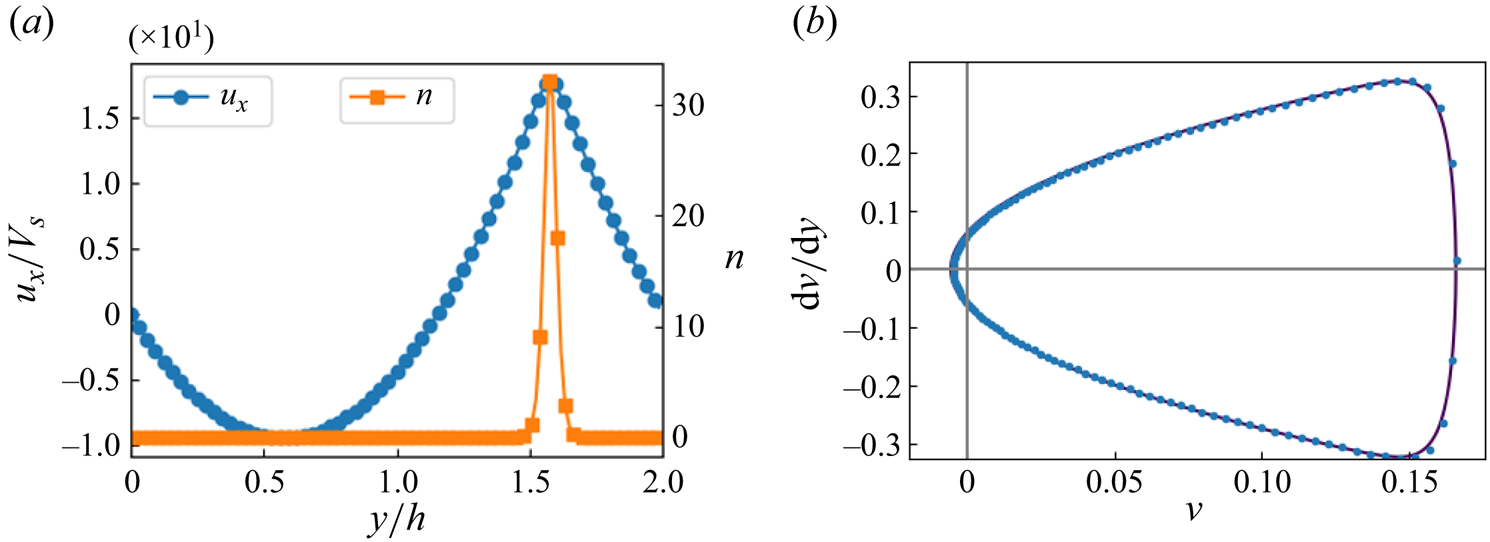
 $u_x<0$) region that is devoid of organisms (see figure 3a).
(a) Plot of the velocity  $u_x$ and the number density
 $n$. (b) Phase space plot obtained from the DNS (blue dots) and its agreement with the integral curve (4.7) (black line). For a discussion on phase space dynamics in an unbounded domain, we refer the reader to Bees & Hill (Reference Bees and Hill1999).

From the velocity field and its gradients (note that  $\textrm {d} p_e/{\textrm {d}x}=0$), we evaluate
 $C$ using (4.6), and
 $k$ is obtained by performing a least squares fit to the data. The plot in figure 3(b) demonstrates that the points
 $(v,\textrm {d} v/{\textrm {d}y})$ obtained from the DNS are in excellent agreement with the integral curve (4.7).
Symmetric solutions: we identify two more solutions of (4.2) with even symmetry about the centreline (i.e.  $u_x(y)=u_x(2h-y)$ and
 $n(y)=n(2h-y)$). The numerical solutions are obtained by integrating (4.2) over the half-domain and imposing stress-free boundary condition
 $\omega (h)=0$ about the centreline. The plots in figure 4 show the velocity and concentration profiles. The solutions consist of either a downwelling flow (
 $u_x>0$) or an upwelling flow (
 $u_x<0$) near the centreline. We observe
 $\textrm {d} p_e/{\textrm {d}x}>(<)\ 0$ in the former (latter) case, and the organisms are concentrated either along the centre or near the two walls. Furthermore, similar to above, the points in the
 $(v,\textrm {d} v/{\textrm {d}y})$ phase plane are in excellent agreement with the integral curve (4.7).
(a,c) Plot of the velocity  $u_x$ (blue circles) and the number density
 $n$ (orange squares) fields for the two symmetric solutions. (b,d) Corresponding phase space plots obtained from the DNS (blue dots) and their agreement with the integral curve (4.7) (black line).

4.2.3. Varying mass flow rate: $Q$

In the absence of organisms, for a Newtonian fluid, the flow rate is linearly related to an excess pressure  $Q=-(\textrm {d} p_e/{\textrm {d}x})/(12 \mu )$. However, as we observed in the previous subsection, even for
 $Q=0$, non-trivial solutions with
 $\textrm {d} p_e/{\textrm {d}x}\neq 0$ are possible. Therefore, in figure 5, we now characterise the excess pressure by varying
 $Q$ for different values of
 $Sc$. For a range of
 $Sc$, an intermediate
 $|Q|$ range exists (about
 $Q=0$) where the relationship between
 $\textrm {d} p_e/{\textrm {d}x}$ and
 $Q$ is inconsistent with the Newtonian behaviour.
Plot of  $-\textrm {d} p_e/{\textrm {d}x}$ versus
 $Q$ for (a)
 $Sc=17$, (b)
 $Sc=53$, (c)
 $Sc=80$, and (d)
 $Sc=150$. The asymmetric flow solutions for which
 $\textrm {d} p_e/{\textrm {d}x}=0$ are shown with black squares, whereas the symmetric solutions are marked with blue circles.

Asymmetric solutions: the flow profiles for solutions with  $\textrm {d} p_e/{\textrm {d}x}=0$ are asymmetric, as shown in figure 6(a). For positive
 $Q$, a downwelling flow region (where
 $u_x>0$) is present in the vicinity of either one of the walls. This region migrates towards the wall as
 $Q$ is reduced. As
 $Q$ becomes negative, an upwelling (
 $u_x<0$) region also appears. Similarly to the
 $Q=0$ case, we observe (not shown) that the cells accumulate in regions of downwelling flow. This intermediate
 $Q$ region disappears for very large
 $Sc=150$, and we recover the Newtonian-like monotonic relationship between the excess pressure and the flow rate.
(a) The asymmetric flow solution that satisfies  $\textrm {d} p_e/{\textrm {d}x}=0$ for different values of
 $Q$ at
 $Sc=17$. (b,c) Plots of the symmetric velocity profile
 $u_x$ at
 $Sc=17$ and for different values: (b)
 $Q<0$, and (c)
 $Q>0$.

Symmetric solutions: in the first and third quadrant of plots in figure 6 (i.e.  $(Q>0,-\textrm {d} p_e/{\textrm {d}x}>0)$ and
 $(Q<0,-\textrm {d} p_e/{\textrm {d}x}<0)$), only symmetric solutions exist. To obtain the symmetric solutions in the other two quadrants, we impose additional symmetry conditions, as in § 4.2.2. Note that
 ${\boldsymbol u}={\boldsymbol 0}$ and
 $n=1$ is the only symmetric solution that satisfies
 $\textrm {d} p_e/{\textrm {d}x}=0$ at
 $Q=0$. Therefore, from figure 5, it is apparent that the non-trivial symmetric solution with
 $-\textrm {d} p_e/{\textrm {d}x}>0$ vanishes at approximately
 $Sc\geq 53$, and the solution with
 $-\textrm {d} p_e/{\textrm {d}x}<0$ vanishes beyond
 $Sc\geq 80$. The specific case for the variation of
 $\textrm {d} p_e/{\textrm {d}x}$ with positive
 $Q$ for
 $Sc=80$ agrees with the results of Hwang & Pedley (Reference Hwang and Pedley2014b).
The plots in figures 6(b,c) provide the velocity profiles for the symmetric solutions for different values of  $Q$ with
 $Sc=17$. In a similar manner to the
 $Q=0$ case, we observe that for small positive (negative)
 $Q$, an upwelling (downwelling) flow is generated near the centre. The concentration profile (not shown) has a peak in the downwelling region. As the qualitative trend of the symmetric solutions for different values of
 $Sc$ remains the same, we do not repeat the discussion. The dynamics in the
 $(v,\textrm {d} v/{\textrm {d}y})$ plane also satisfy the integral (4.7).
4.2.4. Comparison between the GL and GE approaches
In the preceding subsections, we have used the GE equations and simplifications to investigate the dynamics of gyrotactic suspensions. To derive the GE equations, Bearon et al. (Reference Bearon, Bees and Croze2012) used GTD theory to evaluate the mean biased motion and effective diffusivity in the suspension for a linear shear flow, but it is unclear whether the GTD approximation is good for slowly varying flows driven by buoyancy. Therefore, to further validate our results, and ahead of the main discussion of two-dimensional flows below, we now make a comparison of the flow  $u_x$ and cell number density
 $n$ profiles obtained by integrating the GE equations with those obtained by integrating the GL equations for
 $Q=0$. Note that the GL equations are stochastic and explicitly contain the orientation fluctuations. Thus the steady-state profile is obtained statistically by averaging steady states. For the GL equations, all parameters are kept identical to the GE equations, and we use
 $N_p=4000$ particles.
The plots in figures 7(a,b) demonstrate good agreement between the profiles obtained by using the two methods. These results provide confidence in the use of both our GL and GE approaches in regimes where the organisms modify the flow via buoyancy.
Comparison of (a) the velocity  $u_x$, and (b) the number density
 $n$ profile obtained by numerically integrating the GL and GE equations. The vertical bar denotes the
 $2 \sigma$ variation about the average profile obtained from the GL equations. The other asymmetric solution (a mirror image of that in the figure) can result for a different choice of initial perturbation.

4.3. Two-dimensional channel
The results of the previous subsection provide good evidence that gyrotactic microorganisms can migrate close to the wall for small flow rates. In particular, around  $Q=0$, multiple solution branches can exist, depending on the value of
 $Sc$. We now consider a periodic channel flow to understand the dynamics in a spatially extended system as sketched in figure 2.
4.3.1. Direct numerical simulations
The channel  $(2h,L)$ is discretised using
 $(N_x,N_y)$ uniformly spaced collocation points. The Navier–Stokes equations are evolved using the vorticity-streamfunction formulation (Perlekar & Pandit Reference Perlekar and Pandit2009). In a similar manner to Ghorai & Hill (Reference Ghorai and Hill1999), the grid is chosen so that the concentration nodes lie in the interior only, whereas those of the streamfunction and vorticity lie in the interior and on the boundary of the domain. All spatial derivatives are evaluated using a second-order finite-difference scheme, and the time-marching in GE equations is performed using a fourth-order Runge–Kutta scheme. For the GL equations, we perform the time update using an Euler–Maruyama scheme. The velocities at particle positions and the number densities at cell centres using particle locations are obtained using a linear interpolation scheme. Different boundary conditions that satisfy the no-flux criterion are possible for the GL equations (see e.g. Bearon et al. Reference Bearon, Hazel and Thorn2011; Maretvadakethope et al. Reference Maretvadakethope, Hazel, Vasiev and Bearon2023). We use a reflective boundary condition, and as we show later, obtain good agreement with the Eulerian simulations (GE equations).
The dimensionless numbers are the same as in § 4.1. The channel dimensions  $(2h,L)\equiv (2,8)$ are discretised with
 $(N_x,N_y)\equiv (256,64)$ points. For our GL simulations, we choose at least
 $N_p=4 N_x N_y$ particles. We keep
 $Ri=90$ fixed, and study the dynamics for different flow rates
 $Q$ and the Schmidt number
 $Sc$.
For the GE simulations, we initialise the flow and cell number density by setting
 \begin{equation} \omega({\boldsymbol x},0)=10^{{-}3} \cos\left[\frac{\rm \pi}{h} (y- h)\right]\quad {\rm and}\quad n({\boldsymbol x},0) = 1 + 10^{{-}2} \sin\left[\frac{\rm \pi}{h} (y- h)\right]. \end{equation}
For the GL simulations, the initial particle orientations  $\theta _{\alpha }$,
 $\alpha =1,\ldots, N_p$, are uniformly distributed in the interval
 $[0,2 {\rm \pi})$, and particle positions are uniformly distributed over the spatial domain.
4.3.2. Steady-state kinetic energy
We monitor the time evolution of energy, and observe that a steady state is reached with  $(Ri=90,Sc=17)$ for
 $t V_s/h>10$, and with
 $(Ri=90,Sc=80)$ it takes a longer time,
 $t V_s/h>400$. Qualitatively, this dependence on
 $Sc$ can be understood by noting that an unbounded homogeneous Stokesian system destabilises with a growth rate inversely proportional to the Schmidt number,
 $\omega V_s/h \propto Ri/Sc$ (Pedley Reference Pedley2010).
In figure 8, we show the time evolution of energy with different flow rates  $Q$ for
 $Sc=17$ and
 $80$ while maintaining
 $Ri=90$ fixed. Note the excellent agreement between the results obtained from the GE and GL equations. Next, we investigate the spatio-temporal structures for a range of flow rates.
Time evolution of the kinetic energy in the steady state for different values of flow rate  $Q$ and with
 $Ri=90,Sc=80$ (a), and
 $Ri=90,Sc=17$ (b).

4.3.3. Zero flow rate: $Q=0$

We show the evolution of the cell number density and the vorticity snapshots at different times obtained using the GL and GE simulations for  $Sc=80$ in figure 9, and
 $Sc=17$ in figure 10. We note that the two methods give very similar solution evolution. For
 $Sc=80$, the cells concentrate near one of the walls (depending on the initial perturbation), and we also observe varicose instability. The cells cluster and sink downwards (positive
 $x$ direction). The dynamics remains qualitatively similar for
 $Sc=17$, and along with the formation of blip-like structures, we also observe large-scale meandering flows.
Pseudo-colour plots showing the evolution of (a,c) the cell number density and (b,d) the vorticity fields, at different times for  $Q=0$,
 $Sc=80$, with (a,b) GL formalism, and (c,d) GE formalism.

Pseudo-colour plots showing the evolution of (a,c) the cell number density and (b,d) the vorticity fields, at different times for  $Q=0$,
 $Sc=17$, with (a,b) GL formalism, and (c,d) GE formalism.

4.3.4. Large positive $Q$

For  $Q=10$,
 $Sc=80$ and
 $Q=38$,
 $Sc=17$, the cells cluster around the centreline (
 $y=h$) where the most significant departure from the Poiseuille profile is observed (see figures 11(a) and 12(a)). In figures 11 and 12, we show the snapshots of the cell number density and the vorticity field in the steady state, and observe the formation of blips due to varicose instability. In both cases, we observe excellent agreement between Lagrangian and Eulerian formalism. Note that the analysis of Hwang & Pedley (Reference Hwang and Pedley2014b), which investigates only streamwise perturbations, does not predict this instability.
(a) Average vertical velocity  $\int u_x(x,y)\,{\textrm {d}x}/L$ for
 $Q=10$ obtained by using the GE formalism. Pseudo-colour plots showing the steady-state cell number density and the vorticity fields obtained by using (b) GE formalism and (c) GL formalism.

(a) Average vertical velocity  $\int u_x(x,y)\,{\textrm {d}x}/L$ at
 $x=L/2$ for
 $Q=38$ obtained by using the GE formalism. Pseudo-colour plots show the evolution of the cell number density and the vorticity fields at different times for
 $Q=38$ using (b) GL formalism and (c) GE formalism.

Although not explicitly shown, the flow structures are similar to the  $Q=0$ solution for small values, and resemble the large-
 $Q$ solution with increasing
 $Q$.
4.3.5. Negative $Q$

For  $Q<0$, the flow and organism preferred swimming direction are the same, upwards. Therefore, in the absence of buoyancy effects, the gyrotactic balance of gravitational and viscous torques would induce a mean biased swimming motion towards the walls. The plots in figure 13 show the time evolution of the cell concentration at different times for
 $Q=-12$ and
 $Q=-24$ with fixed
 $Sc=17$ using the GL approach. We observe that the cells accumulate close to the wall and start to form clumps, which at later times get peeled off from the wall due to an instability associated with their negative buoyancy, and are pulled up by the flow as they move towards the centre of the channel. The experiments of Kessler (Reference Kessler1985b) observed a similar mechanism. Note that we do not present the solution obtained from the GE equations for
 $Q<0$ because for this range of parameters, the numerical scheme is unable to conserve the average cell density. (When cells concentrate near the walls, extremely fine grids and accordingly extremely small time steps are needed, making numerical simulations prohibitive.)
Pseudo-colour plots showing the evolution of the cell number density at different times for negative flow rates, for (a)  $Q=-12$ and (b)
 $Q=-24$, with
 $Sc=17$ and the GL formalism.

5. Bioconvection in a Hele-Shaw cell
In previous sections, we have explored the non-trivial plume structures that emerge for various positive and negative flow rates in a two-dimensional vertical channel. As discussed earlier, a natural question arises as to whether we can effectively model confined bioconvection by making suitable approximations across the channel width.
Therefore, we now extend our study to a quasi-two-dimensional setting by investigating gyrotaxis in a Hele-Shaw set-up. To mimic experiments (see figures 1(b,c); Bees Reference Bees2020), we consider a rectangular domain of length  $2h=10 \,\textrm {cm}$, height
 $L=2.5 \,\textrm {cm}$, and width
 $w=1 \,\textrm {mm}$ inoculated with
 $n_0\sim 1.6 \times 10^6$ organisms (see figure 2c). This fixes
 $Ri=2520$, and the other parameters are kept the same as in previous sections. Since the confinement width is much smaller than the other two directions, we approximate its effect by adding a linear drag term
 $-\varGamma {\boldsymbol u}$ to (3.1a,b). Note that
 $\varGamma =12 {\mu }/w^2$ if a Poiseuille flow profile is assumed for the
 $z$ direction (Ruyer-Quil Reference Ruyer-Quil2001). Considering the variety of solutions discussed in the previous section, the validity of this linear drag approximation is indeed questionable. Nevertheless, we study gyrotaxis in a vertical Hele-Shaw cell employing this two-dimensional set-up with
 $\varGamma =0,2.5$ and
 $12$ (see figure 14). For
 $\varGamma =0$, we observe that the gyrotaxis instability is initiated early on in the simulation, and the number density plots show a complex spatio-temporal structure, with wavelength 6.7 mm at the top, and approximately 3 mm at the bottom, similar to an earlier numerical investigation by Hopkins & Fauci (Reference Hopkins and Fauci2002). We note the stark contrast with experiments where very ordered bottom standing plume structures are observed of wavelength 1.3 mm (and wavelength 4.7 mm at the top).
Pseudo-colour plots showing the time evolution of the cell number density at different times in a Hele-Shaw set-up for: (a)  $\varGamma =0$, (b)
 $\varGamma =2.5$, and (c)
 $\varGamma =12$.

In the presence of linear drag with  $\varGamma =2.5$, we find regularly spaced plumes (of wavelength 5.3 mm at the top) that are perhaps more similar to experiments. However, instead of forming bottom standing plumes, we observe that plumes break into stumpy secondary structures when approaching the bottom wall. Further increasing
 $\varGamma =12$ increases the regularity of the structures (wavelength 4.8 mm), but now almost all of the plumes are initiated by an overturning instability at the top, not a gyrotactic instability throughout the Hele-Shaw cell, and they are unable to reach the bottom wall during the duration of the simulation. Such a situation does arise in experiments, but for gradually tapered Hele-Shaw vessels rather than those with parallel walls (see figure 1d), suggesting that there is more occurring in the
 $z$ direction than anticipated.
Our simulations reveal that for intermediate values of drag  $\varGamma$, the concentration of organisms is similar but not identical to that observed in experiments; the dynamics near the bottom wall is very different. Furthermore, it is difficult to estimate the ‘best’ value of
 $\varGamma$, to tune the simulations to get something similar. This is likely due to the following three-dimensional effects. As the vessel is bounded at the top and bottom, the mean vertical flow rate is zero, such that we are within the regime where a range of symmetric and asymmetric solutions exists between the two walls of the Hele-Shaw cell (i.e. in the
 $z$ direction). In particular, we expect asymmetric and meandering structures to dominate, such as in figure 10. Therefore, the normal assumption of Poiseuille flow within the Hele-Shaw cell is unlikely to be appropriate. In addition, local upwelling flows are generated in at least half of the apparatus, so cells become closely associated with both channel walls. Thus they are not necessarily transported upwards by the flow in these regions, unless instabilities lead plumes of cells to peel off of the walls into the centre of the channel where they can be advected, such as in figure 13.
6. Conclusions
In this paper, we explore the role of confinement on the instabilities and dynamics of suspensions of gyrotactic microorganisms in two-dimensional channel flow and in Hele-Shaw cells, for parameters that are accessible experimentally. We tackle this problem using a combination of analytical techniques and two distinct numerical approaches, Eulerian and Lagrangian simulations. Remarkably, all three show excellent agreement, beyond our expectations. For the Lagrangian simulations, a range of boundary interaction rules can satisfy the no-flux conditions (Bearon et al. Reference Bearon, Hazel and Thorn2011; Maretvadakethope et al. Reference Maretvadakethope, Hazel, Vasiev and Bearon2023). Nonetheless, the results employing a reflective boundary condition closely match those from the Eulerian simulations. Note also that in situations where cells focus away from the boundaries, as is the case in downwelling flows, the exact choice of boundary condition is not expected to alter the results qualitatively.
We start by exploring confined gyrotactic bioconvection in a channel as a function of the non-dimensional flow rate as well as the Schmidt, Richardson and Péclet numbers. Using analytical approaches and numerical simulations for various flow rates, we have discovered the presence of asymmetric homogeneous solutions that coexist with symmetric solutions. Even for the case of a zero mean flow rate, we find asymmetric flow profiles. Surprisingly, two independent numerical simulation methods (from Lagrangian and Eulerian perspectives) reveal that for a realistic parameter range, the asymmetric flow solution is in fact more stable than the symmetric profile that is often assumed and has been widely investigated (Hwang & Pedley Reference Hwang and Pedley2014a). We show that all of the vertically homogeneous solutions closely obey a first integral, which we obtain by analysing the steady-state equations and confirm with simulations. The fact that asymmetric solutions emerge and can be more stable than symmetric solutions in a channel leads to the intriguing possibility that non-axisymmetric solutions could dominate in pipes under some flow conditions. However, to explore this scenario properly, fully three-dimensional analytical and numerical analyses are required, which will be a topic of future research.
Next, we explore time-dependent solutions with numerical simulations in a vertical channel geometry, and demonstrate the presence of complex spatio-temporal flow structures for a zero flow rate  $Q=0$. For
 $Q>0$, we verify the presence of a secondary varicose instability and the formation of travelling blips (Kessler Reference Kessler1985b; Hwang & Pedley Reference Hwang and Pedley2014a; Bees Reference Bees2020). For negative flow rates
 $Q<0$, we find that organisms migrate to the walls, as anticipated, but then this is followed by an instability that leads to structures that peel off from the walls and are transported upwards by the flow, later to migrate back to the walls.
Finally, we extend our numerical analysis by studying gyrotaxis in a vertical Hele-Shaw cell by using a quasi-two-dimensional setting with a linear drag to mimic confinement. Although some of the results bear a resemblance to the experimental results, it becomes necessary to attempt to fine-tune the simulations with the drag strength  $\varGamma$: not all features are correctly reproduced for a single value of
 $\varGamma$. In essence, ignoring the migration of organisms towards the walls in locally upwelling flows, and the complex, and typically asymmetric dynamics at slow flow rates, leads to unsatisfactory results. We are not able to fully capture bioconvection and plume dynamics in a vertical Hele-Shaw cell with a two-dimensional approximation, strongly suggesting that commonly adopted symmetry assumptions in confined geometries in the literature, and their induced flow profiles are not appropriate. Therefore, naive averaging is not correct, and we argue that it is essential to perform a full three-dimensional study to understand the effect of confinement in these active suspensions.
Our study motivates future investigations of active matter in simple confined geometries, particularly at the dilute end of the spectrum.
Acknowledgements
We offer our sincerest gratitude to J.O. Kessler, posthumously, for permission to use the images in figure 1 from experiments (joint with M.A.B.) conducted during a visit to the University of Glasgow. John inspired a generation of researchers to explore gyrotactic bioconvection problems with his seminal studies of the phenomena in the 1980s (Kessler Reference Kessler1985b).
Funding
P.P. acknowledges support from the Department of Atomic Energy (DAE), India under project identification no. RTI 4007, and DST (India) project nos MTR/2022/000867 and DST/NSM/R&D HPC Applications/Extension/2023/08. P.P. would like to thank the Isaac Newton Institute for Mathematical Sciences, Cambridge, for support and hospitality during the programme ‘Anti- diffusive dynamics: from sub-cellular to astrophysical scales’, where part of the work on this paper was undertaken, supported by EPSRC grant no. EP/R014604/1. All the simulations are performed using the HPC facility at TIFR Hyderabad.
Declaration of interests
The authors report no conflict of interest.