While previous work has shown that the Centers for Disease Control and Prevention (CDC) toolkit for carbapenem-resistant Enterobacteriaceae (CRE) can reduce its spread,Reference Lee, Bartsch and Wong 1 , Reference Slayton, Toth and Lee 2 decision makers want to know whether the benefits outweigh the cost and at what point. Moreover, CRE are considered an urgent public health threat, 3 and a single CRE infection in the United States can cost society up to $83,512.Reference Bartsch, McKinnell and Mueller 4 Our previous work demonstrated that 1 part of the CDC CRE toolkit (ie, active screening of interfacility transfers with subsequent contact precautions) was better than measures currently used in most healthcare facilities (eg, contact precautions only for known carriers) in a region where CRE is newly emerging.Reference Lee, Bartsch and Wong 1 The CDC CRE toolkit can be implemented in 2 ways: in individual facilities or in a coordinated regional fashion. In the first approach, each hospital implements the toolkit after identifying a given number of cases. Because each hospital makes a decision irrespective of other facilities, these are “uncoordinated approaches.” In the second approach, all hospitals across the region implement the toolkit when a given number of hospitals have identified 1 CRE case (eg, 1, 10, or 20 hospitals with at least 1 case of CRE), a “coordinated approach.” We found that these CRE control measures averted up to 77% of transmission events by year 5; however, coordinated regional approaches achieved greater reductions in CRE prevalence than when healthcare facilities acted alone in an uncoordinated manner.Reference Lee, Bartsch and Wong 1
While these measures avert cases, saving disease-related costs, they are each associated with different intervention and implementation costs (eg, communication for regional control). It has not yet been determined how much could be invested in CRE prevention and control in a region and at what point it becomes worthwhile from an economic standpoint. Decision makers such as insurance companies, hospital administrators, and health departments want to know when the various implementations of the CRE toolkit become cost-effective and cost-beneficial, and what the key drivers are. To answer these questions, we use a computational simulation model to evaluate the costs, effectiveness, cost-benefit, and cost-effectiveness of the CDC CRE Toolkit in Orange County, California. Our simulation used our Regional Healthcare Ecosystem Analyst (RHEA)-generated model of all the inpatient healthcare facilities and their surrounding communities in this area.
METHODS
Our custom-designed RHEA softwareReference Lee, Wong and Bartsch 5 creates a detailed agent-based model (ABM) of all healthcare facilities in a region to better understand the spread and control of infectious pathogens. We used RHEA to generate an ABM of all healthcare facilities (n=102) in Orange Country, California (RHEA-OC), and we simulated the spread of CRE.Reference Lee, Bartsch and Wong 1 We adapted our CRE clinical and economics outcomes modelReference Bartsch, McKinnell and Mueller 4 to include interventions to determine the cost of CRE infection in Orange County. The clinical and economic model translated the number of CRE carriers and infection control measures used into CRE infections and their associated costs and health effects from the hospital, third-party payer, and societal perspectives. The Appendix provides further details for both the RHEA-OC Model and CRE Clinical and Economics Outcomes Model, while the Appendix Table shows the model input parameters, values, and sources.
For each scenario, we calculated both its cost-benefit and incremental cost-effectiveness ratio (ICER), as follows:
 $$\eqalignno{ {\rm Cost}{\hbox-}{\rm Benefit }{\equals}{\rm } & {\rm Benefit }-{\rm Cost}{\equals}{\rm Direct}\,{\rm Cost}\,{\rm and}\,\cr& {\rm Productivity}\,{\rm Losses}\,{\rm of}\,{\rm Averted}\,\cr& {\rm Infections }-{\rm } {\rm Cost}\,{\rm of}\,{\rm Intervention} $$
 $${\rm ICER}{\equals}{{{\rm Cost}_{{{\rm CRE \,Control}}} -{\rm Cost}_{{{\rm Baseline}}} } \over {{\rm Health}\,{\rm Effects}_{{{\rm Baseline}}} -{\rm Health}\,{\rm Effects}_{{{\rm CRE \,Control}}} }}$$
where health effects were measured in quality-adjusted life years (QALYs). All past and future costs and future QALYs were discounted to 2017 US dollars using a 3% discount rate. The ICERs were considered cost-effective with a threshold of $50,000 per QALY saved.
Simulations and Scenarios
Our baseline scenario assumed routine control measures of contact precautions for patients identified as CRE carriers (either newly identified from clinical cultures or those with a known history of CRE). Contact precautions were estimated to reduce transmission by 50%.Reference Lee, Bartsch and Wong 6 Different scenarios modeled CRE interventions specified the CDC CRE toolkit. Briefly, we implemented admission surveillance testing (ie, rectal screening) for patients directly transferred to hospitals or long-term acute-care facilities from another hospital or nursing home. Those patients who tested positive were placed under contact precautions, as were those with a prior history known to that institution. These scenarios were evaluated in an uncoordinated and coordinated manner, as described above.Reference Lee, Bartsch and Wong 1 Uncoordinated approaches simulated scenarios in which each individual hospital acted independently, and CRE control measures were implemented when they identified 1, 10, or 20 CRE cases were identified in their facility.
For each scenario, the number of screened patients, carriers, and transmission events from RHEA-OC were simulated (ie, an average of 50,000 iterations) in the clinical and economic model using Monte Carlo techniques (consisting of 1,000 trials) varying the distributions throughout their ranges. All results reported are mean and 95% credibility range (95% CR) over the 10 simulated years (median values are available in Appendix Table 2). The sensitivity analysis varied the trigger thresholds (1, 10, and 20), the probability of CRE infection given colonization (5% to 45%Reference Borer, Saidel-Odes and Eskira 7 , Reference Debby, Ganor and Yasmin 8 ), and the attributable mortality of CRE (26%–44%Reference Falagas, Tansarli, Karageorgopoulos and Vardakas 9 ). Additional sensitivity analyses excluded time and wages for nurses and technicians (ie, excluded labor costs) and varied hospitalization and bed day costs by ±20%.
RESULTS
Costs From the Hospital Perspective
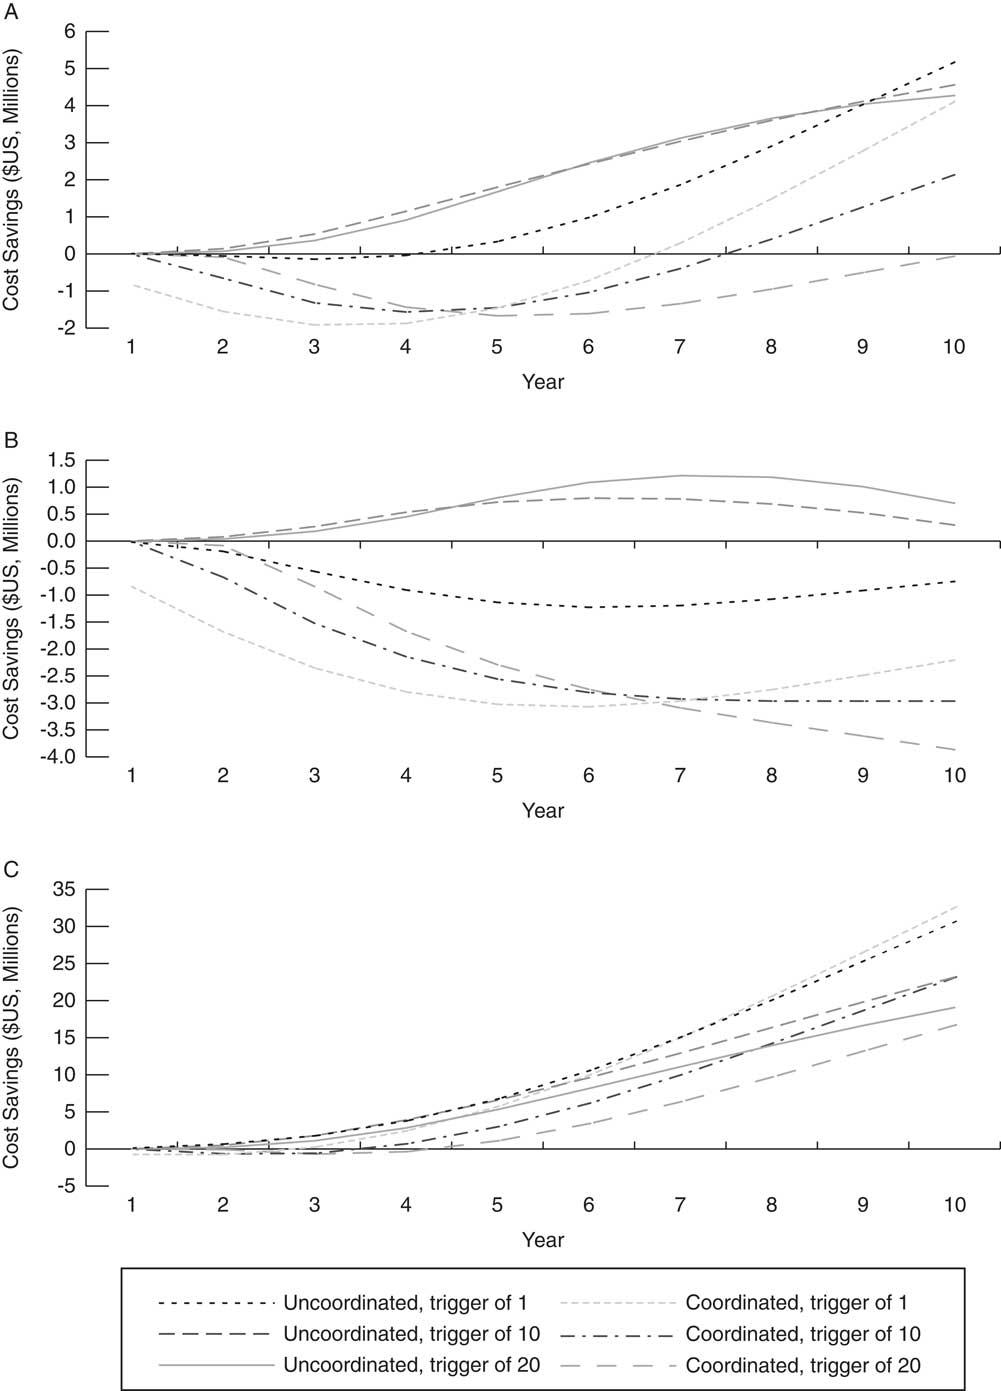
Figure 1a shows the cumulative cost savings for each scenario compared to routine control measures over time (5% probability of infection, 35% attributable mortality). While all uncoordinated approaches generated cost savings after 1 year, only a trigger threshold of 10 and 20 CRE cases garnered cost savings in each of the 10 simulated years. With a trigger of 1, uncoordinated approaches again garnered savings in year 5, and by year 10 they saved a cumulative $5.2 million (95% CR, $5.0–$5.4 million). Coordinated regional approaches were more costly than routine control measures until year 7 (trigger of 1 becomes cost-saving) but save up to $4.1 million (95% CR, $3.9–$4.3 million) over 10 years.
Cumulative cost savings of carbapenem-resistant Enterobacteriaceae (CRE) control measures with various triggers compared to routine control measures (A) from the hospital perspective, (B) from the third-party payer perspective, and (C) from the societal perspective. The model assumes a base case of 5% probability of infection and 35% attributable mortality.

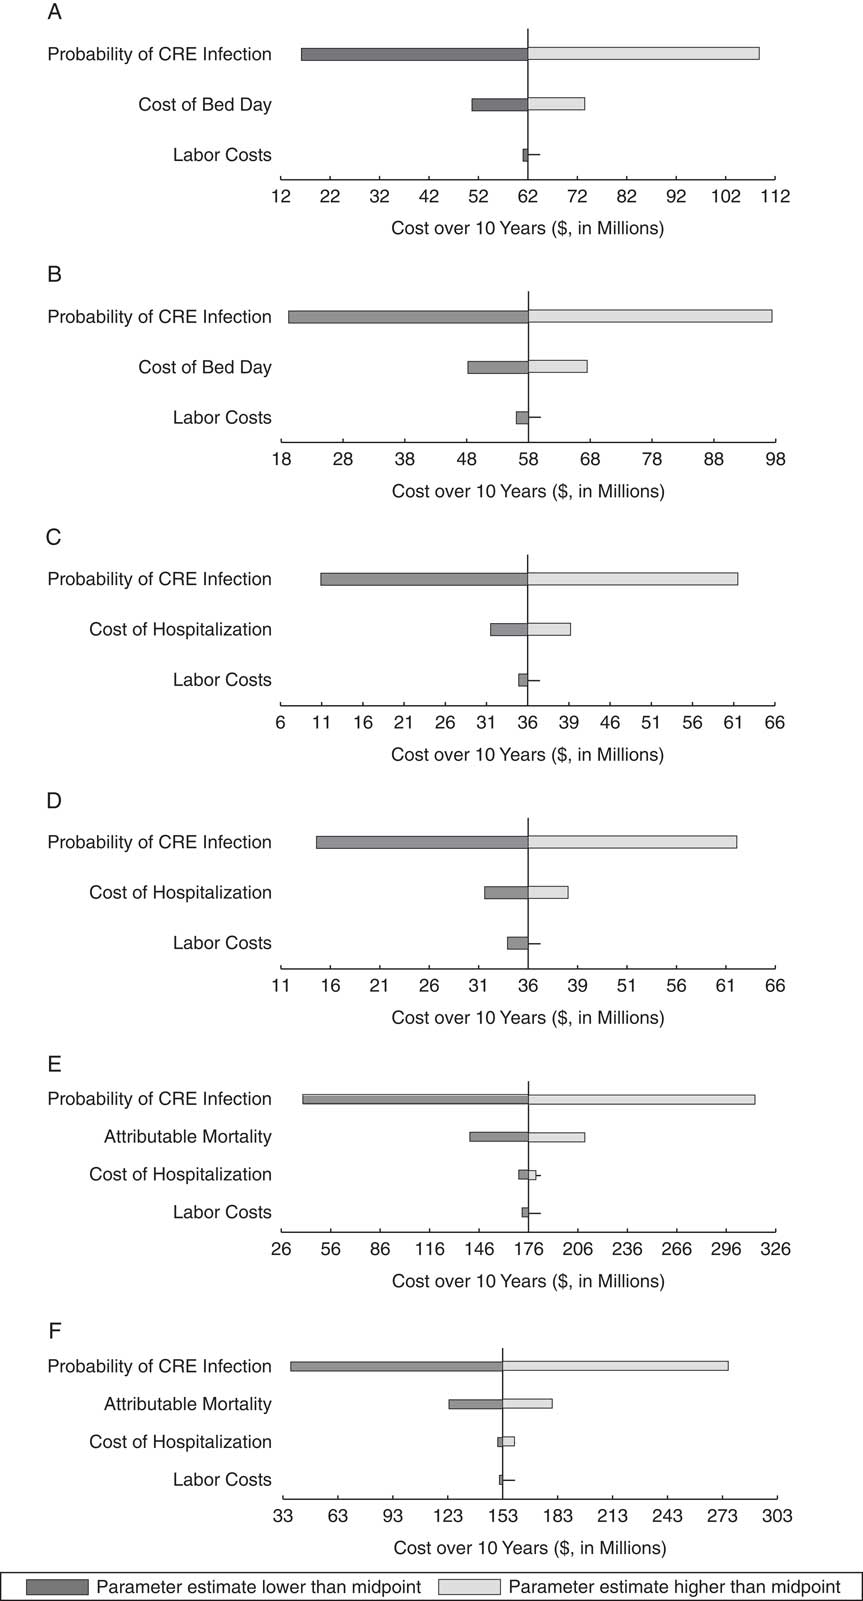
Figure 2 shows the impact of parameters varied in sensitivity analyses on uncoordinated and coordinated approaches with a trigger of 10. The probability of CRE infection had the largest impact on costs (Figure 2a and 2b). The order of parameter impact on total costs was the same for the other triggers; however, the magnitudes differed (eg, ranging from $15.7–$122.0 million, 5%–45% probability of infection, across all triggers and approaches). Increasing the probability of infection decreases the time at which cost savings appear (all approaches by year 4), increases the amount of savings, and results in a change the best intervention scenario. With a 25% probability of infection, uncoordinated approaches with a trigger of 1 generated the greatest cost savings for years 1–6 (up to $21.0 million) then switches to coordinated approaches with a trigger of 1, saving ($60.9 million; 95% CR, $60.1–$61.7 million over 10 years). Thus, $278,000 could be invested in coordination during the 7-year period for this approach to break even. Excluding labor costs resulted in a similar trend in the time to and amount of cost savings, with uncoordinated approaches resulting in larger savings (saving up to $6.5 million; 95% CR, $5.7–$7.4 million over 10 years with a trigger of 1). Coordinated approaches (trigger of 1) resulted in saving $6.0 million (95% CR, $5.8–$6.1 million) over 10 years, more than uncoordinated approaches with triggers ≥10 ($5.6 million saved; 95% CR, $4.6–$6.5 million).
The impact of parameters varied in sensitivity analyses on uncoordinated and coordinated approaches with a trigger of 10 from (A) the hospital perspective with an uncoordinated approach, (B) the hospital perspective with a coordinated approach, (C) the third-party payer perspective with an uncoordinated approach, (D) the third-party payer perspective with a coordinated approach, (E) the societal perspective with an uncoordinated approach, and (F) the societal perspective with a coordinated approach. The vertical line shows the total cost over 10 years when all parameters on the y-axis are held at their midpoint values. The width of the bar represents the variability in total cost when the parameter is ranged from its minimum to maximum.

Costs From the Third-Party Payer Perspective
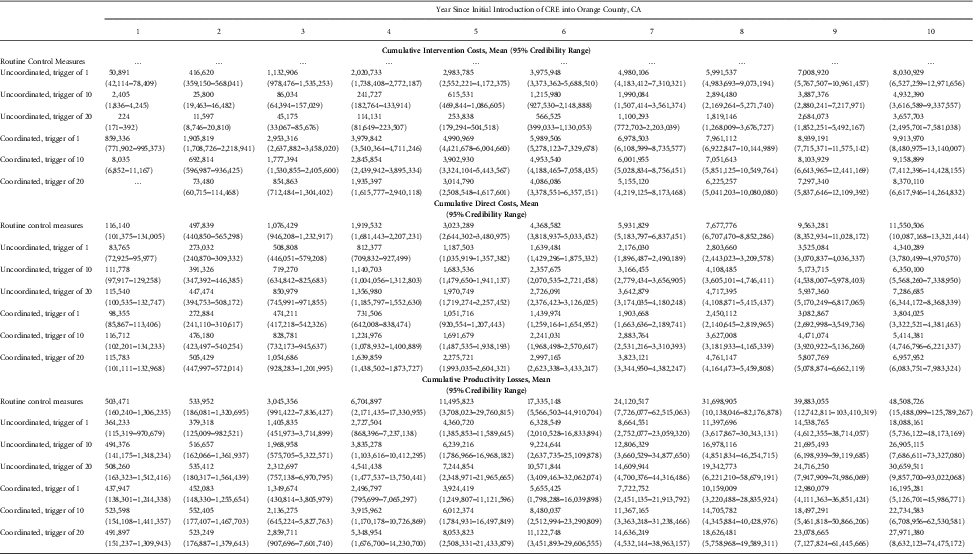
As Figure 1b shows, most CRE control measures never save costs from the third-party payer perspective, and only an uncoordinated approach with a trigger of 10 generated cost savings during year 1. Table 1 shows the breakdown of cumulative costs, where the sum of the intervention cost and the direct cost represent costs to third-party payers. Figure 2 (c and d) shows the impact of key parameters. While the parameter rank did not change for other trigger thresholds, total cost ranged from $12.2 to $70.3 million (when varying the probability of infection). With a 25% probability of infection uncoordinated approaches with a trigger of 1 and 10 lead to cost savings ($21,000–$116,000) during year 1, while coordinated approaches resulted in cost savings by year 3 (saving $73,000 with a trigger of 1). Varying the cost of hospitalization only increased or decreased the total cost by ≤$5.2 million (Figure 2).
Breakdown of Cumulative Costs for Carbapenem-Resistant Enterobacteriaceae (CRE) Control Strategies Over TimeFootnote a

NOTE. Uncoordinated approaches, each individual hospital acted independently and implemented active screening of interfacility transfers followed by contact precautions when they identified the trigger number of cases in their facility; coordinated regional approaches, all hospitals in the region implement control measures when a trigger number of hospitals in a region identified at least 1 CRE case in their facility
a Assuming base case with 5% probability of infection and 35% attributable mortality. Sum is total cost from societal perspective, while intervention costs plus direct costs is total cost from third-party payer perspective
Productivity Losses
Table 1 shows cumulative productivity losses, as well as when control approaches result in lower productivity losses compared to routine control measures. Productivity losses increased proportionally with an increase in the probability of infection (ie, were 5 times higher with a 25% probability of infection) and were ~1.2 times higher when increasing the attributable mortality to 45%.
Costs From the Societal Perspective
The sum of all costs gives total societal costs (Table 1). Only uncoordinated approaches with a trigger of 1 or 10 generated cost savings during year 1 (trigger of 1: $119,210; 95% CR, $92,765–$145,655) (Figure 1c). The pattern for the approach accruing the greatest cost savings varies; however, by year 7, coordinated approaches with a trigger of 1 generated the largest cost savings, yielding savings of $32.6 million (95% CR, $30.3–$34.9 million) over 10 years. The next best approach (uncoordinated with a trigger of 1) would save $30.7 million (95% CR, $28.4–$33.0 million) over 10 years. The cost difference between strategies in any given year is what could be invested into that strategy over the period and still break even. For example, $540,000 could be invested into coordination over an 8-year period for coordinated approaches to break even with uncoordinated approaches (trigger of 1).
The probability of infection followed by attributable mortality were the largest drivers of total cost (Figure 2e and 2f). Across all triggers, the total cost ranged from $29.8 to $337.4 million (5%–45% probability of infection). With a 25% probability of infection (35% attributable mortality), only uncoordinated approaches garnered cost savings in year 1 (trigger of 1 and 10, saving $145,565–$843,520). Uncoordinated approaches at a trigger of 1 provided the most cost savings through year 4 ($27.4 million in 4 years) before switching to coordinated approaches (trigger of 1) for the next 6 years (during years 5–10, saving $197.5 million; 95% CR, $186.3–$208.7 million over 10 years). Increasing CRE’s attributable mortality to 44% (5% probability of infection) resulted in uncoordinated approaches (trigger of 1 and 10) saving costs in year 1, while it took at least 3 years for a coordinated approach to generate savings. Excluding labor costs, all uncoordinated approaches generated cost savings in year 1 and garnered the largest cost savings during years 1–7 (trigger of 1, ≤$17.4 million compared to routine control measures). Coordinated approaches with a trigger of 10 resulted in savings in year 1, with all triggers generating savings in year 2. With a trigger of 1, coordinated approaches saved the most during years 8–10 (saving $34.4 million; 95% CR, $32.2–$36.6 million over 10 years).
Cost-Effectiveness and Cost-Benefit
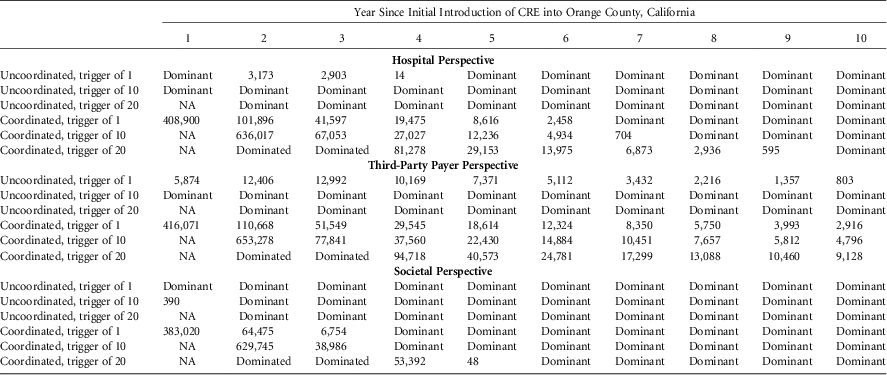
Table 2 shows the incremental cost-effectiveness for cumulative costs and health effects for each scenario compared to routine control measures for each perspective. From the hospital perspective, it took a few years for approaches to become cost-effective (eg, coordinated trigger of 1 in year 3), while all become dominant (ie, cost less and save health effects) compared to the baseline by year 10. The time until cost-effective is faster from the societal perspective, with all becoming dominant compared to the baseline by year 6. Overall, uncoordinated approaches tended to be more cost-effective than coordinated approaches.
Cumulative Cost-Effectiveness (Cost per QALY Saved) for Each Scenario Compared to No Specific Control Measures From Each PerspectiveFootnote a

NOTE. CRE, carbapenem-resistant Enterobacteriaceae; ICER, incremental cost-effectiveness ratio; QALY, quality-adjusted life year; NA, no ICER value because no QALYs are saved; dominant, strategy is less costly and provides health benefits compared to no specific CRE control measures; dominated, strategy is more costly and does not provide health benefits compared to no specific CRE control measures; uncoordinated approaches, each individual hospital acted independently and implemented active screening of interfacility transfers followed by contact precautions when they identified the trigger number of cases in their facility; coordinated regional approaches, all hospitals in the region implement control measures when a trigger number of hospitals in a region identified at least 1 CRE case in their facility.
a Assuming base case with 5% probability of infection and 35% attributable mortality.
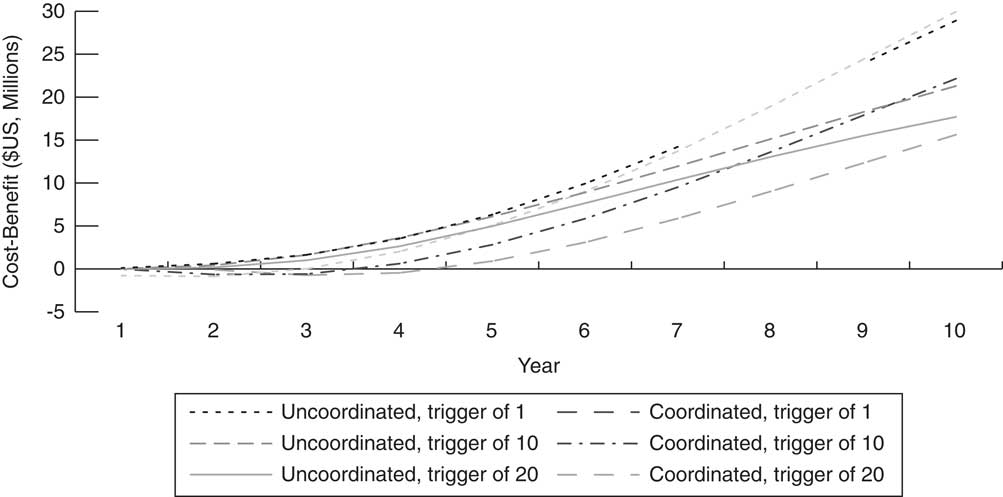
Figure 3 shows the cumulative cost-benefit of CRE control approaches each year and which strategies garner the largest cost-benefit over time (for the base case 5% probability of infection and 35% attributable mortality). The approach yielding the highest cost-benefit varied with the probability of infection and attributable mortality. For example, uncoordinated approaches with a trigger of 1 yielded the highest cost-benefit by year 5 with a 44% attributable mortality (5% and 25% probability of infection), while coordinated approaches with a trigger of 1 yielded the highest cost-benefit with a 45% probability of infection, regardless of the attributable mortality.
Cost-benefit over time compared to no specific carbapenem-resistant Enterobacteriaceae control measures from the societal perspective (5% probability of infection; 35% attributable mortality).

DISCUSSION
We found that both coordinated and uncoordinated regional approaches involving implementation of active screening of interfacility transfers per the CDC CRE toolkit generated cost savings within a few years of implementation across a wide variety of thresholds for when the intervention should begin. Uncoordinated approaches tended to garner cost savings during year 1 for all perspectives but not for all trigger thresholds. Coordinated approaches with lower trigger thresholds are more robust and generate larger cost savings over time. However, the savings take longer to manifest because these approaches tend to cost more upfront; the additional intervention costs for all hospitals are not outweighed by the averted cost of CRE infections in the first few years. Either implementation could save up to $5.5–$25.3 million over time from the hospital and societal perspectives. Additionally, CRE control approaches garnered health benefits, thus in many situations, approaches were found to be economically dominant. This finding should be a prime motive for implementation because most infection prevention and control measures require additional costs to result in health benefits.
As the prevalence of CRE rises, 10 – Reference Thaden, Lewis and Hazen 13 it is important to consider investment in infection control and prevention measures for CRE. Our results show that CRE control measures are economically worthwhile, when returns are achieved, and how it varies by strategy overtime; this shows how much can be invested into prevention and control measures. Both uncoordinated and coordinated CRE control approaches generated substantial cost savings (eg, millions of dollars) over time. While these savings are above the cost of the interventions, they do not include any costs necessary to implement such interventions. The cost ceiling between 2 strategies is the amount that can be spent on additional implementation costs. For example, what could be spent on coordination? For regional approaches, this may require the use of a database, registry, or public health entity to coordinate CRE control actions, and for uncoordinated approaches, it may require informing on the part of public health when to activate screening. If the costs to implement and maintain these are less than the costs for routine control measures (or any other strategy), the overall approach will still generate cost savings. Decision makers can use our results to determine investment for the approach that best fits their situation.
While routine screening for CRE is not commonly performed given that CRE is generally rare, it would likely result in higher total costs than either uncoordinated and coordinated approaches with a trigger of 1 but would garner similar health effects. Therefore, routine screening as a baseline would likely increase the cost-effectiveness of both uncoordinated and coordinated approaches. Routine screening would be affected by communication of CRE status and subsequent use of contact precautions. Although we assume 100% communication on direct transfer, a patient’s CRE status is not always communicated to other healthcare facilities despite being in an age of capable electronic communication. In the absence of an accepted standard for the transfer of CRE information between facilities, this is often done manually and may not be reliable.Reference Kim, Segreti, Tomich, Tongma, Hayden and Lin 14 Thus, our results highlight the value of having foresight in implementing infection prevention and control measures. Economically effective decisions involve investing early in the epidemic of an emerging pathogen such as CRE, instead of waiting until more cases accrue. Investment can often be difficult to justify when cases are few; however, our model helps identify meaningful thresholds at which investment can be cost-effective and cost-beneficial, and it shows when cost savings can occur.
Our model was conservative regarding the costs and health effects of CRE infections. For example, we did not adjust attributable length of stay for carbapenem resistance, which may further increase a patient’s length of stay, nor did we include costs associated with patient movement, such as transportation of a nursing home resident to a hospital. While our model represents a large diversity of facility types and sizes and serves a diverse population, cost-effectiveness may vary for regions in which CRE is already endemic; however, it may be similar for regions with a similar epidemiology (ie, where CRE is an emerging infection).
Our study has several limitations. All models, by definition, are simplifications of realityReference Lee 15 and therefore cannot account for every possible event or outcome. We did not consider any costs that may be incurred outside the duration of hospitalization (eg, continued treatment or home healthcare). We used utility values associated with each outcome, but they are not CRE specific, nor did we adjust for CRE that may lead to more severe outcomes. Our model drew from literature of varying quality, and results may change as better data become available. Our estimated costs to Orange County are subject to additional limitations from the RHEA model, such as minimal community transmission, exclusion of pediatric facilities and their patients, and the inability to evaluate high-risk patient characteristics that may drive transmission (eg, ventilator use or other comorbidities).
Implementing either uncoordinated and coordinated approaches to CRE control was cost-effective in all scenarios explored and often resulted in cost savings of millions of dollars within 10 years. Although implementing active screening of interfacility transfers followed by contact precautions cost more than routine control measures, uncoordinated approaches generally garnered cost savings within 1 year, while coordinated regional approaches garnered cost savings between year 4 and 7, depending on perspective. While it took longer for regional approaches to manifest savings, they tended to accumulate greater savings over time.
ACKNOWLEDGMENTS
Computing resources were provided by the University of Pittsburgh Center for Research Computing. The funders had no role in the design and conduct of the study; collection, management, analysis, and interpretation of the data; or preparation, review, or approval of the manuscript.
Financial support: This study was supported by the Agency for Healthcare Research and Quality (AHRQ grant no. R01HS023317), the CDC SHEPheRD (Task Order 2015-05), MIDAS National Institute of General Medical Science (NIGMS) via grant U24GM110707, the Eunice Kennedy Shriver National Institute of Child Health and Human Development (NICHD) Office of Behavioral and Social Sciences Research (OBSSR) and the Global Obesity Prevention Center (GOPC) (grant no. U54HD070725 and NICHD grant no. U01HD086861).
Potential conflicts of interest: No authors are aware of any significant conflict of interest.
SUPPLEMENTARY MATERIAL
To view supplementary material for this article, please visit https://doi.org/10.1017/ice.2018.49.