Implications
This study confirms that residual feed intake (RFI) is a measure of feed efficiency that is independent of BW and level of production in beef cattle. Additionally, carcasses of low RFI bulls were associated with an improvement in economically important traits such as kill-out proportion, carcass conformation score and predicted meat proportion. Weight of the reticulo-rumen, may be a biologically significant contributory factor to variation in RFI however, further research on the efficiency of metabolic processes within the splanchnic tissues between animals of high and low RFI is warranted.
Introduction
Selection for feed efficient cattle is a way of improving profitability and also decreasing negative environmental effects of beef production (Arthur et al., Reference Arthur, Herd and Basarab2010). A 10% improvement in feed efficiency generates more profit for beef producers than an equivalent improvement in rate of gain (Ahola and Hill, Reference Ahola and Hill2012), as a consequence of the large proportion of variable costs of production accounted for by feed (Finneran et al., Reference Finneran, Crosson, O’Kiely, Shalloo, Forristal and Wallace2010). Residual feed intake (RFI), defined as the difference between actual and expected feed intake, based on weight and growth, is a measure of feed efficiency that is independent of growth rate and mature body size (Crews, Reference Crews2005). As a result, RFI is becoming the concept of choice for studying physiological mechanisms underlying variation in feed efficiency in beef cattle (Herd and Arthur, Reference Herd and Arthur2009; Berry and Crowley, Reference Berry and Crowley2013). Herd and Arthur (Reference Herd and Arthur2009) suggested that processes contributing to observed variation in RFI are associated with intake and digestion of feed, tissue metabolism, activity and thermoregulation, but these factors explain only about 70% of the variation in RFI.
The gastrointestinal tract (GIT) and liver are important energy sinks using a disproportionate amount of energy relative to their weight. The GIT and liver, while accounting for ~7% and up to 2.5% of BW, respectively, consume in the order of 18% and 25%, respectively, of total oxygen consumption by the body (McBride and Kelly, Reference McBride and Kelly1990). Consequently, the size of these organs may influence energy requirements for basal metabolism. In particular the GIT was found to increase in size and energy requirements with increasing level of feed intake (Johnson et al., Reference Johnson, Johnson and Baldwin1990) due to greater volume of digesta and supply of nutrients (Ortigues and Doreau, Reference Ortigues and Doreau1995). However, the very limited published literature examining the contribution of visceral organs to variation in RFI is equivocal. In steers offered a high concentrate diet, Basarab et al. (Reference Basarab, Price, Aalhus, Okine, Snelling and Lyle2003) found that low RFI steers had lighter weights of stomach complex, intestines and liver than high RFI steers, whereas Richardson et al. (Reference Richardson, Herd, Oddy, Thompson, Archer and Arthur2001), Mader et al. (Reference Mader, Montanholi, Wang, Miller, Mandell, McBride and Swanson2009) and Cruz et al. (Reference Cruz, Rodriguez-Sanchez, Oltjen and Sainz2010) found no effect of RFI on any of the visceral organ weights recorded. Therefore, the objectives of this study were to examine the effects of phenotypic RFI on digestion, rumen fermentation variables, body composition measurements, carcass traits and visceral organ weights in beef bulls offered a high concentrate diet.
Material and methods
All procedures involving animals in this study were conducted under an experimental licence from the Irish Department of Health and Children in accordance with the cruelty to Animals Act 1876 and the European Communities (Amendment of Cruelty to Animals Act 1876) Regulation 2002 and 2005 (http://www.dohc.ie/other_health_issues/pausp).
Animals and feeding management
A total of 67 beef bulls over 3 years were used comprising 20, 33 and 14 bulls in years 1, 2 and 3, respectively. They were the progeny of spring-calving cows bred to Simmental sires as described by Lawrence et al. (Reference Lawrence, Kenny, Earley, Crews and McGee2011). They were single suckled with their dam at pasture and following weaning, were housed within pens in a slatted floor shed. In year 1, animals were accommodated in pens of 7 animals/pen (lying area=2.82 m2/animal) and in years 2 and 3, animals were accommodated in pens of 4 to 6 animals/pen (lying area=2.53 m2/animal). They received grass silage ad libitum and 2 kg of barley-based concentrates per head daily over 133 days as a ‘store’ or ‘back-grounding’ period before a finishing period on a high concentrate diet. This is a typical bull production system practiced commercially in Ireland (O’Riordan et al., Reference O’Riordan, Crossan and McGee2011). The RFI measurement period was carried out during the finishing phase.
At the end of the back-grounding phase, the concentrate (860 g/kg rolled barley, 60 g/kg soya bean meal, 60 g/kg molasses and 20 g/kg minerals per vitamins) proportion in the diet was increased gradually until available ad libitum (offered at ~1.1 times the intake of the previous day on an individual animal basis), while concurrently, the silage proportion was reduced to 3 kg fresh weight. The bulls were fed once daily (0800 h). A minimum grass silage allowance was offered to aid normal rumen function and rumination behaviour. All animals had continuous access to clean fresh drinking water. Individual feed intakes were recorded daily using electronically controlled Calan gates (American Calan Inc., Northwood, NH, USA). Bulls had an acclimatisation period of 14 days to the ad libitum feeding regime and test facilities before the experimental recording period, which lasted for 105 days (101, 107 and 108 days in years 1, 2 and 3, respectively), commenced. Mean age at the start of the RFI measurement period was 426 days (s.d.=43.1).
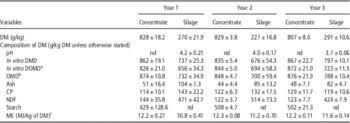
Concentrates and silage offered were sampled three times weekly and samples were stored at −20°C pending laboratory analysis. Samples of concentrates and silage were subsequently pooled on a weekly basis for dry matter (DM) determination and on a 3-week basis for chemical analysis. Concentrate samples were dried in an oven with forced-air circulation at 98°C for 16 h for DM determination and forage samples dried at 40°C for 48 h. Composited silage and forage samples for chemical analysis were oven dried at 40°C for 48 h and then ground through a 1-mm screen (Willey mill, Arthur H. Thomas, Philadelphia, PA, USA) for analysis of in vitro DM digestibility (DMD) and in vitro organic matter digestibility (OMD) (Tilley and Terry, Reference Tilley and Terry1963), for NDF and ADF using amylase (Van Soest et al., Reference Van Soest, Robertson and Lewis1991) and ash content by combustion at 550°C for 5 h. The CP (N×6.25) content was determined using a Leco FP 428 N analyser (St. Joseph, MI, USA) based on AOAC (1990) method 990-03, with starch content of the concentrate only, determined according to the method of McCleary et al. (Reference McCleary, Gibson and Mugford1997). The metabolisable energy concentration of the grass silage and concentrates was calculated based on equations 134 and 142, respectively, of Agriculture and Food Research Council (AFRC, 1993). The ingredient, chemical composition and in vitro DMD of the concentrates are outlined in Table 1.
Chemical composition of concentrate offered to bulls during the RFI measurement period (mean±s.d.) in years 1, 2 and 3

RFI=residual feed intake; DM=dry matter; DMD=dry matter digestibility; DOMD=digestible organic matter in dry matter; OMD=organic matter digestibility; ME=metabolisable energy.
a Digestible OM in the total DM, measured in vitro.
b OM digestibility, measured in vitro.
c Estimated based on in vitro OMD in total DM for grass silage and for concentrate (AFRC, 1993).
BW, body measurements and blood metabolites
Animals were weighed (before feeding) and body condition score (BCS) using the 5-point scale described by Lowman et al. (Reference Lowman, Scott and Somerville1976) was recorded on 2 consecutive days at the beginning and end and, every 21 days during the RFI measurement period.
Bulls were ultrasonically scanned at the beginning and end of the RFI measurement period. A dynamic real-time scanner (year 1 model – Concept MLV, with 3.5 MHz linear array transducer, Hitachi Aloka Medical Ltd, Tokyo, Japan; year 2 model – Aquila Vet with 3.5 MHz transducer probe, Esaote Pie Medical, Pie Medical Equipment B.V., Maastricht, the Netherlands; and year 3 model – Honda HS 2000 with 2 MHz transducer probe, Honda Electronics Co., Ltd., Toyohashi, Japan) was used to measure M. longissimus dorsi (LD) depth at the 3rd lumbar vertebra, and fat depth at the 3rd lumbar vertebra, the 13th thoracic rib and the rump (P8 site) on the animal’s right side as described by Conroy et al. (Reference Conroy, Drennan, Kenny and McGee2010a). At the time of ultrasound scanning, linear body measurements, height at the withers, chest circumference, chest depth and width of pelvis were determined on each animal using a callipers or tape, as appropriate (Campion et al., Reference Campion, Keane, Kenny and Berry2009), to provide a quantitative measurement of skeletal size. At the beginning and end of the RFI measurement period visual muscular scores were assigned to each animal, by the same two trained assessors. The three scoring locations were roundness of hind-quarter, width of hind-quarter and width and depth of loin; on a scale of 1 (hollow, poor muscle development) to 15 (wide, heavily muscled) as described by Conroy et al. (Reference Conroy, Drennan, Kenny and McGee2010a). For each location the scores for both assessors were averaged to give one mean score per location.
Blood samples were obtained by jugular venipuncture from each animal during the RFI measurement period, before feeding on d 14, 49 and 101 in year 1, day 2, 52 and 107 in year 2, and day 1, 50 and 108 in year 3 (referred to as initial, middle and end blood sampling days) during the RFI measurement period. On each occasion blood was collected into a 9- and 4-ml evacuated tube containing lithium heparin and sodium fluoride-EDTA K3, respectively, as anticoagulants (Greiner Vacuette; Cruinn Diagnostics, Dublin, Ireland). Concentrations of albumin, urea, globulin, total protein, β-hydroxybutyrate, glucose, non-esterified fatty acids (NEFA), triglycerides and creatinine were determined according to Lawrence et al. (Reference Lawrence, Kenny, Earley, Crews and McGee2011).
Rumen fermentation and total tract digestibility
Ruminal fluid samples were obtained from each animal once, on d 86, 66 and 78 in years 1, 2 and 3, respectively, of the RFI measurement period. Samples of ~20-ml volume were collected using a stomach tube (trans-oesophageal sampler – Flora Rumen Scoop; Profs-Products, Guelph, Canada) between 2 and 4 h post feeding. Ruminal fluid pH was measured immediately after collection, using a digital pH meter (Orion SA 720; Thermo Fisher Scientific, Waltham, MA, USA) and the 20-ml sample was preserved with 0.5-ml of 9 M sulphuric acid and stored at −20 °C. Ruminal fluid samples were analysed for NH3 and lactic acid and concentrations of volatile fatty acids (VFA) (acetic, propionic, butyric and valeric) using the methods described by Owens et al. (Reference Owens, McGee and Boland2008).
Total tract digestibility coefficients were determined for each animal during the RFI measurement period using the indigestible acid insoluble ash (AIA) marker technique, as described by Van Keulen and Young (Reference Van Keulen and Young1977). Faecal grab samples (2×200 g) were obtained from each animal via rectal palpation once daily at 0800 h before feeding over 5 consecutive days beginning on days 76, 34 and 70 of years 1, 2 and 3, respectively, of the experimental period. Faecal samples were stored at −20°C and at the end of the sampling period samples were thawed and pooled per individual bull on an equal-weight basis. On these occasions, feed offered was sampled daily. Feed and faecal sample DM determination and sample preparation for chemical analysis were as described above.
Carcass traits and visceral organ weights
Bulls were weighed on the morning of slaughter. Post-slaughter, hot carcass weight was recorded and cold carcass weight was taken as 0.98 of hot carcass weight. Kill-out proportion was cold carcass weight expressed as a proportion of final BW before slaughter. Perinephric and retroperitoneal fat of each bull was weighed. Carcasses were graded mechanically for conformation and fat score according to the EU beef carcass classification scheme (EC, 2006) on a continuous 15-point scale as described by Hickey et al. (Reference Hickey, Keane, Kenny, Cromie and Veerkamp2007). Weight of the reticulo-rumen full and empty, intestines full, spleen, liver, gall bladder, heart, lungs and kidneys were recorded for each individual bull.
Computation of traits
Average daily live weight gain during the RFI measurement period for each animal was computed as the coefficient of the linear regression of BW (kg) on time (days) by using the GLM procedure of SAS 9.1 (SAS Institute Inc., Cary, NC, USA) for each year. Midtest metabolic BW (MBW) was represented as BW0.75 51, 54 and 54 days before the end of the test in years 1, 2 and 3, respectively, which was estimated from the intercept and slope of the regression line after fitting a linear regression through all BW0.75 observations.
RFI was calculated for each animal as the difference between actual dry matter intake (DMI) and expected DMI. Expected DMI was computed for each animal using a multiple regression model, regressing DMI on MBW and average daily gain (ADG), with year included as a class variable. The base model used was
 $$Y_j = \beta_0 + \tau_i + \beta_1MBW_j + \beta_2ADG_j + e_j,$$
where Y j is the average of the jth animal, β 0 is the regression intercept, τ i is the fixed effect of the ith year, β 1 is the partial regression coefficient for MBW, β 2 is the regression coefficient for ADG, and e j is the random error associated with the jth animal. The model R 2 coefficient produced from this equation accounted for 0.79 (P<0.001) of the variation in DMI and was used to predict DMI for each animal. Bulls were ranked according to RFI and then classified as low RFI (efficient), medium RFI and high RFI (inefficient) resulting in 22, 23 and 22 animals in the high, medium and low RFI groups, respectively.
Statistical analysis
Normality of data distribution was tested using the UNIVARIATE procedure of SAS 9.1 (SAS Institute Inc.). Data that were not normally distributed were transformed by raising the variable to the power of λ. The required λ value was calculated by conducting a Box–Cox transformation analysis using TRANSREG procedure of SAS. Data subject to transformation were used to calculate P-values. However, the corresponding least squares means and standard error of the non-transformed data are presented to facilitate interpretation of results. Least squares procedure of SAS was used to examine the effect of RFI groupings on intake, performance traits, body composition, rumen fermentation, total tract digestibility and carcass measurements. In year 1, no rumen fluid sample was obtained from one of the bulls and in year 2, one of the bulls did not have proper access to feed the day before sampling due to a fault in the Calan gate. This resulted in 65 bulls used in the rumen fermentation analysis. In year 1, the weight of one spleen was not recorded. Due to damage to gall bladders of some individual animals, during the evisceration process, the weights of two gall bladders in year 1 and one gall bladder in year 2 were not recorded, resulting in 64 bulls for statistical analysis of this variable. All 67 animals were used for statistical analysis of the other performance, blood metabolites, carcass and visceral organs weights. The statistical model used included the fixed effect of RFI group (high, medium and low) year, and their interaction. A random sire effect was included in the final model for all traits. Animal day of birth was included in the model as a linear covariate. Model effects were considered statistically significant when type I error rate was <5%. Variables having multiple observations such as blood metabolites, were analysed using repeated measures ANOVA (PROC MIXED procedure of SAS), with terms for RFI group, sampling day and their interaction included in the model and animal within RFI group set as the error term. If the interaction term was not statistically significant (P>0.05), it was subsequently excluded from the final model. Differences in RFI group were determined by F-tests using type III sums of squares. The PDIFF option and the Tukey test was applied as appropriate to evaluate pairwise comparisons between the RFI group means. The degrees of freedom method used was Kenward Roger and the covariance structure was unstructured. Data were considered statistically significant when P<0.05 and considered a tendency towards statistical significance when P<0.10. Pearson’s correlation coefficients among traits were determined using the CORR procedure of SAS with the partial correlation option to adjust for the fixed effect of year. Regression analysis was conducted to examine the relationship between RFI and visceral organ weights and carcass traits using the REG procedure of SAS.
Results
Animal performance and feed efficiency
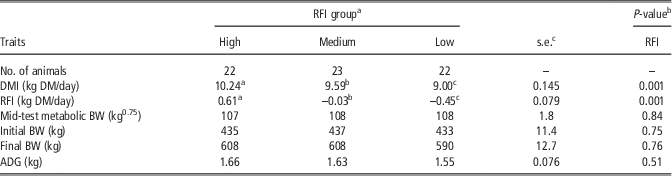
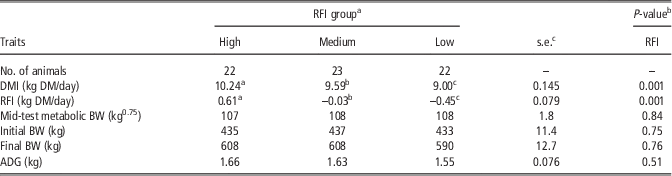
Bulls had a mean initial BW of 431 kg (s.d.=63.7), an ADG of 1.6 kg (s.d.=0.36) and DMI of 9.4 kg (s.d.=1.16) during the RFI measurement period. RFI averaged 0.00 and ranged from −1.16 to 2.28 kg of DM/day representing a difference of 3.09 kg DMI per day between the most and least efficient bulls. The differences between high, medium and low RFI bulls in DMI, feed efficiency and performance are shown in Table 2. There were no significant RFI×year interactions for DMI or performance variables. There was an RFI×year interaction (P<0.05) for RFI, whereby the difference between RFI groupings was greater in years 1 and 2 than year 3. Bulls ranked as high RFI consumed 7% and 14% more than medium and low RFI bulls, respectively (P<0.001). Bulls of high, medium and low RFI did not differ (P>0.05) in initial BW, final BW or ADG.
Feed intake, feed efficiency and growth traits of beef bulls ranked as high, medium and low RFI
RFI=residual feed intake; DMI=dry matter intake; DM=dry matter; ADG=average daily gain.
Least squares means within a row without a common superscript letter differ (P<0.05).
a High RFI=inefficient; medium RFI=intermediate; low RFI=efficient.
b No RFI×year interaction detected (P>0.05), except for RFI (P<0.05).
c s.e.=maximum standard error.
Initial and final BW and ADG were not correlated (P>0.05) with RFI. DMI was positively correlated with RFI (r=0.50; P<0.001), initial BW (r=0.34; P<0.01), final BW (r=0.59; P<0.001) and MBW (r=0.43; P<0.001).
BW, body measurements and blood metabolites
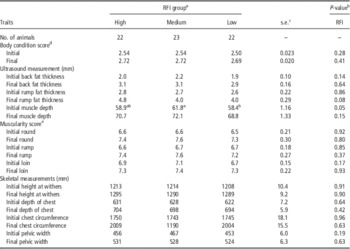
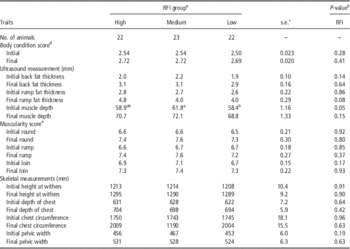
Effects of RFI group on body composition and skeletal traits are shown in Table 3. There were no significant RFI×year interactions for body composition and skeletal traits. Ultrasonic muscle depth, BCS, muscularity score and skeletal measurements did not differ between high, medium and low RFI groups. Muscle depth, BCS and skeletal measurements were not correlated (P>0.05) with RFI. End of trial rump fat thickness tended to have a moderate positive correlation with RFI (r=0.21; P=0.10).
Body composition traits and skeletal measurements of bulls with high, medium and low RFI
RFI=residual feed intake.
Least squares means within a row without a common superscript letter differ (P<0.05).
a High RFI=inefficient; medium RFI=intermediate; low RFI=efficient.
b No RFI×year interaction detected (P>0.05).
c s.e.=maximum standard error.
d Scale of 0 (emaciated) to 5 (obese).
e Scale of 1 (hollow, poorly muscled) to 15 (wide, thick muscled).
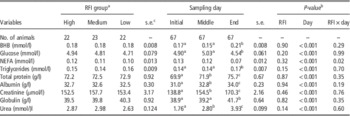
Results for blood metabolites examined are presented in Table 4. There were no RFI×year interactions for blood metabolites. There were no RFI×day of blood sampling interactions detected except for NEFA, whereby concentrations decreased over time in both low and high RFI bulls and increased until the middle sampling day and decreased thereafter for medium RFI bulls. Blood sampling day affected (P<0.001) all metabolites, whereas RFI had no effect (P>0.05) on any of the blood metabolites measured. No correlations were detected between RFI and any of the blood metabolites measured except for glucose, where there tended (r=0.12; P=0.09) to be a weak positive association.
Blood metabolite concentrations in bulls with high, medium and low RFI
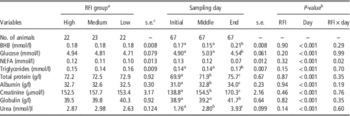
RFI=residual feed intake; BHB=β-hydroxybutyrate; NEFA=non-esterified fatty acids.
Least squares means within a row without a common superscript letter differ (P<0.05).
a High RFI=inefficient; medium RFI=intermediate; low RFI=efficient.
b No RFI×year interaction detected (P>0.05).
c s.e.=maximum standard error.
Rumen fermentation and total tract digestibility
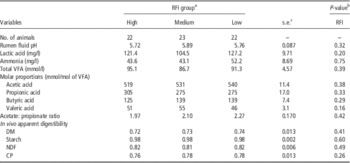
Rumen fermentation and in vivo total tract digestibility results are presented in Table 5. There were no RFI×year interactions detected for any of the rumen fermentation variables or total tract digestibility coefficiencts measured. Rumen fermentation variables or total tract digestibility coefficients did not differ (P>0.05) by RFI classification.
Rumen fermentation and in vivo apparent digestibility of beef bulls with differing RFI
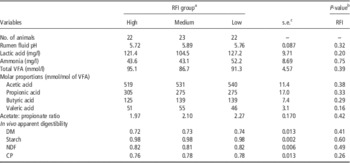
RFI=residual feed intake; VFA=volatile fatty acid; DM=dry matter.
a High RFI=inefficient; medium RFI=intermediate; low RFI=efficient.
b No RFI×year interaction detected (P>0.05).
c s.e.=maximum standard error.
Carcass traits and visceral organ weights
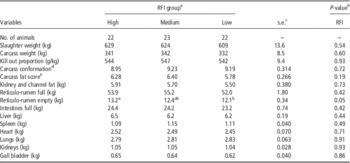
Effects of RFI group on carcass traits and visceral organ weights are shown in Table 6. There were no RFI×year interactions detected for carcass traits and visceral organ weights. There was no effect (P>0.05) of RFI group on carcass weight, kill-out proportion, carcass conformation score or fat score. RFI had no effect (P>0.05) on perinephric and retroperitoneal fat weight or on the weight of visceral organs measured, except for reticulo-rumen empty, which was heavier (P=0.05) in high RFI compared with low RFI bulls. Correlation analysis indicated that RFI had a moderate negative correlation with carcass conformation score (r=−0.30; P<0.02) and kill-out proportion (r=−0.21; P=0.09) and a moderate positive correlation with reticulo-rumen empty (r=0.33; P<0.01). Regression analysis indicated that for a 1 kg/day increase in RFI, reticulo-rumen empty increased by 1 kg (P<0.05), kill-out proportion decreased by 20 g/kg (P<0.05) and carcass conformation decreased by 0.74 units (P<0.05).
Carcass traits and visceral organ weights of beef bulls differing in RFI

Least squares means within a row without a common superscript letter differ (P<0.05).
a High RFI=inefficient; medium RFI=intermediate; low RFI=efficient.
b No RFI×year interaction detected (P>0.05).
c s.e.=maximum standard error.
d EU Beef Carcass Classification Scheme scale, 1 (poorest) to 15 (best).
e EU Beef Classification Scheme scale, 1 (leanest) to 15 (fattest).
Discussion
This study has shown that RFI is independent of level of production and weight and that some of the variation in RFI may be accounted for by differences in visceral organ mass as well as potential differences in nutrient partitioning towards carcass muscle development.
Animal performance and feed efficiency
Overall ADG, initial BW and DMI of the bulls used in the current study are within the ranges observed by Schenkel et al. (Reference Schenkel, Miller and Wilton2004), Lancaster et al. (Reference Lancaster, Carstens, Ribeiro, Tedeschi and Crews2009) and Kelly et al. (Reference Kelly, McGee, Crews, Lynch, Wylie, Evans and Kenny2011) for growing beef bulls offered an energy dense, high concentrate diet. The current study has shown that for growing beef bulls, weight and growth accounted for a substantial proportion (0.79) of the variation in RFI and that high RFI bulls had a 14% greater DMI than low RFI bulls for the same level of production. This result is in agreement with the findings of Schenkel et al. (Reference Schenkel, Miller and Wilton2004), Lancaster et al. (Reference Lancaster, Carstens, Ribeiro, Tedeschi and Crews2009) and Kelly et al. (Reference Kelly, McGee, Crews, Lynch, Wylie, Evans and Kenny2011) who found that weight and growth accounted for between 0.62 and 0.82 of the variation in RFI in growing bulls on a high concentrate diet.
Previous studies with bulls have shown that high RFI animals have a greater content of subcutaneous body fat than those of low RFI (Lancaster et al., Reference Lancaster, Carstens, Ribeiro, Tedeschi and Crews2009; Smith et al., Reference Smith, Davis and Loerch2010; Kelly et al., Reference Kelly, McGee, Crews, Lynch, Wylie, Evans and Kenny2011). Similarly, Crowley et al. (Reference Crowley, Evans, McHugh, Pabiou, Kenny, McGee, Crews and Berry2011) found that RFI had a positive phenotypic (r=0.26; P<0.05) and genetic (r=0.39) correlation with fat depth in bulls. However, in the current study, RFI had no significant effect on ribfat, backfat or rump fat depth. These findings are in agreement with those of Montanholi et al. (Reference Montanholi, Swanson, Schenkel, McBride, Caldwell and Miller2009) who found no differences in mid-trial backfat for crossbred bulls of high, medium and low RFI. The conflicting reports on the effect of phenotypic RFI on subcutaneous fat depth, may be due to variation in fat deposition in different breeds and differences in the site for ultrasonic measurement selected by operators (Kelly et al., Reference Kelly, McGee, Crews, Lynch, Wylie, Evans and Kenny2011).
Results in the literature on the effect of RFI on LD depth are inconsistent, in that Crowley et al. (Reference Crowley, McGee, Kenny, Crews, Evans and Berry2010) found that the phenotypic correlation between LD depth in bulls and RFI was negative, whereas Kelly et al. (Reference Kelly, McGee, Crews, Lynch, Wylie, Evans and Kenny2011) found that final LD depth was lower in low compared with high RFI bulls. In the current study, ultrasonic LD depth was not affected by RFI. Similarly, McDonagh et al. (Reference McDonagh, Herd, Richardson, Oddy, Archer and Arthur2001), using steers, Lancaster et al. (Reference Lancaster, Carstens, Ribeiro, Tedeschi and Crews2009), using bulls, and Cruz et al. (Reference Cruz, Rodriguez-Sanchez, Oltjen and Sainz2010), using steers, found that RFI had no effect on M. longissimus dorsi area (LMA) in beef cattle consuming a high concentrate diet. Mao et al. (Reference Mao, Chen, Vinsky, Okine, Wang, Basarab, Crews and Li2013) also found that RFI had weak or close to zero phenotypic correlations with LMA in Angus and Charolais steers however, genetic correlations between RFI and LMA in both breeds were positive and weak to moderate. The absence of an effect of RFI on LD depth and area in the current and other studies suggests that size of lean muscle tissue may not be the sole contributor to variation in RFI and that biological processes within muscle tissue such as protein turnover and tissue metabolism may have pivotal roles in improved feed efficiency (Herd and Arthur, Reference Herd and Arthur2009).
Rumen fermentation and total tract digestibility
Few studies have measured rumen fermentation variables in cattle differing in RFI (Basarab et al., Reference Basarab, Beauchemin, Baron, Ominski, Guan, Miller and Crowley2013). In accordance with the results of the current study, Krueger et al. (Reference Krueger, Carstens, Paddock, Calloway, Anderson, Kreuger, Gontcharova, Dowd, Gomez and Pinchak2009a) found no effect of RFI on ruminal pH or VFA production in steers offered a high concentrate diet. However, Krueger et al. (Reference Krueger, Carstens, Gomez, Bourg, Lancaster, Slay, Miller, Anderson, Horrocks, Krueger and Forbes2009b) using heifers offered a high forage diet found that low RFI heifers had lower propionate concentrations and a higher acetate: propionate ratio than high RFI heifers whereas, Lawrence et al. (Reference Lawrence, Kenny, Earley, Crews and McGee2011) found the opposite. Likewise, Lawrence et al. (Reference Lawrence, Kenny, Earley and McGee2013) found that low RFI cows offered a high forage diet tended (P=0.06) to have a lower acetate: propionate ratio than high RFI cows. Discrepancies between studies may be attributable to diet type, whereby differences in rumen fermentation between low and high RFI animals that are apparent on a high forage diet disappear once the animals are offered an energy dense diet.
Variation in feed intake relative to maintenance influences the rate and extent of digestion in ruminants (Tyrrell and Moe, Reference Tyrrell and Moe1975). Although Herd and Arthur (Reference Herd and Arthur2009) suggested that differences in digestion of feed may be a contributory factor to variation in RFI, few studies have examined the relationship between apparent total tract digestibility and RFI in cattle (Basarab et al., Reference Basarab, Beauchemin, Baron, Ominski, Guan, Miller and Crowley2013). In the current study, bulls of high RFI had similar apparent total tract digestibility (determined using AIA as an internal marker) to bulls of low RFI. Likewise, Cruz et al. (Reference Cruz, Rodriguez-Sanchez, Oltjen and Sainz2010) using lignin as an internal marker and Gomes et al. (Reference Gomes, Sainz and Leme2013) using the total faecal collection method, found no effect of RFI on apparent total tract digestibility in steers offered a high concentrate diet. In contrast, Krueger et al. (Reference Krueger, Carstens, Gomez, Bourg, Lancaster, Slay, Miller, Anderson, Horrocks, Krueger and Forbes2009b), using heifers offered a high forage diet, found that RFI was negatively correlated with apparent total tract digestibility. Nkrumah et al. (Reference Nkrumah, Okine, Mathison, Schmid, Li, Basarab, Price, Wang and Moore2006), using steers offered a high concentrate diet found that RFI tended to be negatively correlated with apparent DM digestibility (r=−0.33; P<0.10) and CP digestibility (r=−0.34; P<0.10). Collectively, these results suggest that digestion is not a major contributor to variation in RFI in animals offered a high concentrate diet, however, further investigation is warranted on the effects of RFI on apparent digestibility of high forage diets.
Carcass traits and estimated carcass composition
Improvement in feed efficiency should not be accompanied by a decline in economically relevant traits such as carcass weight and carcass conformation and fat score as these are correlated with, or are determinants of, payment for carcasses (Conroy et al., Reference Conroy, Drennan, McGee, Keane, Kenny and Berry2010b). In the current study, RFI tended to be negatively correlated with kill-out proportion, whereas Mader et al. (Reference Mader, Montanholi, Wang, Miller, Mandell, McBride and Swanson2009) found that RFI tended to be positively correlated (r=0.28; P=0.08) with dressing percentage. Despite these results, other studies have found that RFI was not correlated with dressing percentage (McDonagh et al., Reference McDonagh, Herd, Richardson, Oddy, Archer and Arthur2001; Gomes et al., Reference Gomes, Sainz, Silva, César, Bonin and Leme2012). Disparites in the effect of RFI on kill-out proportion between studies may arise from factors influencing kill-out proportion such as variation in level of gut fill due to differences in diet composition or duration of a pre-slaughter fast.
Compared with ultrasonic measurements obtained on the live animal, literature on the effects of RFI on carcass fatness traits is scant, and of these few studies, the results are inconsistent. In the current study no effect of RFI on, or correlations with, carcass fat score were detected, which is supported by the absence of an effect of RFI on final ultrasonic subcutaneous fat depth. These findings agree with those of Gomes et al. (Reference Gomes, Sainz, Silva, César, Bonin and Leme2012) for carcass backfat in steers. However, Nkrumah et al. (Reference Nkrumah, Basarab, Price, Okine, Ammoura, Guercio, Hansen, Li, Benkel, Murdoch and Moore2004) and Basarab et al. (Reference Basarab, McCartney, Okine and Baron2007) found that RFI had a significant positive correlation (r=0.25, 0.22; respectively) with carcass fat grade. The contrasting results for carcass fatness traits may arise from different measures of classifying carcass fatness. For example, discrepancies may exist between the EUROP method of allocating carcass fat score, which was used in the current study, and the Livestock and Poultry Carcass Grading Regulations, Canada.
Likewise, in genetic stuides, Bouquet et al. (Reference Bouquet, Fouilloux, Renand and Phocas2010) found no genetic correlation (r=0.00; P>0.05) in Blonde d’Aquitaine bulls and a close to zero genetic correlation (r=0.07; P>0.05) in Limousin bulls between RFI and carcass fat score. However Crowley et al. (Reference Crowley, Evans, McHugh, Pabiou, Kenny, McGee, Crews and Berry2011), found that the genetic correlation between RFI and carcass fat score was positive (r=0.33) and Mao et al. (Reference Mao, Chen, Vinsky, Okine, Wang, Basarab, Crews and Li2013), found that the genetic correlation between RFI and carcass grade fat was positive (r=0.42) in Charolais steers but was close to zero (r=0.02) in Angus steers. Differences in the propensity for fat accreation between different beef breeds, coupled with variation in carcass fat determination, may be contributing to the contrasting genetic correlations between RFI and carcass fatness observed between studies.
Although bulls of low and high RFI in the current study had similar carcass conformation, which reflects similar LD depth, the negative correlation between RFI and carcass conformation score concurs with Crowley et al. (Reference Crowley, Evans, McHugh, Pabiou, Kenny, McGee, Crews and Berry2011) who found that RFI had a negative genetic correlation with carcass conformation (r=−0.21), arising from improved muscularity in low RFI animals. A meta-analysis of genetic correlations between RFI and carcass conformation score by Berry and Crowley (Reference Berry and Crowley2013) found that, in general, RFI tends to be negatively correlated with carcass conformation in beef cattle.
Prediction equations generated by Conroy et al. (Reference Conroy, Drennan, McGee, Keane, Kenny and Berry2010b), based on carcass conformation and fat score, were used to estimate carcass meat, fat and bone proportions (g/kg) of the bulls in the current study. From these equations, it was found that mean meat, fat and bone proportions were 751, 131 and 118 g/kg, respectively, with no differences (P>0.05) detected between the RFI groups. However, correlation analysis showed that estimated meat proportion was negatively related (r=−0.31; P<0.05), bone proportion was positively related (r=0.25; P<0.05) and fat proportion was not related with RFI. Similarly, Nkrumah et al. (Reference Nkrumah, Basarab, Price, Okine, Ammoura, Guercio, Hansen, Li, Benkel, Murdoch and Moore2004) found that low RFI steers had an improved lean meat yield when compared with steers of high RFI. Crowley et al. (Reference Crowley, McGee, Kenny, Crews, Evans and Berry2010) suggested from genetic correlation analysis that selection for low RFI cattle may result in carcasses with simultaneous increases in very high-value meat cut weight and low-value meat cut proportions and weight, possibly arising from the negative genetic correlations between muscularity traits and RFI observed in that study. Conversely, Mader et al. (Reference Mader, Montanholi, Wang, Miller, Mandell, McBride and Swanson2009) found no association between RFI and lean expressed as a proportion of total 10th-, 11th- and 12th-rib weight, although this methodology may not reflect composition of the full carcass. The absence of a relationship between RFI and estimated carcass fat proportion in the current study concurs with the results of Mader et al. (Reference Mader, Montanholi, Wang, Miller, Mandell, McBride and Swanson2009) and Cruz et al. (Reference Cruz, Rodriguez-Sanchez, Oltjen and Sainz2010) when fat proportion was expressed as a proportion of total 10th-, 11th- and 12th-rib weight and of total 9th-, 10th- and 11th-rib weight, respectively. Likewise, Basarab et al. (Reference Basarab, Price, Aalhus, Okine, Snelling and Lyle2003) found that the proportion of subcutaneous and body cavity fat (g/kg carcass) was similar between RFI groups. Unlike the findings of the current study, Basarab et al. (Reference Basarab, Price, Aalhus, Okine, Snelling and Lyle2003) and Mader et al. (Reference Mader, Montanholi, Wang, Miller, Mandell, McBride and Swanson2009) found no relationship between RFI and carcass bone proportions. As carcass meat proportion is the main determinant of carcass value (Conroy et al., Reference Conroy, Drennan, McGee, Keane, Kenny and Berry2010b) collectively, these findings suggest that low RFI carcasses are of higher value to producers.
Visceral organ weights
As the GIT and liver have a large influence on total oxygen consumption, mainly through their high metabolic activity, changes in the energy metabolism of these organs could have a profound effect on efficiency of energy utilisation by the whole animal (Ortigues and Doreau, Reference Ortigues and Doreau1995). Fluctuations in liver and GIT weights appear to be directly proportional to dietary intake (Johnson et al., Reference Johnson, Johnson and Baldwin1990) stemming from an increase in both volume of ingesta and supply of nutrients, primarily through changes in cell number, size and consequently protein turnover (Ortigues and Doreau, Reference Ortigues and Doreau1995).
In the current study, the low RFI bulls, who consumed 12% less DMI, had a lighter (8%) reticulo-rumen empty than high RFI bulls illustrating the decrease in the weight of the GIT in animals that have a reduced DMI. Likewise, Basarab et al. (Reference Basarab, Price, Aalhus, Okine, Snelling and Lyle2003) working with steers and Bonilha et al. (Reference Bonilha, Branco, Corvino, Alleoni, Figueiredo and Razook2009) working with bulls found that low RFI cattle had an 8% and 10%, respectively, lower weight of GIT than those with high RFI. In the same way, the higher DMI of dairy breeds compared to dairy×beef breeds (McGee et al., Reference McGee, Keane, Neilan, Moloney and Caffrey2005) is associated with a heavier GIT (McGee et al., Reference McGee, Keane, Neilan, Moloney and Caffrey2008).
The increased weight of the reticulo-rumen in high RFI bulls in the current study may be due to an enhanced development of rumen muscle to mix the rumen contents when the fill is higher (Ortigues and Doreau, Reference Ortigues and Doreau1995), although this was not measured in the current study. The relationship between greater intake and a heavier reticulo-rumen in the current study is further demonstrated by regression analysis showing a 1 kg/day increase in RFI was associated with a 1 kg increase in reticulo-rumen empty weight. Incorporation of the reticulo-rumen empty into the base model for the prediction of DMI in the current study accounted for 4% (P<0.001) of the variation in RFI, increasing the R 2 of the base model from 79% to 83%. This suggests that reticulo-rumen empty is a biologically significant contributory factor to variation in RFI.
With the exception of the reticulo-rumen empty, no differences in visceral organ weight between high and low RFI bulls were detected in the current study, which is in contrast to the findings of Basarab et al. (Reference Basarab, Price, Aalhus, Okine, Snelling and Lyle2003) and Bonilha et al. (Reference Bonilha, Branco, Corvino, Alleoni, Figueiredo and Razook2009) who found that low RFI cattle had an 8% and 10%, respectively, lighter liver than high RFI cattle. Additionally, Bonilha et al. (Reference Bonilha, Branco, Corvino, Alleoni, Figueiredo and Razook2009) found that low RFI bulls had 14% lighter kidneys than high RFI bulls, although this was not evident in the current study or in that of Basarab et al. (Reference Basarab, Price, Aalhus, Okine, Snelling and Lyle2003). In contrast, Mader et al. (Reference Mader, Montanholi, Wang, Miller, Mandell, McBride and Swanson2009) and Gomes et al. (Reference Gomes, Sainz, Silva, César, Bonin and Leme2012) using steers, found no effect of RFI on the weights of any of the visceral organs measured. More recently, Bonilha et al. (Reference Bonilha, Branco, Bonilha, Araujo, Magnani and Mercadante2013) found no effect of RFI on weights of any visceral organs except kidney weight, where low RFI bulls had 12% lighter kidneys than high RFI bulls.
Although size of visceral organs was reported to be responsive to the level of dietary intake (Johnson et al., Reference Johnson, Johnson and Baldwin1990), oxygen consumption or energy expenditure of these organs increases after feeding and changes in accordance with level of feed intake (Seal and Reynolds, Reference Seal and Reynolds1993). This suggests that size of visceral organs alone may not be the sole contributory factor to energetic efficiency as McBride and Kelly (Reference McBride and Kelly1990) have shown that within tissues, different metabolic processes such as transport of sodium and potassium ions and protein synthesis and degradation in the GIT and liver, have varying energetic efficiency. These discrepanacies in energetic efficiency of metabolic processes within tissues may explain the absence of an effect of RFI on visceral organs weights despite a reduced DMI of the low RFI bulls in the current study. Indeed, Chen et al. (Reference Chen, Gondro, Quinn, Herd, Parnell and Vanselow2011) found differential hepatic gene expression between high and low RFI animals in processes involved in carbohydrate metabolism, lipid metabolism and protein synthesis among other processes. Similarly, Connor et al. (Reference Connor, Kahl, Elsasser, Parker, Li, Tassell, Baldwin and Barao2010) found that steers exhibiting compensatory growth and greater efficiency of ADG than control animals, had increased expression of hepatic genes involved in processes such as cellular metabolism, oxidative phosphorylation and glycolysis. These findings further emphasise the need to examine cellular and molecular differences in organs that have high metabolic activity such as the GIT and liver between animals of differing feed efficiency.
Production system economics
The difference in daily DMI between high and low RFI groups in the current study was 1.24 kg equivalent to 130 kg of concentrate per bull over the 105 day finishing period. Using prices for concentrates for finishing beef cattle in Ireland (CSO, 2012), this corresponds to a reduction in feed costs over the finishing period of €35/bull. When compared with an Irish beef finishing system, this potential reduction in production cost is substantial as the mean gross margin on this type of system, with a mean stocking rate of 1.3 livestock units per hectare, is low at €295 per livestock unit (Hennessy et al., Reference Hennessy, Moran, Kinsella and Quinlan2013). Lawrence et al. (Reference Lawrence, Kenny, Earley and McGee2013) conducted a similar economic analysis between cows of low and high RFI in an Irish suckler beef production system and found that low RFI cows represented a saving of €51/cow per year in annual feed cost. Thus, it is clear from this analysis and similar analysis from others (Arthur et al., Reference Arthur, Herd and Basarab2010) that incorporating selection for improved feed efficiency into a national breeding objective would be of economic benefit to the beef industry.
Conclusions
The results of this study show that consistent with other reports, RFI is phenotypically independent of weight and level of production in beef cattle and may be used as a tool to select feed efficient animals. As RFI was shown to have beneficial correlations with economically relevant traits such as carcass conformation and predicted meat proportion, this suggests that RFI is a feed efficiency trait of great potential for beef producers. These results add further merit to improvement in feed efficiency through RFI as producers may increase profitability with reduced feed costs. Of the visceral organs measured the reticulo-rumen complex has been identified as a potential biologically significant contributor to variation in RFI. However, further work is warranted in quantifying differences in visceral organ metabolism and energetic efficiency between animals of differing RFI.
Acknowledgements
The authors acknowledge E. Mulligan (Teagasc, Grange Beef Research Centre, Ireland) for skilled technical assistance, the farm staff at Teagasc, Grange Beef Research Centre for care and management of the animals, the staff of Grange laboratories for feed analysis, and J. Larkin and M. Murray for the blood analysis.
Financial Support
C. Fitzsimons was in receipt of a Teagasc Walsh Fellowship funded scholarship.