Introduction
Rice (Oryza sativa L.) is the cornerstone of global food security and feeds more than half of the world’s population (USDA, 2023). Its production and consumption are particularly important in China (FAOSTAT, 2019). To sustain the country’s large population, increasing crop yield has become imperative, leading to a corresponding rise in nitrogen (N) fertilizer application to achieve higher productivity (Huang et al., Reference Huang, Lv, Bloszies, Shi, Pan and Zeng2016). While high inputs of N fertilizers ensure food production, they also lead to various problems such as slowdown in the yield-increasing effect of N fertilizers, increase in N losses, low N-use efficiency (NUE), intensified soil acidification, excessive accumulation of soil inorganic N and increased environmental risks (Ren et al., Reference Ren, Huang, Liu, Zhao and Zhang2023). Conventional rice cultivation entails the excessive application of N, a key contributor to ammonia (NH3) volatilization losses, and consequently, low apparent N recovery efficiency (ANRE) – which represents a major agronomic, economic and environmental challenge (Chakraborty et al., Reference Chakraborty, Purakayastha, Pendall, Dey, Jain and Kumar2023; Nkebiwe et al., Reference Nkebiwe, Weinmann, Bar-Tal and Müller2016). Therefore, the development and adoption of novel fertilization strategies aimed at minimizing NH-induced N loss are urgently required. This represents a crucial step towards an integrated approach for securing high-yielding rice production while enhancing NUE and ensuring environmental sustainability.
The volatilization of NH3 gas is an important way of N loss in paddy fields; it is also an ecological issue related to the use of N fertilizers. Urease inhibitors (UIs) substantially affect inhibition of NH3 volatilization and improve NUE (Han et al., Reference Han, Chen, Chen, Feng, Sun, Xue, Feng, Sun and Yang2022). At least 25% of N from applied urea can be converted to NH3, with volatilization rates significantly increasing under warm and dry conditions (FAOSTAT, 2019). N-(n-butyl) thiophosphoric triamide (NBPT) is a widely utilized UI; it blocks the active site of urease, limits urea hydrolysis and reduces the amount of N lost to the atmosphere as NH3 (Lan et al., Reference Lan, He, Wang, Deng, Zhou, Luo, Chen, Zeng, Yuan, Zeng and Xiao2022; Murray et al., Reference Murray, Gilliland, Delaby, Patton, Creighton, Forrestal and McCarthy2023; Sha et al., Reference Sha, Wang, Ma, Lv, Liu and Misselbrook2023). Integrated soil–crop system management (Yang et al., Reference Yang, Li, Ni, Yu, Yang, Wang, Liu, Ye, Tao, Liu and Wu2020a, Reference Yang, Ji, Sheng, Zhang, Feng, Guo and Chen2020b) coupled with reduced N fertilizer application rates (Ding et al., Reference Ding, He, Zhang, Liu, Xu, Ullah, Cui and Zhou2020) can substantially mitigate NH3 volatilization from paddy soils. However, in the quantitative ranking of factors affecting NH3 volatilization in paddy soils, the N application rate is ranked after the three variables of NH4 +-N concentration, pH and temperature in the surface water of paddy fields (Xie et al., Reference Xie, Li, Shi, Zhang, Fang, Wang and Zhang2020). The combined application of urease and nitrification inhibitors simultaneously regulates the key processes of urea hydrolysis and nitrification, thereby effectively minimizing N losses from agricultural soils (Engel et al., Reference Engel, Romero and Jones2017). In addition to minimizing N losses from agricultural fields, dual inhibition (urease + nitrification inhibitors) provides higher grain productivity and economic returns than those obtained with urea application without dual inhibition. As reported by Fast et al. (Reference Fast, Strydhorst, Wang, Hernandez-Ramirez, Hao, Semach, Thompson, Holzapfel, Enns, Spaner and Beres2023) in annual row crops, integrating enhanced efficiency fertilizers and N rates improved Canada Western Red Spring wheat.
UIs function by suppressing urease activity, thereby slowing urea hydrolysis rates and reducing NH4 +-N concentrations, which ultimately reduce NH3 volatilization (Cantarella et al., Reference Cantarella, Otto, Soares and Silva2018). Combining biochar with UIs can mitigate NH3 volatilization and reduce N losses via runoff and leaching, thereby improving NUE (He et al., Reference He, Liu, Yuan, Ni, Zaman, Luo, Lindsey and Ding2018; Wang et al., Reference Wang, Guo, Zheng, Zhang, Yang, Li, Ma, Zhang and Li2019). Specific UIs, such as NBPT, can reduce NH3 emissions by up to 70% while simultaneously enhancing crop yield and N absorption (Sha et al., Reference Sha, Wang, Ma, Lv, Liu and Misselbrook2023). Although research has confirmed that NBPT application substantially mitigates NH3 volatilization, its adoption by rice farmers predominantly depends on the impact of the technology on grain yield (Yang et al., Reference Yang, Li, Ni, Yu, Yang, Wang, Liu, Ye, Tao, Liu and Wu2020a, Reference Yang, Ji, Sheng, Zhang, Feng, Guo and Chen2020b). Refinement of conventional fertilization (CF) strategies is urgently needed to reduce N loss via NH3 volatilization and achieve optimal crop N nutrition uptake.
Deep fertilization (DF) is a method where fertilizer is placed 5–10 cm below the soil surface instead of directly spreading on the surface. It is another established strategy for improving NUE in rice systems (Nkebiwe et al., Reference Nkebiwe, Weinmann, Bar-Tal and Müller2016). By concentrating N in reduced underground areas, DF slows down N release rate and reduces the contact between urea and surface-active enzymes, thereby reducing NH3 volatilization and extending the availability of N for crop absorption (Zhong et al., Reference Zhong, Zhou, Fei, Huang, Wang, Kang and Peng2021). However, most studies that have evaluated DF have been conducted on single-season rice cultivation systems or have investigated its effects under conventional N application rates (Yang et al., Reference Yang, Ji, Sheng, Zhang, Feng, Guo and Chen2020b). Studies conducted on double-season rice cultivation systems – accounting for approximately 40% of China’s total rice planting area (FAOSTAT, 2023) – face challenges different from those on single-season rice systems. Although extensive research has been conducted on both UI and DF individually, key knowledge gaps remain regarding their combined application in double-season cultivation systems. First, although DF can reduce NH3 loss by physically separating urea from the surface environment through physical means, it does not address the fundamental problem of rapid hydrolysis of urea in fertilizer particles around the soil microenvironment. Instead, use of UI alone can effectively inhibit urease activity; however, if urea is still close to the soil surface – where gas loss is more favourable – UI cannot reduce the total ammonium ion concentration available for volatilization. The potential for synergy when combining these two methods – using DF to place urea in the lower soil layer and using UI to delay hydrolysis – is rarely explored under field conditions. Second, under DF conditions, the optimal application rate of UI may vary – the reduction in oxygen supply in deep-fertilized areas may affect the oxidation of NBPT (nitrate reductase inhibitor) to its active form (NBPTO), which may require higher or lower UI concentrations to achieve the same effect (Phongpan et al., Reference Phongpan, Freney, Keerthisinghe and Chaiwanakupt1995).
Although previous studies have investigated the effects of UIs and DF separately, most were conducted under single-season cropping systems or conventional N application rates, with limited attention to their interactive effects on both NH3 mitigation and crop performance. To date, no field studies have systematically examined the combined application of DF and UI under reduced N input in double-season rice systems, particularly regarding the trade-offs between NH3 emission reduction, N uptake and yield formation across consecutive seasons. To this end, systematic field trials were conducted in the double-cropping rice systems of southern China to comprehensively evaluate the integrated effects of UIs on (1) surface water chemistry (NH4 +-N concentration and pH), (2) soil urease activity dynamics and (3) NH3 volatilization patterns. Furthermore, UI effects on N uptake efficiency, apparent N recovery and yield components (panicle number, grain-filling rate and harvest index) were quantitatively assessed. The two primary objectives were to quantify the impact of a 30% N reduction combined with UI on the dynamics of NH3 volatilization in a double-cropping rice system and elucidate the underlying mechanism whereby the UIs simultaneously mitigate NH3 losses, enhance N uptake and promote rice yield. Our findings aid in establishing practical approaches for achieving the triple goals of reducing environmental NH3 emissions, optimizing NUE and sustaining high rice productivity in intensive cultivation systems.
Materials and methods
Site description
Field trials were conducted in a double-cropping rice system in Shuyi Village, Bailuopu Town, Changsha City, Hunan Province (28°12 ‘north latitude, 112°41’ east longitude, 66 m altitude) from April to November 2024 and April to November 2025. This region experiences a typical subtropical monsoon humid climate with distinct seasonal variations. The annual mean temperature averages 17.5°C, accompanied by substantial precipitation (1,460 mm) and adequate sunshine duration (1,610 h), creating optimal growing conditions for rice cultivation. Characterized by a 274-day frost-free period, the site exhibits typical subtropical temperature patterns: January temperature (average 4.4°C) contrasts sharply with that of July (average 30.0°C) as the coldest and hottest, respectively. These agroclimatic conditions collectively ensure that the experimental results accurately reflect real-world production scenarios in subtropical rice growing regions. The experimental soil, classified as typical paddy soil derived from schist weathering parent material, and as hydragric paddy soil (FAO classification), exhibits moderate fertility levels suitable for rice cultivation. This soil was subjected to continuous rice monoculture, with the preceding crop being rice (Oryza sativa L.). The plough layer (0–20 cm) had a pH (H2O, 1:2.5) of 6.2 and contained 27.7 g/kg organic matter. The total N, P and K contents were 1.56, 0.52 and 16.2 g/kg, respectively, whereas alkali-hydrolysable N, Olsen-P and exchangeable K concentrations were 157, 13.7 and 109 mg/kg, respectively. The basic physicochemical properties of the soil were determined following the methods described by Bao (Reference Bao2000).
Experimental design
The early-season rice (ESR) cultivar tested was the conventional Indica variety ‘Zhongjiazao 17’ (90-day growth cycle), whereas the late-season rice (LSR) was the hybrid Indica ‘Taiyou 553’ (89-day growth cycle). For fertilization treatments, the following materials were selected: (1) urea (46% N) as the N source, (2) calcium superphosphate (12% P2O5) as the phosphorus fertilizer and (3) potassium chloride (60% K2O) as the potassium fertilizer. Specialized compound fertilizers were obtained from Hunan Hualv Co., Ltd. (Xiangtan, Hunan, China). The UI employed was NBPT (purity >97%), supplied by Jincang Agricultural Technology Co., Ltd. (Shanghai, China). Mechanical transplanting was performed using the 2FH-8 type rice transplanter developed by Hunan Longzhou Agricultural Machinery Co., Ltd. (Miluo, Hunan, China). For specific parameters (Zhong et al., Reference Zhong, Zhou, Fei, Huang, Wang, Kang and Peng2021).
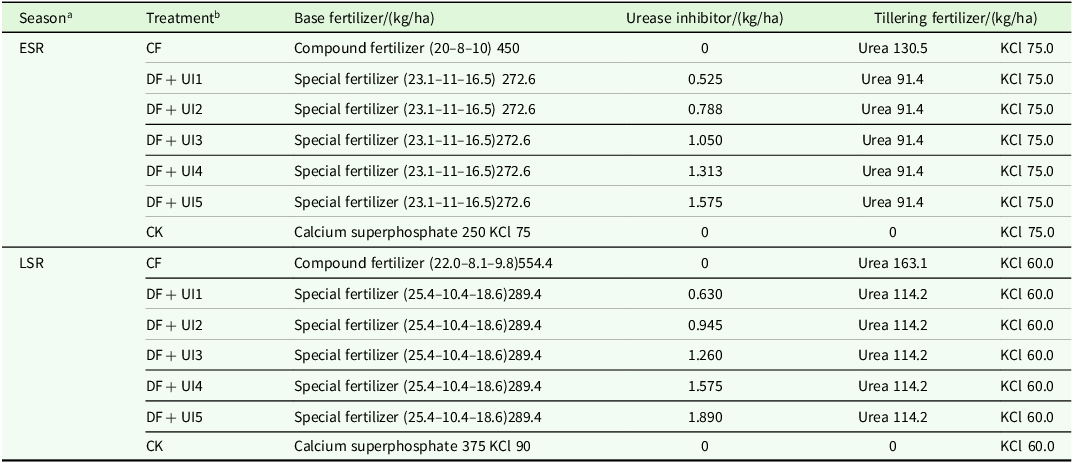
Seven experimental treatments were established for both ESR and LSR season rice trials: (1) CF: full N application (manually broadcast); (2) DF with 30% N reduction; (3) DF with 0.5% UI (DF + UI1); (4) DF with 0.75% UI (DF + UI2); (5) DF with 1.0% UI (DF + UI3); (6) DF with 1.25% UI (DF + UI4); and (7) control: zero N application (CK). The DF treatment featured a 30% reduction in N input compared with that under the conventional practice. The CF followed the practices of local farmers: urea was evenly spread on the surface of the soil manually, without being mixed in, and remained in the 0–2 cm oxidized top-soil layer. The UI application rates (UI1–UI4) were precisely calibrated at 0.5, 0.75, 1.0 and 1.25% of the urea N content, respectively, creating a gradient for comparative analysis. Prior to application, urea and UI were thoroughly mixed to ensure uniform distribution. For treatment 1 (CF), N was applied at rates of 150 and 180 kg N/ha for ESR and LSR, respectively. Treatments 2–6 (DF-based) employed a 30% N reduction relative to that of CF, corresponding to 105 kg N/ha (ESR) and 126 kg N/ha (LSR). The complete treatment specifications are summarized in Table 1. The experimental design incorporated three replications arranged in a randomized complete block design to ensure statistical robustness. Each experimental plot measured 48 m2 (6 × 8 m) with planting densities of 12 × 25 and 16 × 25 cm for early and late rice, respectively, maintaining three to four seedlings per hill. Adjacent plots were physically isolated by a 50-cm-wide buffer rows and 30 × 30 cm (height × width) mud ridges wrapped with plastic film, ensuring complete hydraulic separation for independent irrigation and drainage management. Between experimental blocks, 4–6 m wide buffer zones were established with dedicated irrigation and drainage channels. Phosphorus was applied at 35 and 45 kg/ha for ESR and LSR, respectively, whereas K2O was maintained at 90 kg/ha for both seasons. From transplanting to the reviving stage, a shallow water layer was maintained in the paddy field. From revival to the critical leaf age stage for effective tillering, intermittent wet irrigation (i.e., maintaining moist soil without continuous flooding) was applied. When the field seedling population reached 85% of the target panicle number, the field was drained for 7–8 days for mid-season drainage (field drying). Subsequently, intermittent wet irrigation was resumed. During the heading stage, shallow water irrigation was adopted, followed by alternate wet and dry irrigation. Water was cut off 7 days before maturity. Other field management practices followed conventional methods (Table 1).
Description of the experiment, fertilization method and amount

Table 1 Long description
The table presents a comparison of seven experimental treatments for ESR and LSR season rice trials. It includes columns for season, treatment, base fertilizer amount in kilograms per hectare, urease inhibitor amount in kilograms per hectare, and tillering fertilizer amount in kilograms per hectare. The table has 14 rows and 5 columns. The seasons are labeled as ESR and LSR. Treatments include CF, DF with various urease inhibitor percentages (UI1 to UI5), and CK. Base fertilizers vary between compound fertilizers, special fertilizers, and calcium superphosphate, with specific nutrient ratios and amounts. Urease inhibitor amounts range from 0 to 1.890 kilograms per hectare. Tillering fertilizers are either urea or potassium chloride (KCl), with varying amounts. Notable trends include increasing urease inhibitor amounts in DF treatments and consistent potassium chloride amounts in tillering fertilizers.
a ESR, early-season rice; LSR, late-season rice.
b CK, no nitrogen fertilizer; CF, 100% Urea-N; DF, side-deep fertilization reduces nitrogen by 30%; UI, urease inhibitor; DF + UI1, DF with 0.5% UI; DF + UI2, DF with 0.75% UI; DF + UI3, DF with 1.0% UI; DF + UI4, DF with 1.25% UI; DF + UI5, DF with 1.5% UI, respectively.
Measurement methods
Measurement of NH3 volatilization
The gas collection device was constructed from polyvinyl chloride (PVC) rigid plastic tubing with an internal diameter and height of 15 and 20 cm, respectively. The specific protocol involved: (1) saturating two polyurethane sponges (2 × 16 cm thickness × diameter each) with 15 mL of glycerophosphate solution (prepared by diluting 50 mL phosphoric acid + 40 mL glycerol to 1000 mL) and (2) placing these prepared sponges inside the PVC chamber. The lower and upper sponges were positioned 6 cm above the ground and aligned flush with the top of the PVC tube, respectively. Three ammonia volatilization collection devices were installed per plot as technical replicates, placed uniformly between rice rows with the device edge 5–8 cm from the plant base and positioned away from ridges, irrigation inlets/outlets and marginal areas (at least 50 cm from the plot boundary). The three devices were arranged in a diagonal pattern, located approximately at one-third of the diagonal from each end and at the centre. During sampling, the ammonia content of each device was measured separately, and the arithmetic mean of the three devices was used to represent the NH3 volatilization flux for the plot. During sampling, the upper and lower sponges were removed and transported to the laboratory in a sealed plastic bag, respectively, wherein it was extracted with a 1 mol/L KCl solution for analysis. The lower sponge was then replaced, and the upper sponge, after being re-saturated with the glycerophosphate solution, was repositioned to prevent atmospheric NH3 from entering the lower sponge. The sponge was soaked in 200 mL of a 1 mol/L KCl solution and shaken for 1 h. The NH4 +-N content in the extract was measured using the SEAL AA500 Continuous Flow Analyzer (SEAL Analytical GmbH, Norderstedt, Germany) (Liu et al., Reference Liu, Fan, Zhang, Chen, Li and Cao2015; Sun et al., Reference Sun, A., Feng, Vithanage, Mandal, Shaheen, Rinklebe, Shi and Wang2019). The NH3 flux was calculated according to the following formula:
 $${\rm NH}_3 {\rm \ flux\ (kg/ha/d)} = {\rm M \times A \times D} \times 10$$
 $${\rm M = c \times v \times M_0}$$
where M, A, D, c, v and Mo are the average amount of NH3 (NH4 +-N) measured per sampling event by the ventilation or closed-chamber method (g), cross-sectional area of the collection device (m2), duration of each continuous sampling event (days, d), NH4 +-N concentration in the KCl extraction solution (mol/L), volume of the KCl extraction solution (0.2 L in the current study) and molar mass of NH3 (considered as 17 g/mol), respectively.
Surface water sampling and soil urease activity analysis
For monitoring NH3 volatilization rates in paddy fields, surface water samples were collected 10 times from rice transplantation through field drying for analysing NH4 +-N concentration and pH in both ESR and LSR systems. Using 100-mL medical syringes, water samples were carefully extracted from five representative locations per plot and composited into a single sample, with strict maintenance of soil integrity throughout sampling. NH4 +-N concentration was determined using a SmartChem 200 discrete chemistry analyser (Westco Scientific Instruments, Inc., Brookfield, CT, USA) following established protocols. Urease activity was measured employing a soil enzyme assay kit (Solarbio Science & Technology Co., Ltd., Beijing, China) (Hou et al., Reference Hou, Wang, Yang, Hu, Bian, Jin, Li and Xiong2020).
Plant sampling and analysis
Plant samples were collected at four distinct growth stages: tillering, heading, grain-filling and physiological maturity. For each plot, six representative rice plants were selected, processed by root removal and subjected to a two-stage drying protocol: initial dehydration at 105°C for 30 min, followed by continuous drying at 80°C until constant weight was achieved for dry matter determination. The dried samples were subsequently ground to a fine powder for N content analysis. N analysis was performed through sulfuric acid–hydrogen peroxide (H2SO4-H2O2) digestion followed by Kjeldahl N determination using a KDN-102C N analyser. At maturity, yield evaluation was conducted through plot-specific harvesting of all plants.
Statistical analysis
Data were analysed using linear mixed-effects models (LMMs) with the lme4, lmerTest and emmeans packages in R (v4.5.1; R Core Team, 2025). Fixed effects included year, season, treatment and all their interactions. Random effects included block, plot and season nested within year. Fixed effects were tested using Type III ANOVA with Satterthwaite’s degrees of freedom. Treatment means were compared via estimated marginal means (EMMs) followed by Tukey’s HSD test (α = 0.05). Significance levels: *P < 0.05, **P < 0.01. Preliminary data processing and calculations were conducted using Microsoft Excel 2013 (Microsoft Corp., Redmond, WA, USA), whereas scientific graphing was performed using OriginPro 2025 (OriginLab Corp., Northampton, MA, USA).The Elovich equation (fitted with SigmaPlot 12.5; Systat Software, Inc.) was applied to describe the cumulative NH3 loss over time, characterizing the dynamic patterns of NH3 flux after fertilization in each growing season.
Results
NH3 loss from double-cropping rice fields
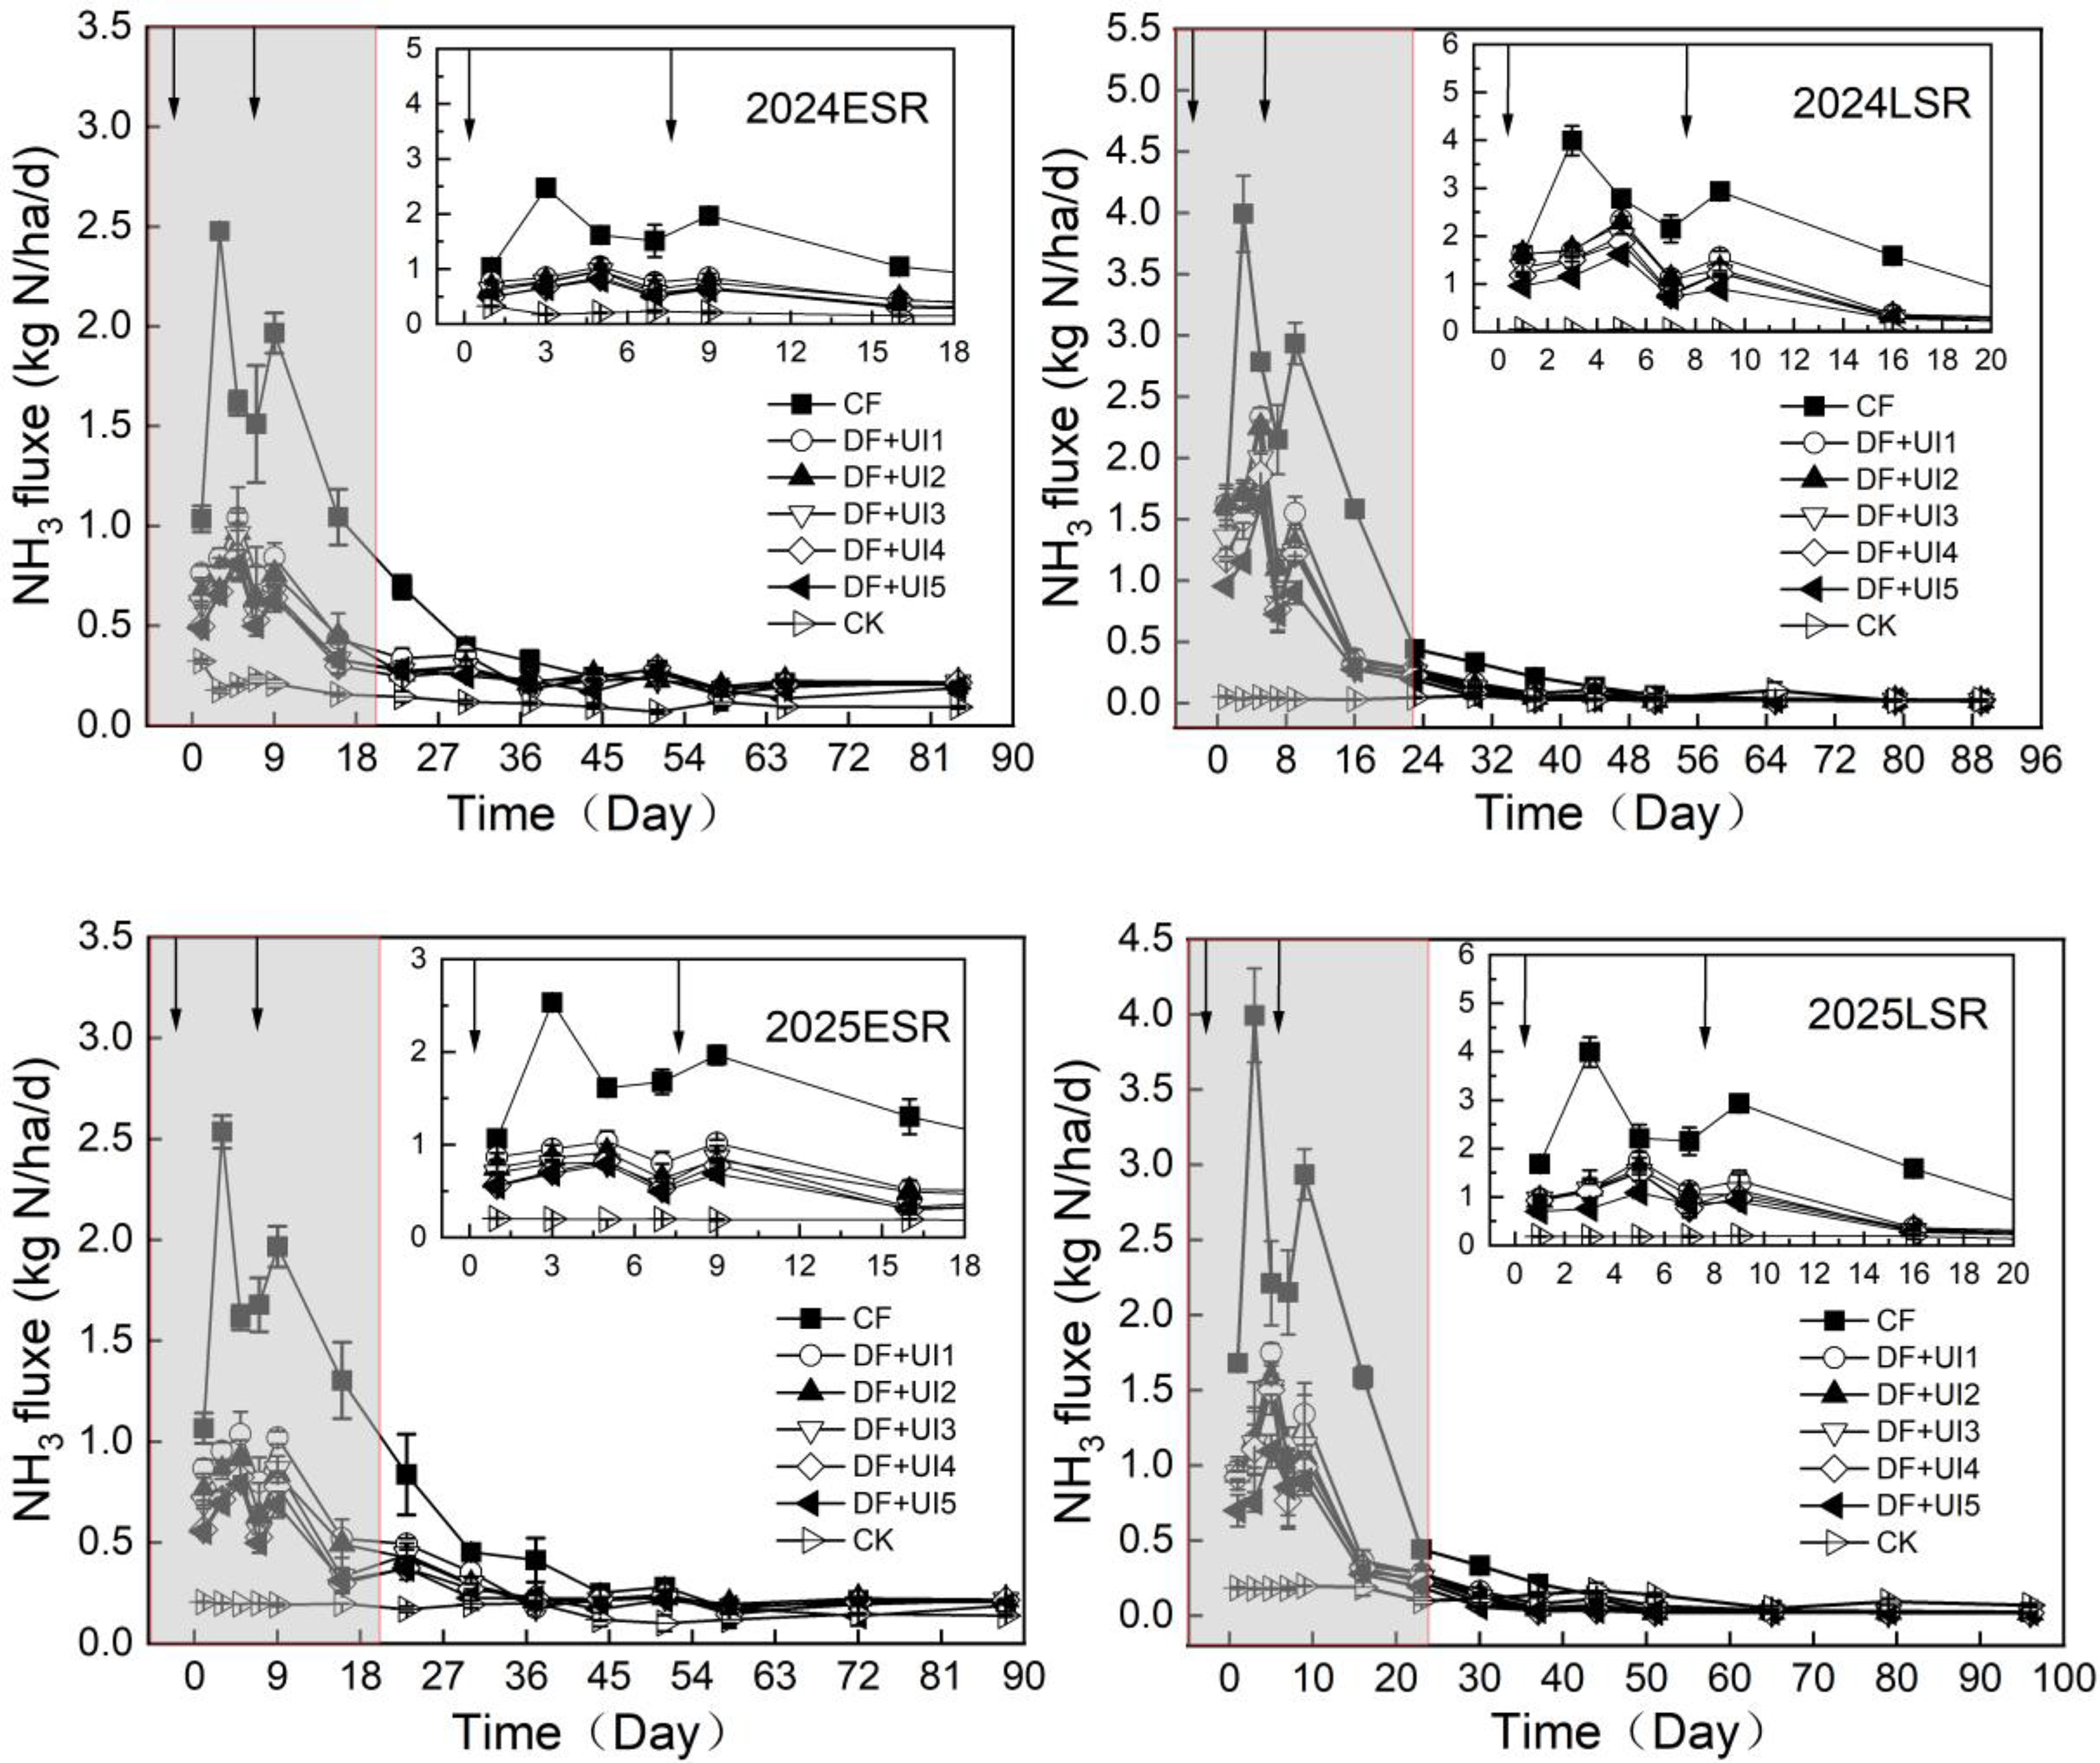
Under CF, NH3 losses were significantly higher after basal fertilization in both early and late rice (Table 2). CF (without inhibitors) showed that the NH3 volatilization peak occurred on day 3 after the base fertilizer application. However, when NBPT was added, the peak was delayed until day 5 after fertilization (Figure 1). Treatments with UI resulted in lower peak NH3 emission rates compared with those under CF. Three weeks after fertilization, the NH3 emission rates from all fertilized treatments decreased to levels similar to those of the zero-N control. In 2024, the peak NH3 fluxes of early and late rice under CF treatment were 2.48 and 3.99 kg N/ha/d, respectively, which were 1.43–1.67 and 1.66–2.38 kg N/ha/d higher than those under DF + UI treatment. In 2025, the peak fluxes of NH3 under CF treatment were 2.54 and 3.76 kg N/ha/d, respectively, which were 1.50–1.75 and 2.07–2.61 kg N/ha/d higher than those under DF + UI treatment (Figure 1). Throughout the rice growing season, deep placement with reduced N combined with different UI dosages effectively reduced daily NH3 fluxes. In double-cropping rice systems, NH3 volatilization continued to increase after fertilization until entering a low-emission phase approximately 2 weeks later.
Ammonia emissions flux during the early-and late-rice seasons from the surface of paddy fields under different fertilization treatments. NH3, ammonia; CK, no nitrogen fertilizer; CF, 100% Urea-N; DF, side-deep fertilization reduces nitrogen by 30%; UI, urease inhibitor; DF+UI1, DF with 0.5% UI; DF+UI2, DF with 0.75% UI; DF+UI3, DF with 1.0% UI; DF+UI4, DF with 1.25% UI; DF+UI5, DF with 1.5% UI, respectively. ESR, early-season rice; LSR, late-season rice. Bars represent standard error of the mean (SEM; n = 3). The arrows indicate the fertilization dates. The shaded areas denote periods of fluctuating ammonia volatilization during the tillering stage, and the inset provides an enlarged view of this region.

Figure 1 Long description
The image contains four line graphs showing ammonia emissions flux during the early and late rice seasons from the surface of paddy fields under different fertilization treatments. Each graph represents a different season and treatment combination: 2024 early-season rice, 2024 late-season rice, 2025 early-season rice, and 2025 late-season rice. The x-axis represents time in days, while the y-axis represents ammonia flux in kilograms per hectare per day. Different symbols and lines represent various fertilization treatments: CF, DF+UI1, DF+UI2, DF+UI3, DF+UI4, DF+UI5, and CK. The shaded areas denote periods of fluctuating ammonia volatilization during the tillering stage, with insets providing an enlarged view of these regions. Arrows indicate the fertilization dates. The graphs show initial peaks in ammonia flux followed by a decline over time, with variations depending on the treatment. All values are approximated.
Cumulative ammonia emissions under different fertilization treatments during the early-and late-rice growing seasons

Table 2 Long description
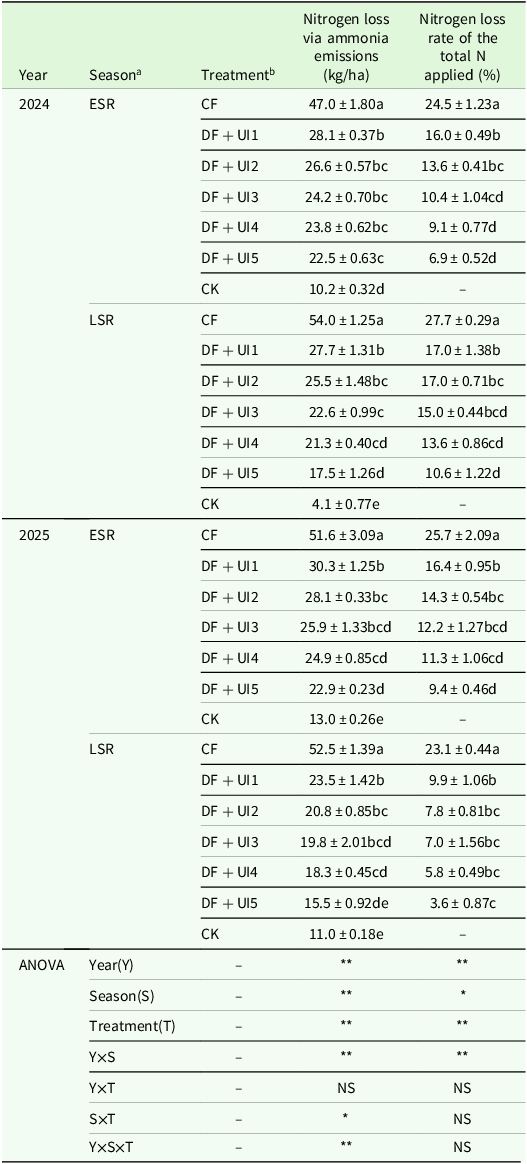
The table presents data on nitrogen loss via ammonia emissions and the nitrogen loss rate of total nitrogen applied under various treatments during the early and late rice growing seasons in 2024 and 2025. The table has 19 rows and 5 columns. The columns are labeled Year, Season, Treatment, Nitrogen loss via ammonia emissions (kg/ha), and Nitrogen loss rate of the total N applied (percentage). The rows are labeled with the year (2024 or 2025), the season (ESR or LSR), and the treatment (CF, DF + UI1, DF + UI2, DF + UI3, DF + UI4, DF + UI5, or CK). The table shows the nitrogen loss via ammonia emissions and the nitrogen loss rate of the total nitrogen applied for each treatment. Notable trends include higher nitrogen loss under CF treatment compared to other treatments, and a general reduction in nitrogen loss with increasing UI dosage. The data highlights the effectiveness of deep placement with reduced nitrogen combined with different UI dosages in reducing daily ammonia fluxes throughout the rice growing season.
a ESR, early-season rice; LSR, late-season rice.
b CK, no nitrogen fertilizer; CF, 100% Urea-N; DF, side-deep fertilization reduces nitrogen by 30%; UI, urease inhibitor; DF + UI1, DF with 0.5% UI; DF + UI2, DF with 0.75% UI; DF + UI3, DF with 1.0% UI; DF + UI4, DF with 1.25% UI; DF + UI5, DF with 1.5% UI, respectively. Data are means ± SE. Different letters indicate significant differences among treatments within the same year at the 5% level (Tukey’s Honestly Significant Difference (HSD) test).
*Significant at the 0.05 probability level. **Significant at the 0.01 probability level. NS, non-significant.
ANOVA revealed that the three factors, year (Y), season (S) and fertilization treatment (T), significantly affected the N loss via NH3 emissions and the N loss rate of the total N applied (P < 0.01). The Y×S significantly affected N loss via NH3 and the total N loss rate (P < 0.01). The interaction between S×T significantly affected the N loss via NH3, while the interaction between Y×T had no significant effect (P > 0.05). The interaction of Y×S×T significantly affected the N loss via NH3 only (P < 0.01, Table 2). CK treatment significantly reduced soil NH3 emissions, with ESR and LSR being 10.1, 4.1 (2024) and 13.0, 11.0 kg N/ha (2025), respectively (P < 0.05). CF resulted in higher cumulative NH3 volatilization losses than the reduced N rate combined with UI treatments. In 2024, CF in early and late rice led to cumulative NH3 volatilization losses of 46.9 and 54.0 kg N/ha, which were 40.2–52.1 and 36.4–63.2% higher than those in the DF + U1-U5 treatments, respectively. In 2025, the cumulative volatile loss of NH3 in early and late rice under CF treatment reached 51.6 and 52.5 kg N/ha, which were 41.3–54.8 and 55.3–70.5% higher than those under DF + U1-U5 treatments, respectively (Table 2, P < 0.05). The NH3 emissions in UI treatments ranked as follows (from low to high): DF + UI5 < DF + UI4 < DF + UI3 < DF + UI2 < DF + UI1, with no significant differences (P > 0.05) between DF + UI3 and DF + UI4. In 2024, the NH3 volatilization loss rate of CF treatment was the highest, with an ESR of 24.5% and an LSR of 27.7%. Compared with CF treatment, DF + UI1-5 treatment reduced the NH3 volatilization loss rate by 8.5–17.6% and 9.1–16.9%. In 2025, the NH3 volatilization loss rate of CF treatment was the highest, with an ESR of 25.7% and an LSR of 23.1%. Compared with that of CF treatment, the NH3 volatilization loss rate of DF + UI1-5 treatment was reduced by 12.0–22.3% and 13.4–19.7% respectively.
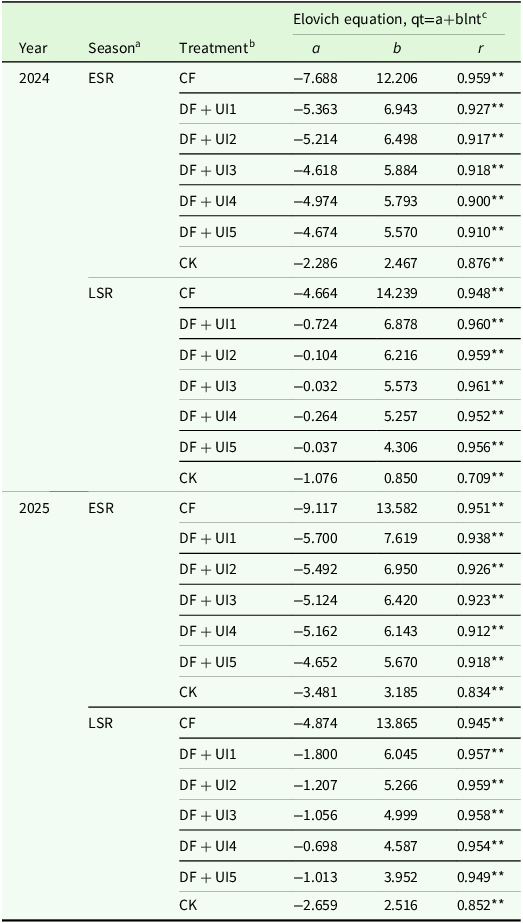
The regression equation for the effects of fertilization on cumulative NH3 emissions was established through linear regression analysis, with cumulative NH3 emission (qt) and the natural logarithm of time (ln t) as the dependent and independent variables, respectively. In both ESR and LSR, the regression coefficient (b) in the fitted equation was greater in CF treatment than in UI treatments (Table 3). Furthermore, UI treatments resulted in lower NH3 volatilization losses than CF. Particularly, within UI treatments, coefficient b exhibited an increasing trend as the inhibitor application rate decreased.
Release kinetic parameters of ammonia emissions accumulation under different treatments in early-and late-rice growing seasons

Table 3 Long description
The table presents release kinetic parameters of ammonia emissions under various treatments in early and late rice growing seasons. It includes data for the years 2024 and 2025, with seasons labeled as ESR and LSR. The treatments are CF, DF with UI1 to UI5, and CK. The table has 18 rows and 5 columns, with column headers Year, Season, Treatment, Elovich equation qt=a+blnt a, Elovich equation qt=a+blnt b, and Elovich equation qt=a+blnt r. Each row provides specific values for the parameters a, b, and r for each treatment and season. Notable trends include varying values of a, b, and r across different treatments and seasons, indicating differences in ammonia emission kinetics.
a ESR, early-season rice; LSR, late-season rice.
b CK, no nitrogen fertilizer; CF, 100% Urea-N; DF, side-deep fertilization reduces nitrogen by 30%; UI, urease inhibitor; DF + UI1, DF with 0.5% UI; DF + UI2, DF with 0.75% UI; DF + UI3, DF with 1.0% UI; DF + UI4, DF with 1.25% UI; DF + UI5, DF with 1.5% UI, respectively.
c a, b, function coefficient; r, Coefficient of determination.
*and ** indicate significant differences at the 0.05 and 0.01 levels.
NH4 +-N concentrations, pH of the surface water and soil urease activity
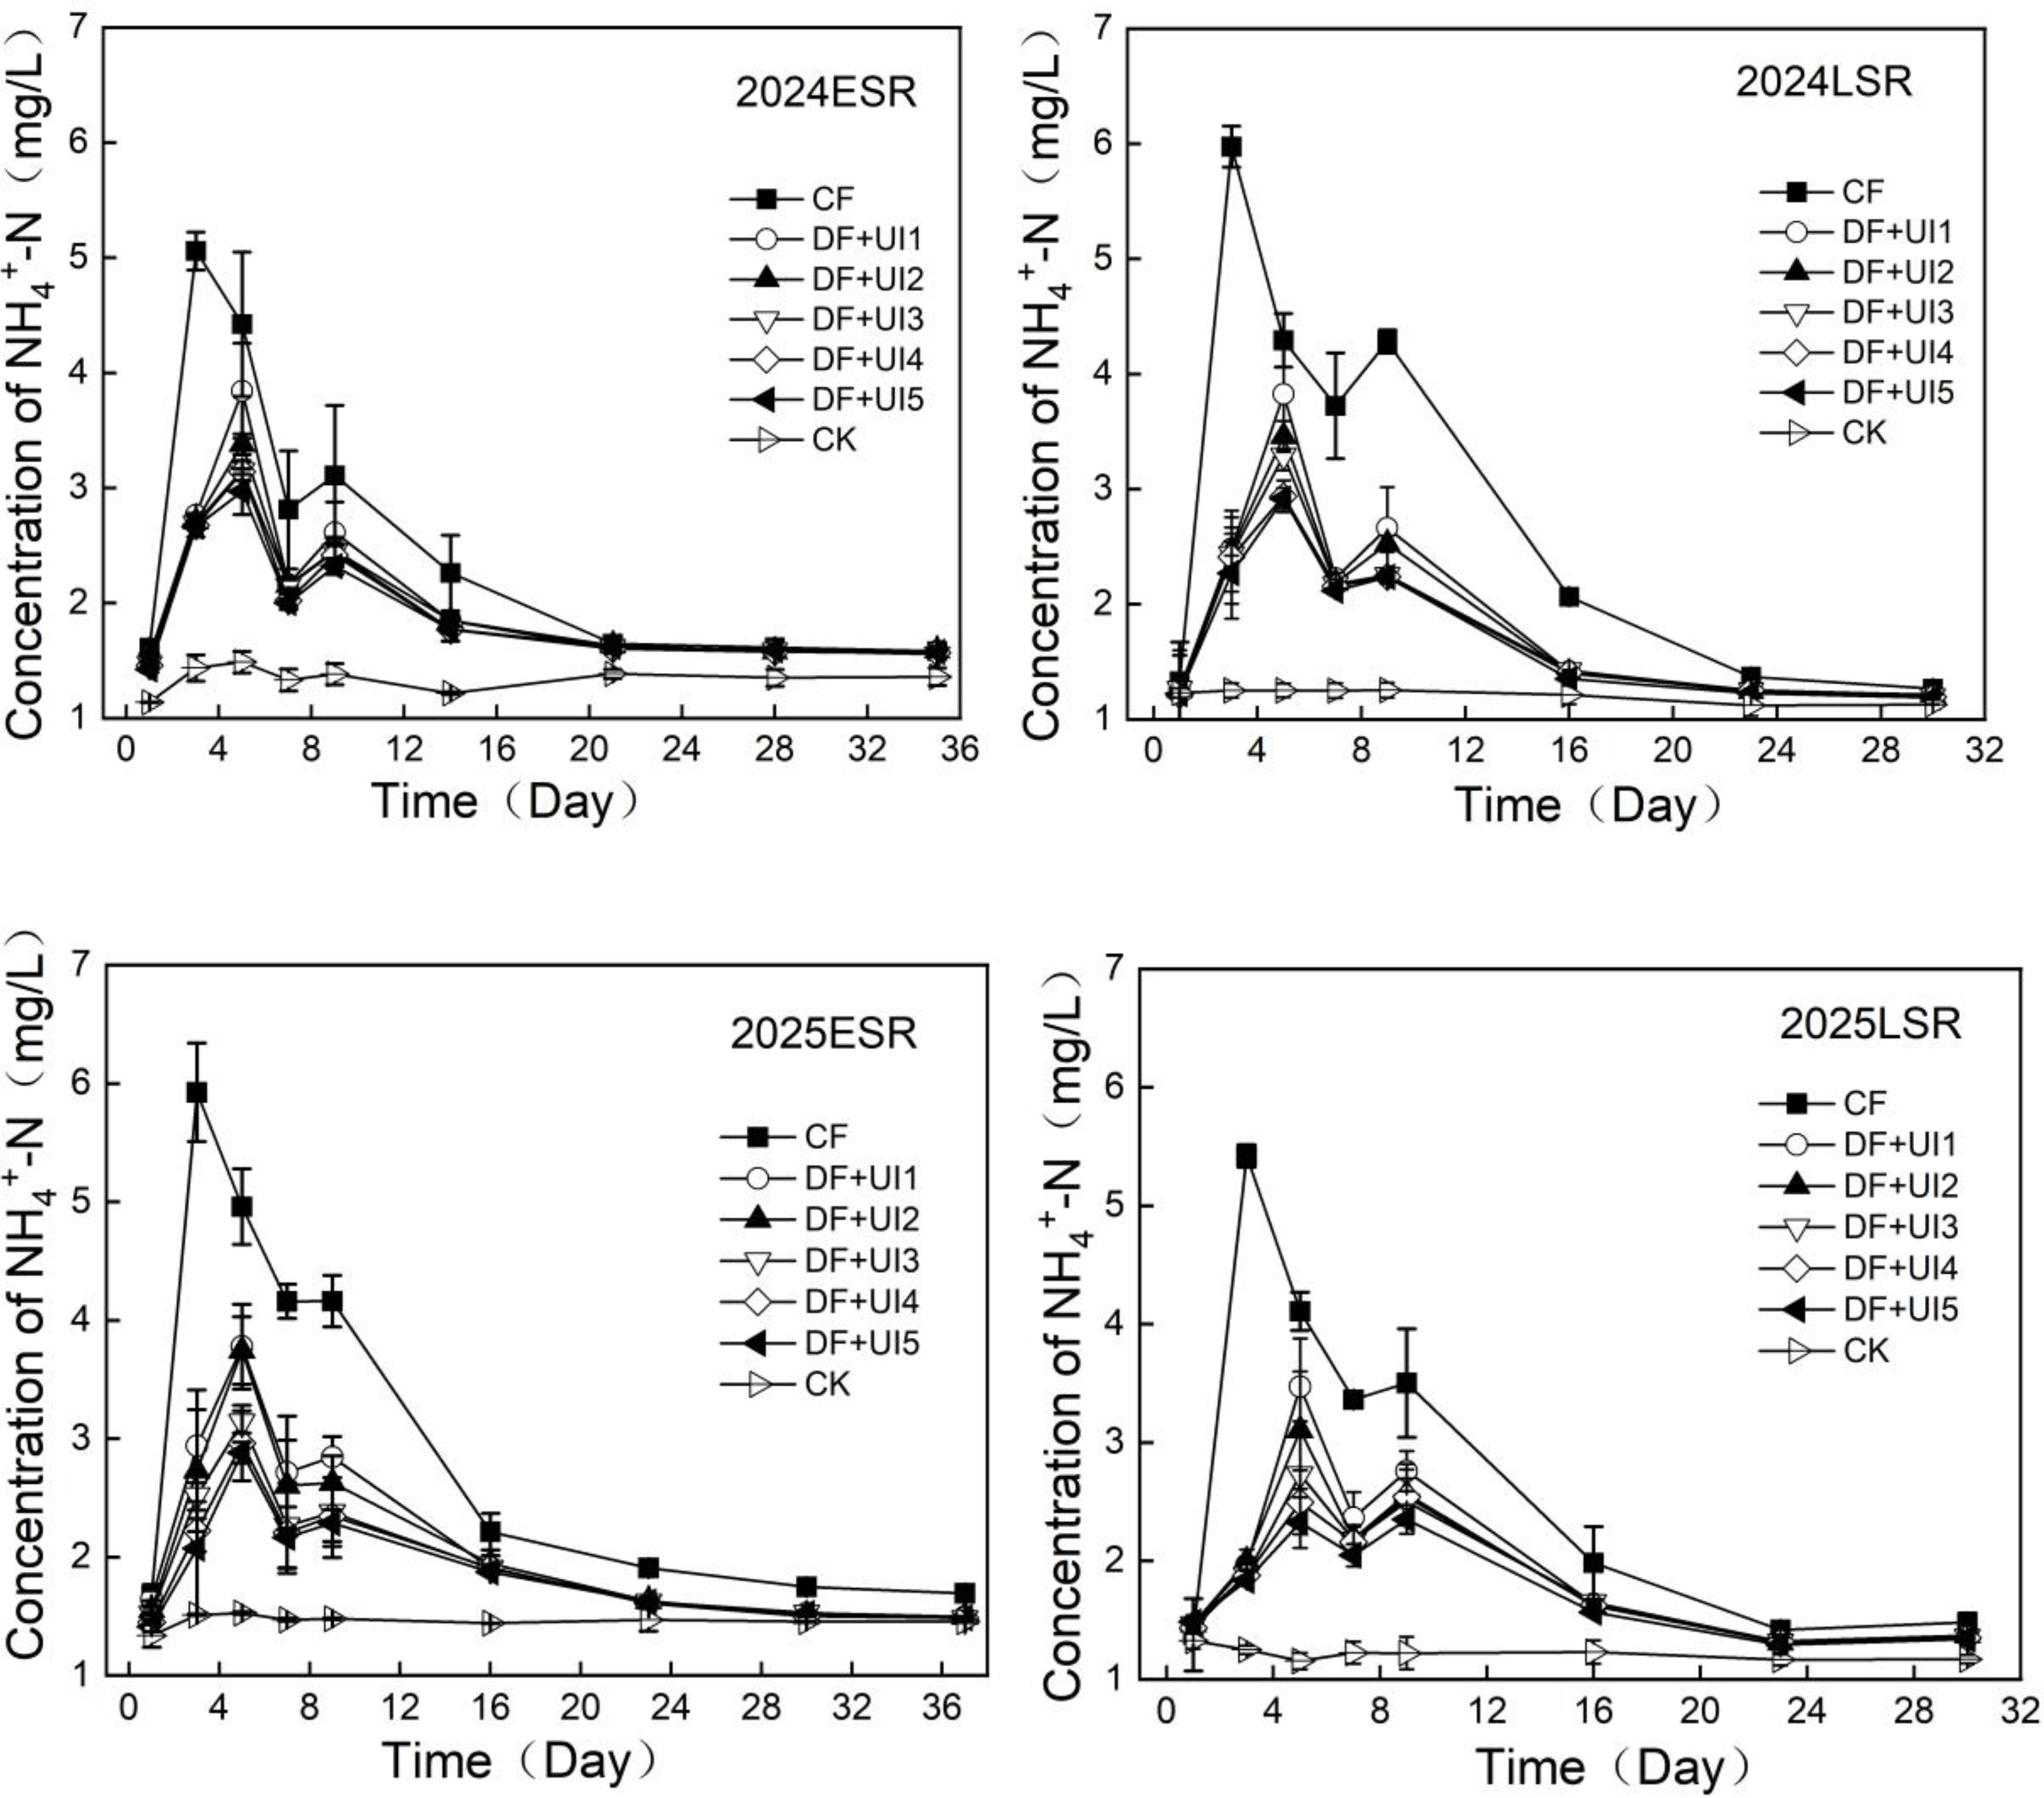
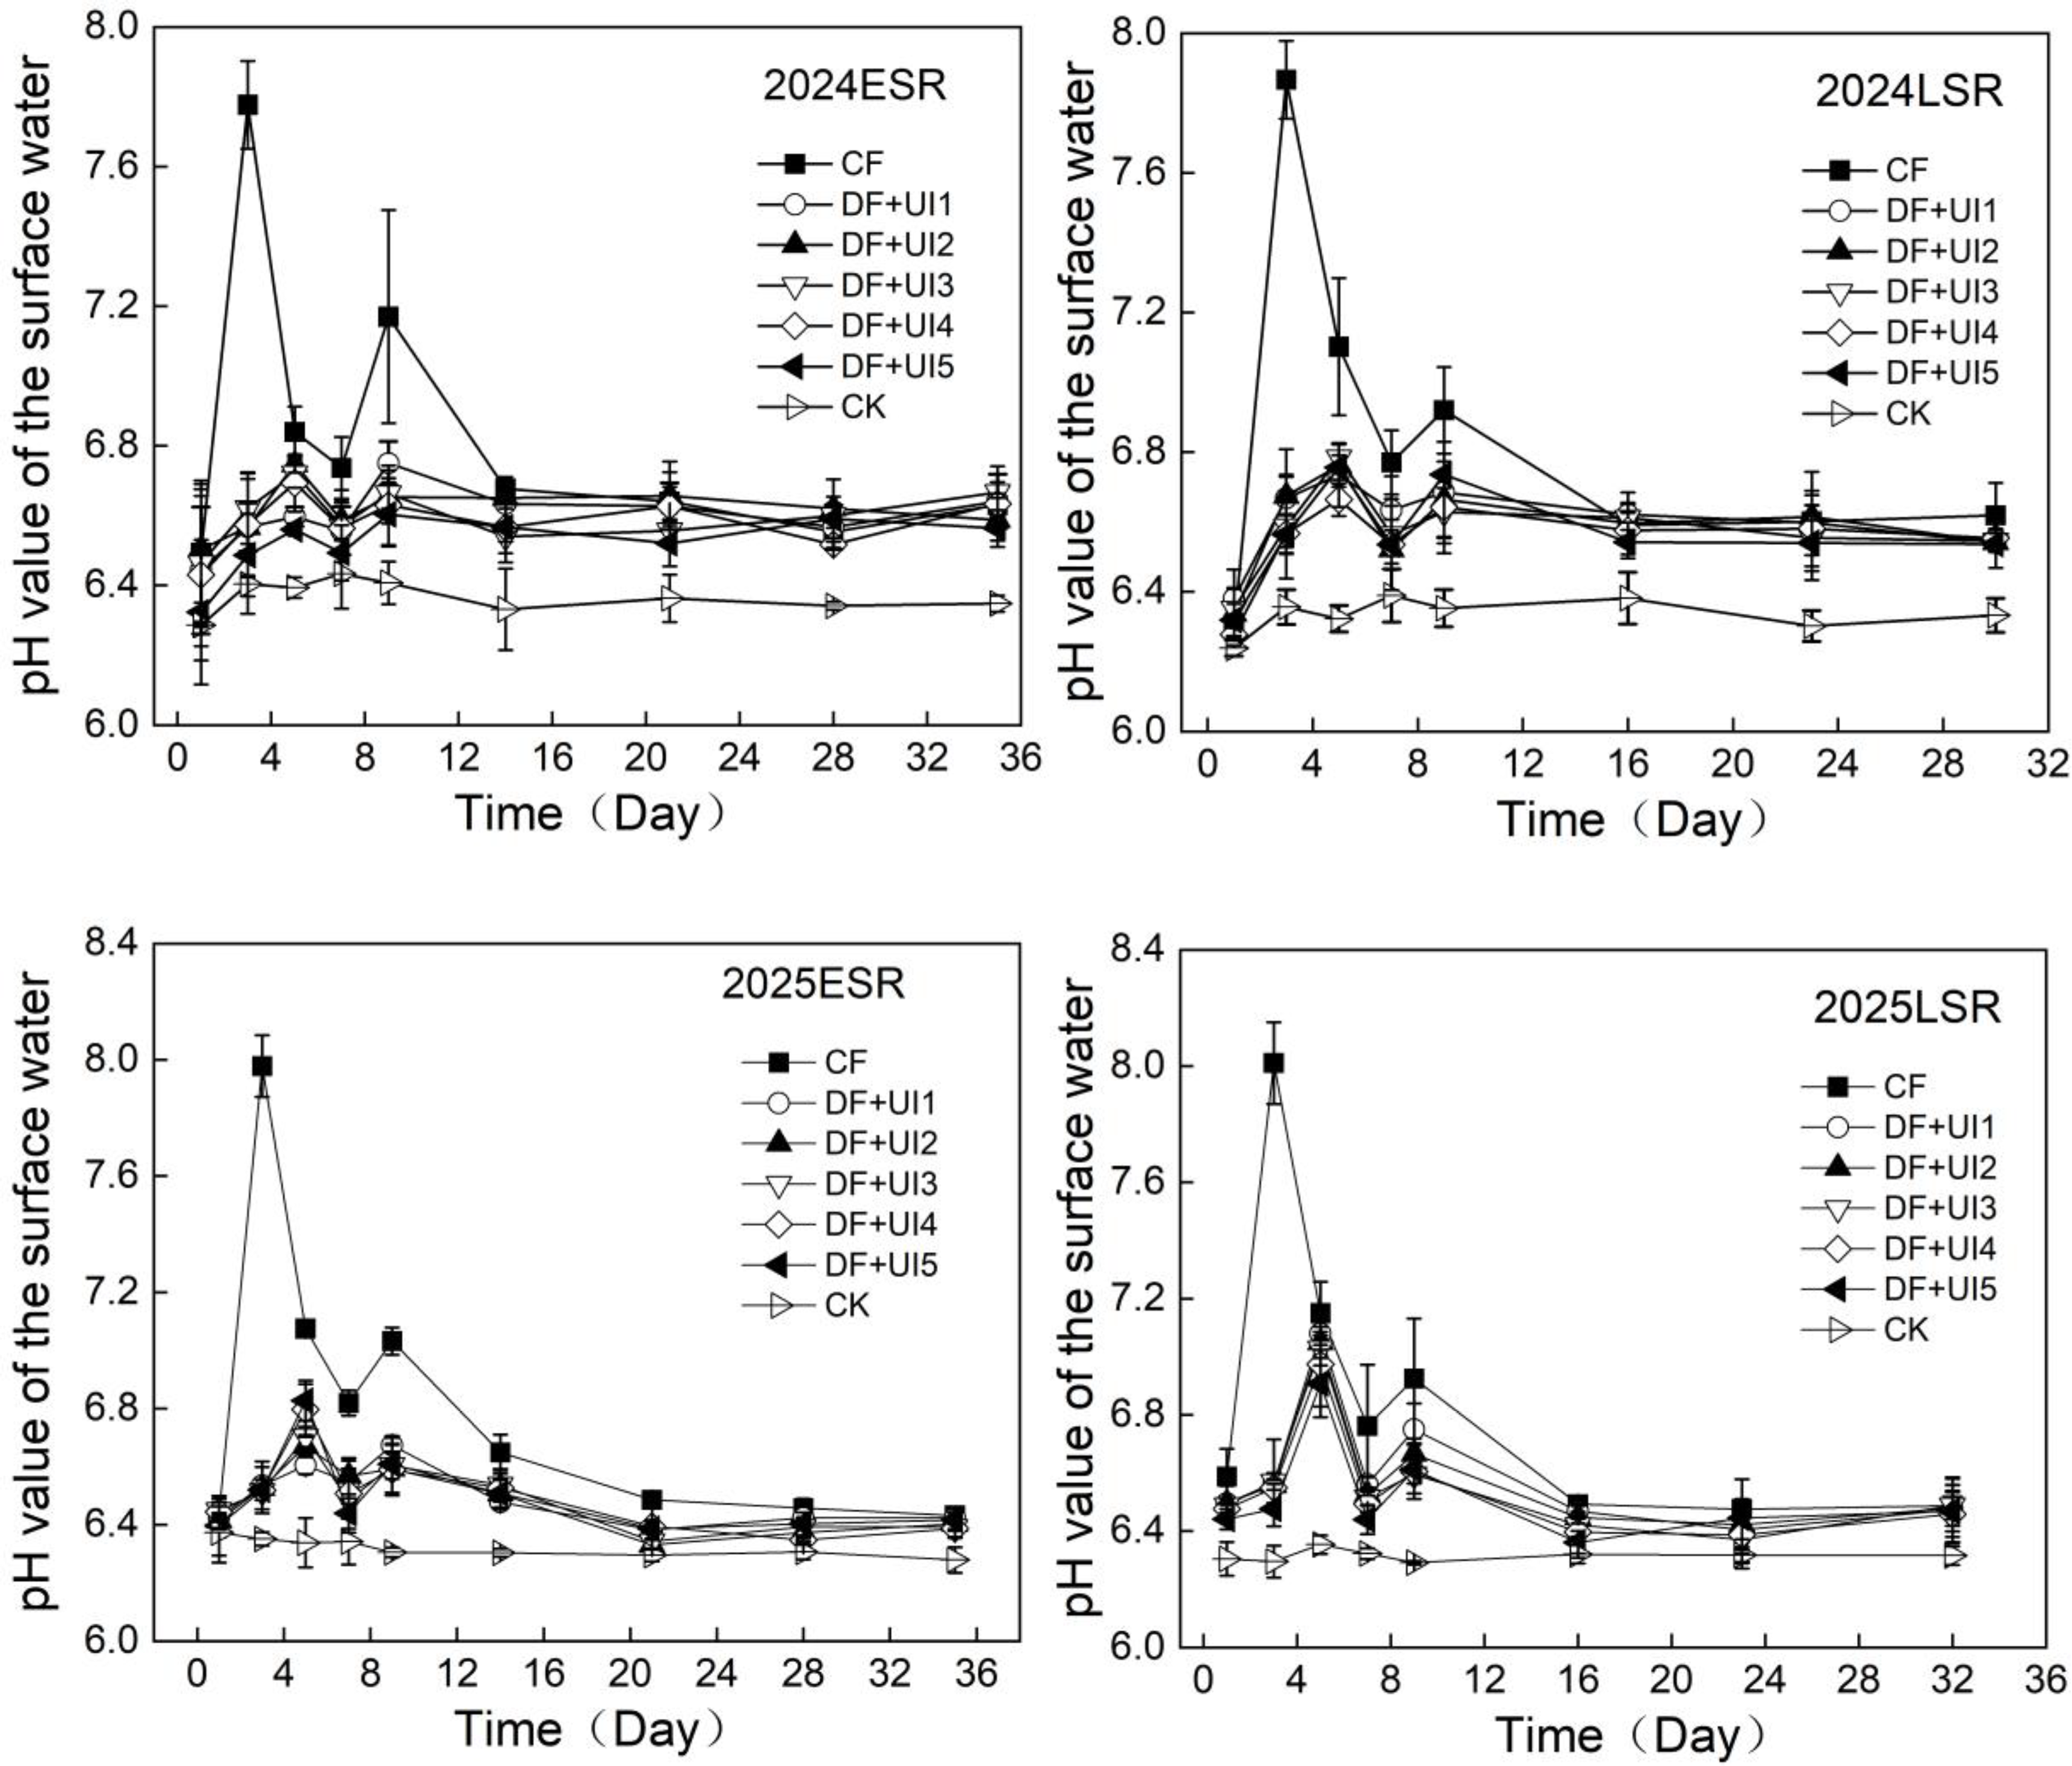
The daily concentration of NH4 +-N in surface water and the flux of NH3 exhibited similar seasonal trends (Figure 2). The peak of ammonium N was delayed in synchronization with the NH3 volatilization flux, and the overall peak concentration of ammonium N was low. DF + UI treatment effectively reduced the average level of NH4 +-N in the first week after fertilization. In 2024, the peak concentrations of early and late rice treated with DF + UI decreased by 16.21–22.42 and 34.25–48.66 mg/L, respectively, compared with those of CF treatment (P < 0.05). In 2025, the peak concentrations of early and late rice decreased by 19.35–43.47 and 31.94–56.77 mg/L, respectively, compared with those of CF treatment (P < 0.05). Additionally, after fertilization, the pH values of the N fertilizer treatment all fluctuated. The peak pH value of the surface water treated with DF + UI was lower than that of surface water treated with CF, and the DF + UI treatment alleviated the sharp increase in pH (Figure 3). The peak pH values of surface water treated by CF for ESR and LSR were 7.78 and 7.87 (2024) and 7.98 and 8.01 (2025), while those treated by DF + UI were 6.56–6.75 and 6.66–6.78 (2024), and 6.67–6.83 and 7.91–9.08 (2025), respectively.
Ammonium nitrogen concentration of surface water during the early-and late-rice seasons from the surface of paddy fields under different fertilization treatments. CK, no nitrogen fertilizer; CF, 100% Urea-N; DF, side-deep fertilization reduces nitrogen by 30%; UI, urease inhibitor; DF+UI1, DF with 0.5% UI; DF+UI2, DF with 0.75% UI; DF+UI3, DF with 1.0% UI; DF+UI4, DF with 1.25% UI; DF+UI5, DF with 1.5% UI, respectively. ESR, early-season rice; LSR, late-season rice. Ammonium nitrogen concentration, NH4 +-N. Bars represent standard error of the mean (SEM; n = 3).

Figure 2 Long description
Four line graphs depict ammonium nitrogen concentration in surface water during early and late rice seasons under different fertilization treatments. The graphs compare treatments such as no nitrogen fertilizer, 100 percent urea nitrogen, side deep fertilization with reduced nitrogen, and side deep fertilization combined with varying percentages of urease inhibitor. Each graph represents data for early season rice and late season rice. The x-axis shows time in days, while the y-axis shows the concentration of ammonium nitrogen in milligrams per liter. Different lines represent various treatments, including control, urea nitrogen, and combinations of side deep fertilization with urease inhibitors at different concentrations. The graphs show peaks in ammonium nitrogen concentration around day 4, followed by a decline over time. The treatments with higher percentages of urease inhibitors generally show lower peaks and faster declines in concentration. All values are approximated.
The pH of surface water during the early-and late-rice seasons from the surface of paddy fields under different fertilization treatments. CK, no nitrogen fertilizer; CF,100% Urea-N; DF, side-deep fertilization reduces nitrogen by 30%; UI, urease inhibitor; DF+UI1, DF with 0.5% UI; DF+UI2, DF with 0.75% UI; DF+UI3, DF with 1.0% UI; DF+UI4, DF with 1.25% UI; DF+UI5, DF with 1.5% UI, respectively. ESR, early-season rice; LSR, late-season rice. Bars represent standard error of the mean (SEM; n = 3).

Figure 3 Long description
The image contains four line graphs that compare the pH values of surface water in paddy fields under different fertilization treatments during the early and late rice seasons. Each graph represents a different season and treatment combination: 2024 early-season rice (ESR), 2024 late-season rice (LSR), 2025 early-season rice (ESR), and 2025 late-season rice (LSR). The x-axis of each graph represents time in days, ranging from 0 to 36 days. The y-axis represents the pH value of the surface water, ranging from 6.0 to 8.0. Different symbols and lines represent various treatments: CF, DF+UI1, DF+UI2, DF+UI3, DF+UI4, DF+UI5, and CK. The graphs show fluctuations in pH values over time for each treatment. Bars represent the standard error of the mean (SEM) with n equals 3. The treatments include no nitrogen fertilizer (CK), 100% Urea-N (CF), side-deep fertilization with reduced nitrogen by 30% (DF), and DF combined with different percentages of urease inhibitor (UI). The graphs illustrate how different fertilization treatments affect the pH levels of surface water in paddy fields over time.
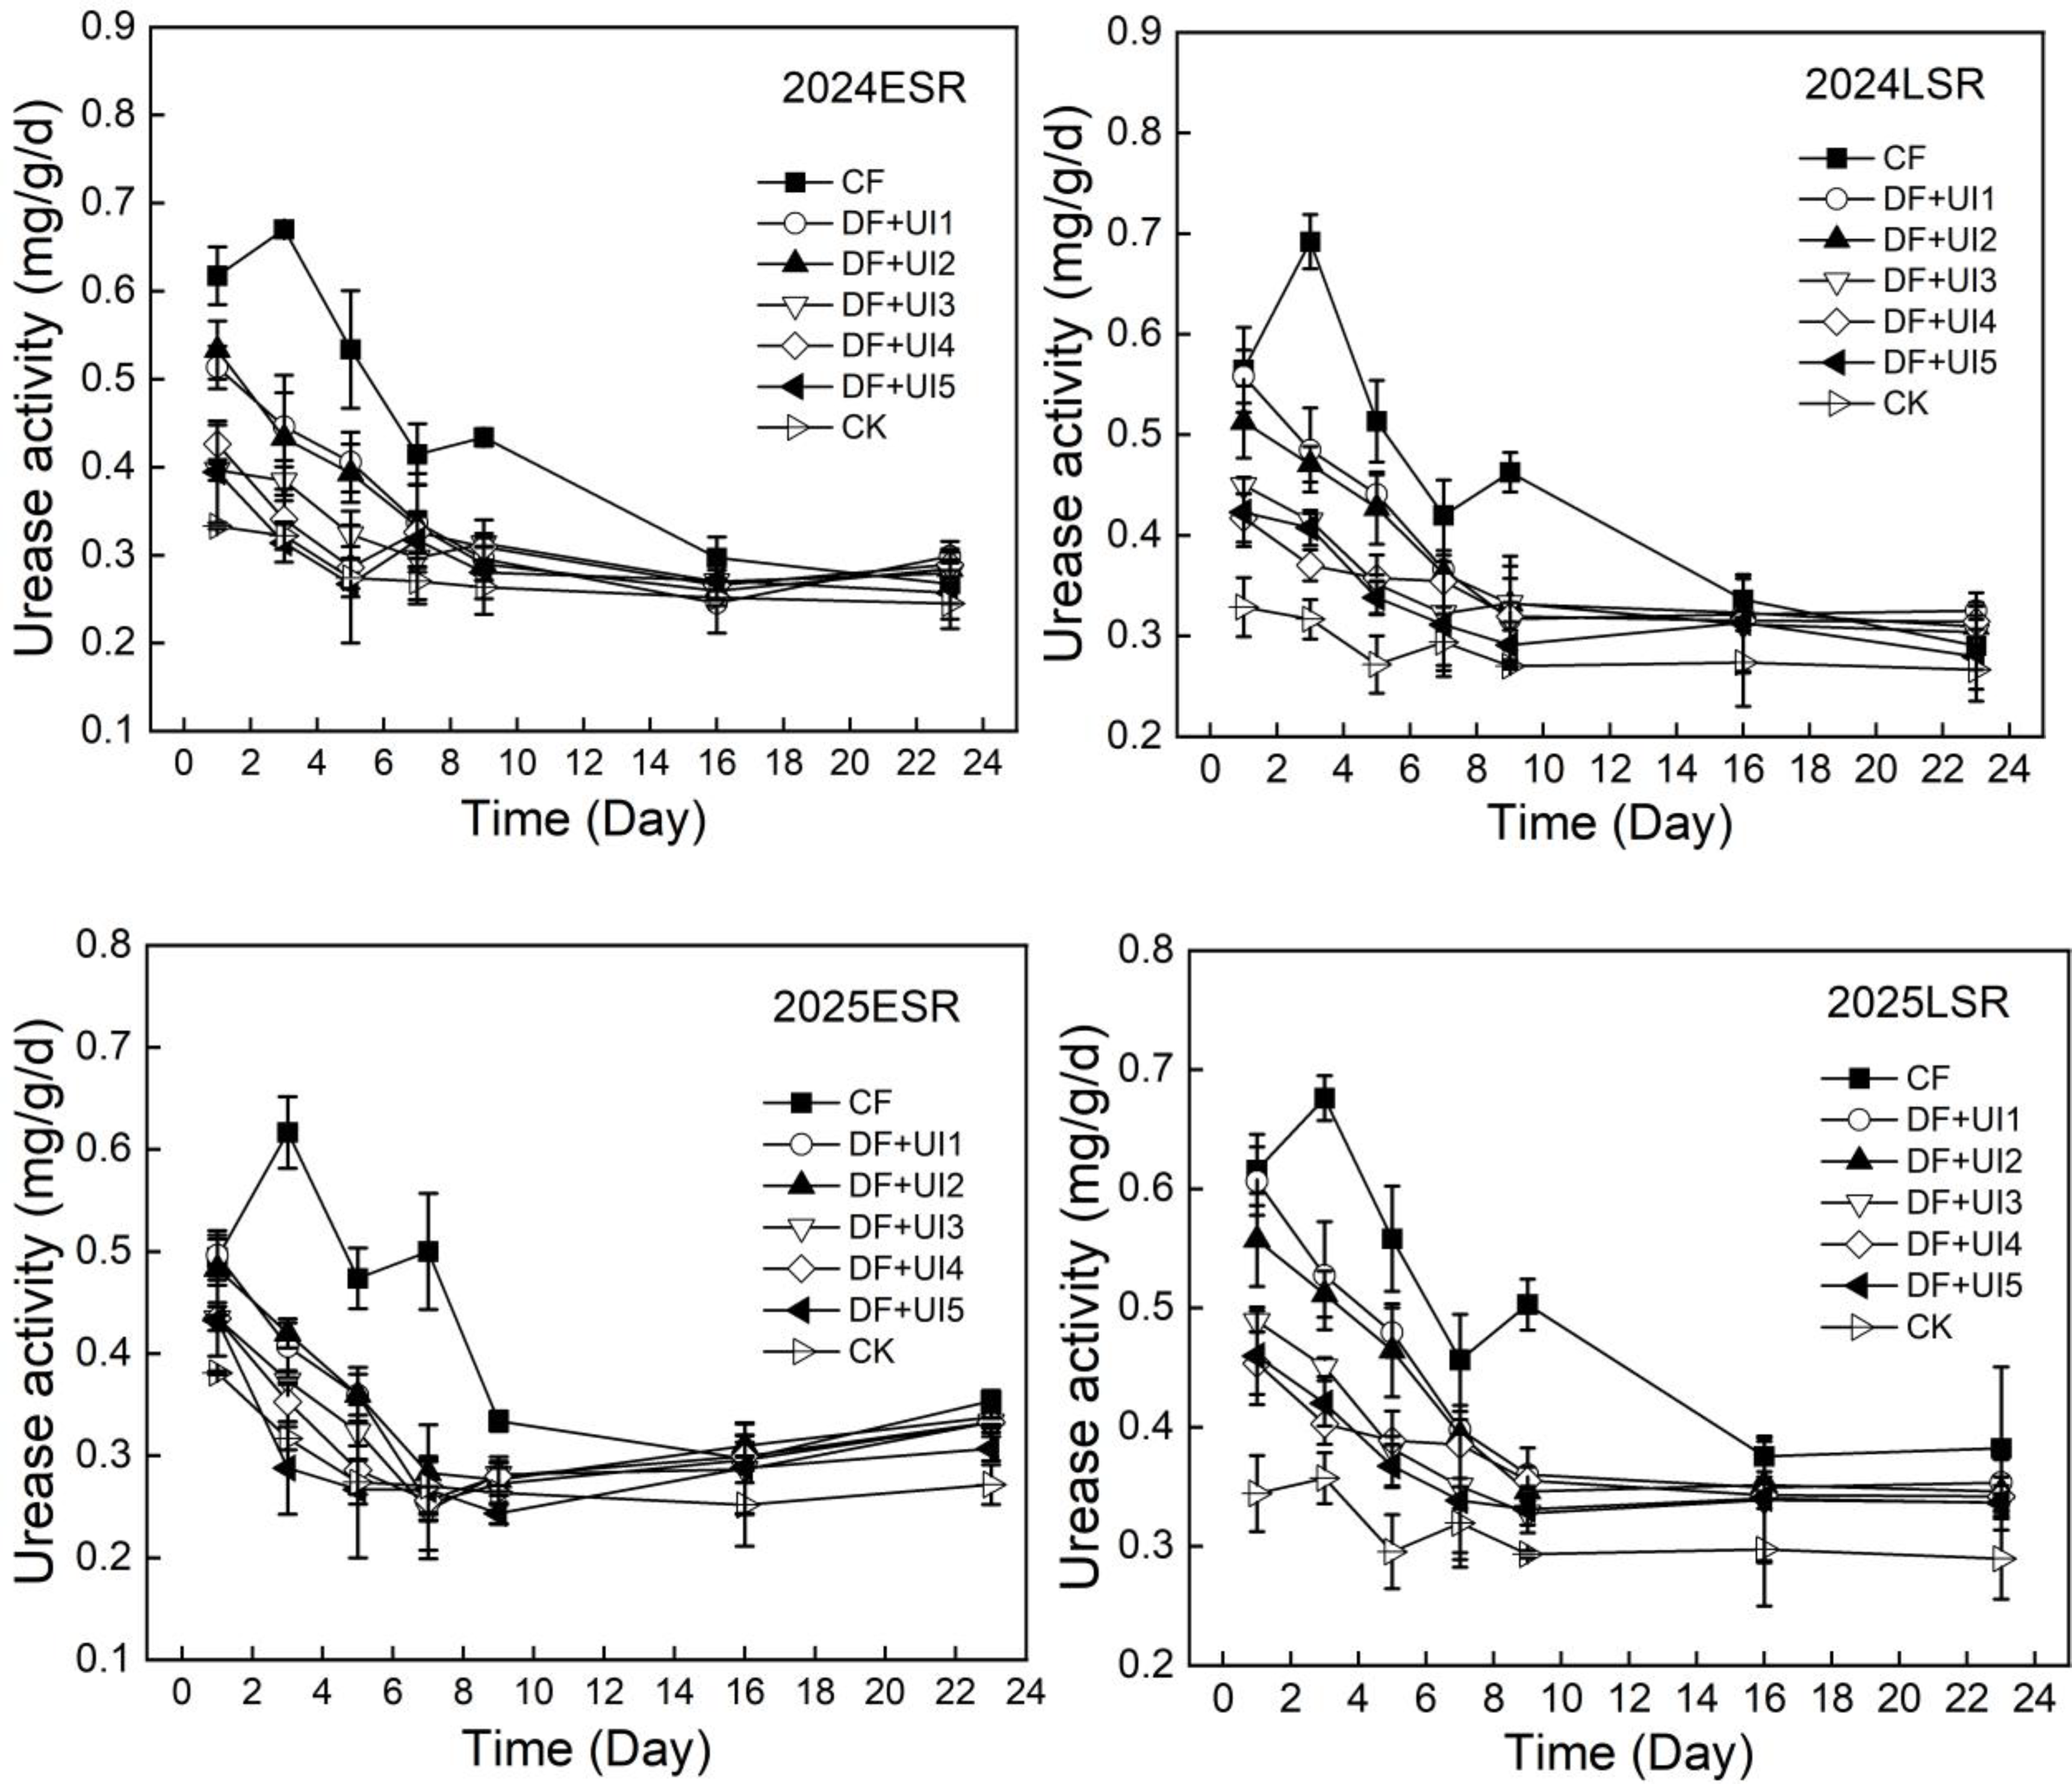
Figure 4 shows the temporal variation pattern of soil urease activity during the double-cropping rice growth season. In the initial stage after fertilization, compared with that of the treatment of applying urea alone, the soil urease activity in the treatment with the UI was significantly reduced (P < 0.05), indicating that the inhibitor produced the expected direct inhibitory effect. The average urease activities of early and late rice in the CF treatment were 0.50 and 0.52 mg/g/d (2024) and 0.46 and 0.51 mg/g/d (2025), respectively; those of the DF + UI treatment were 0.33–0.39 and 0.37–0.44 mg/g/d (2024) and 0.30–0.35 and 0.38–0.45 mg/g/d (2025), respectively.
Urease activity during the early-and late-rice seasons from paddy fields under different fertilization treatments. CK, no nitrogen fertilizer; CF, 100% Urea-N; DF, side-deep fertilization reduces nitrogen by 30%; UI, urease inhibitor; DF+UI1, DF with 0.5% UI; DF+UI2, DF with 0.75% UI; DF+UI3, DF with 1.0% UI; DF+UI4, DF with 1.25% UI; DF+UI5, DF with 1.5% UI, respectively. ESR, early-season rice; LSR, late-season rice. Bars represent standard error of the mean (SEM; n = 3).

Figure 4 Long description
The image contains four line graphs showing urease activity in rice fields under different fertilization treatments during the early and late rice seasons. Each graph represents a different season: 2024 early-season rice (ESR), 2024 late-season rice (LSR), 2025 early-season rice (ESR), and 2025 late-season rice (LSR). The x-axis of each graph represents time in days, ranging from 0 to 24 days. The y-axis represents urease activity in milligrams per gram per day, ranging from 0.1 to 0.9. The graphs compare different treatments: CK (no nitrogen fertilizer), CF (100% Urea-N), DF (side-deep fertilization reduces nitrogen by 30%), and DF combined with various percentages of urease inhibitor (UI1 to UI5). Each treatment is represented by a different symbol and color. The graphs show that urease activity peaks early and then declines over time for all treatments. The CF treatment consistently shows higher urease activity compared to other treatments. The DF treatments combined with urease inhibitors show varying levels of urease activity, generally lower than CF but higher than CK. The standard error of the mean (SEM) is represented by bars. All values are approximated.
Grain yield and yield components
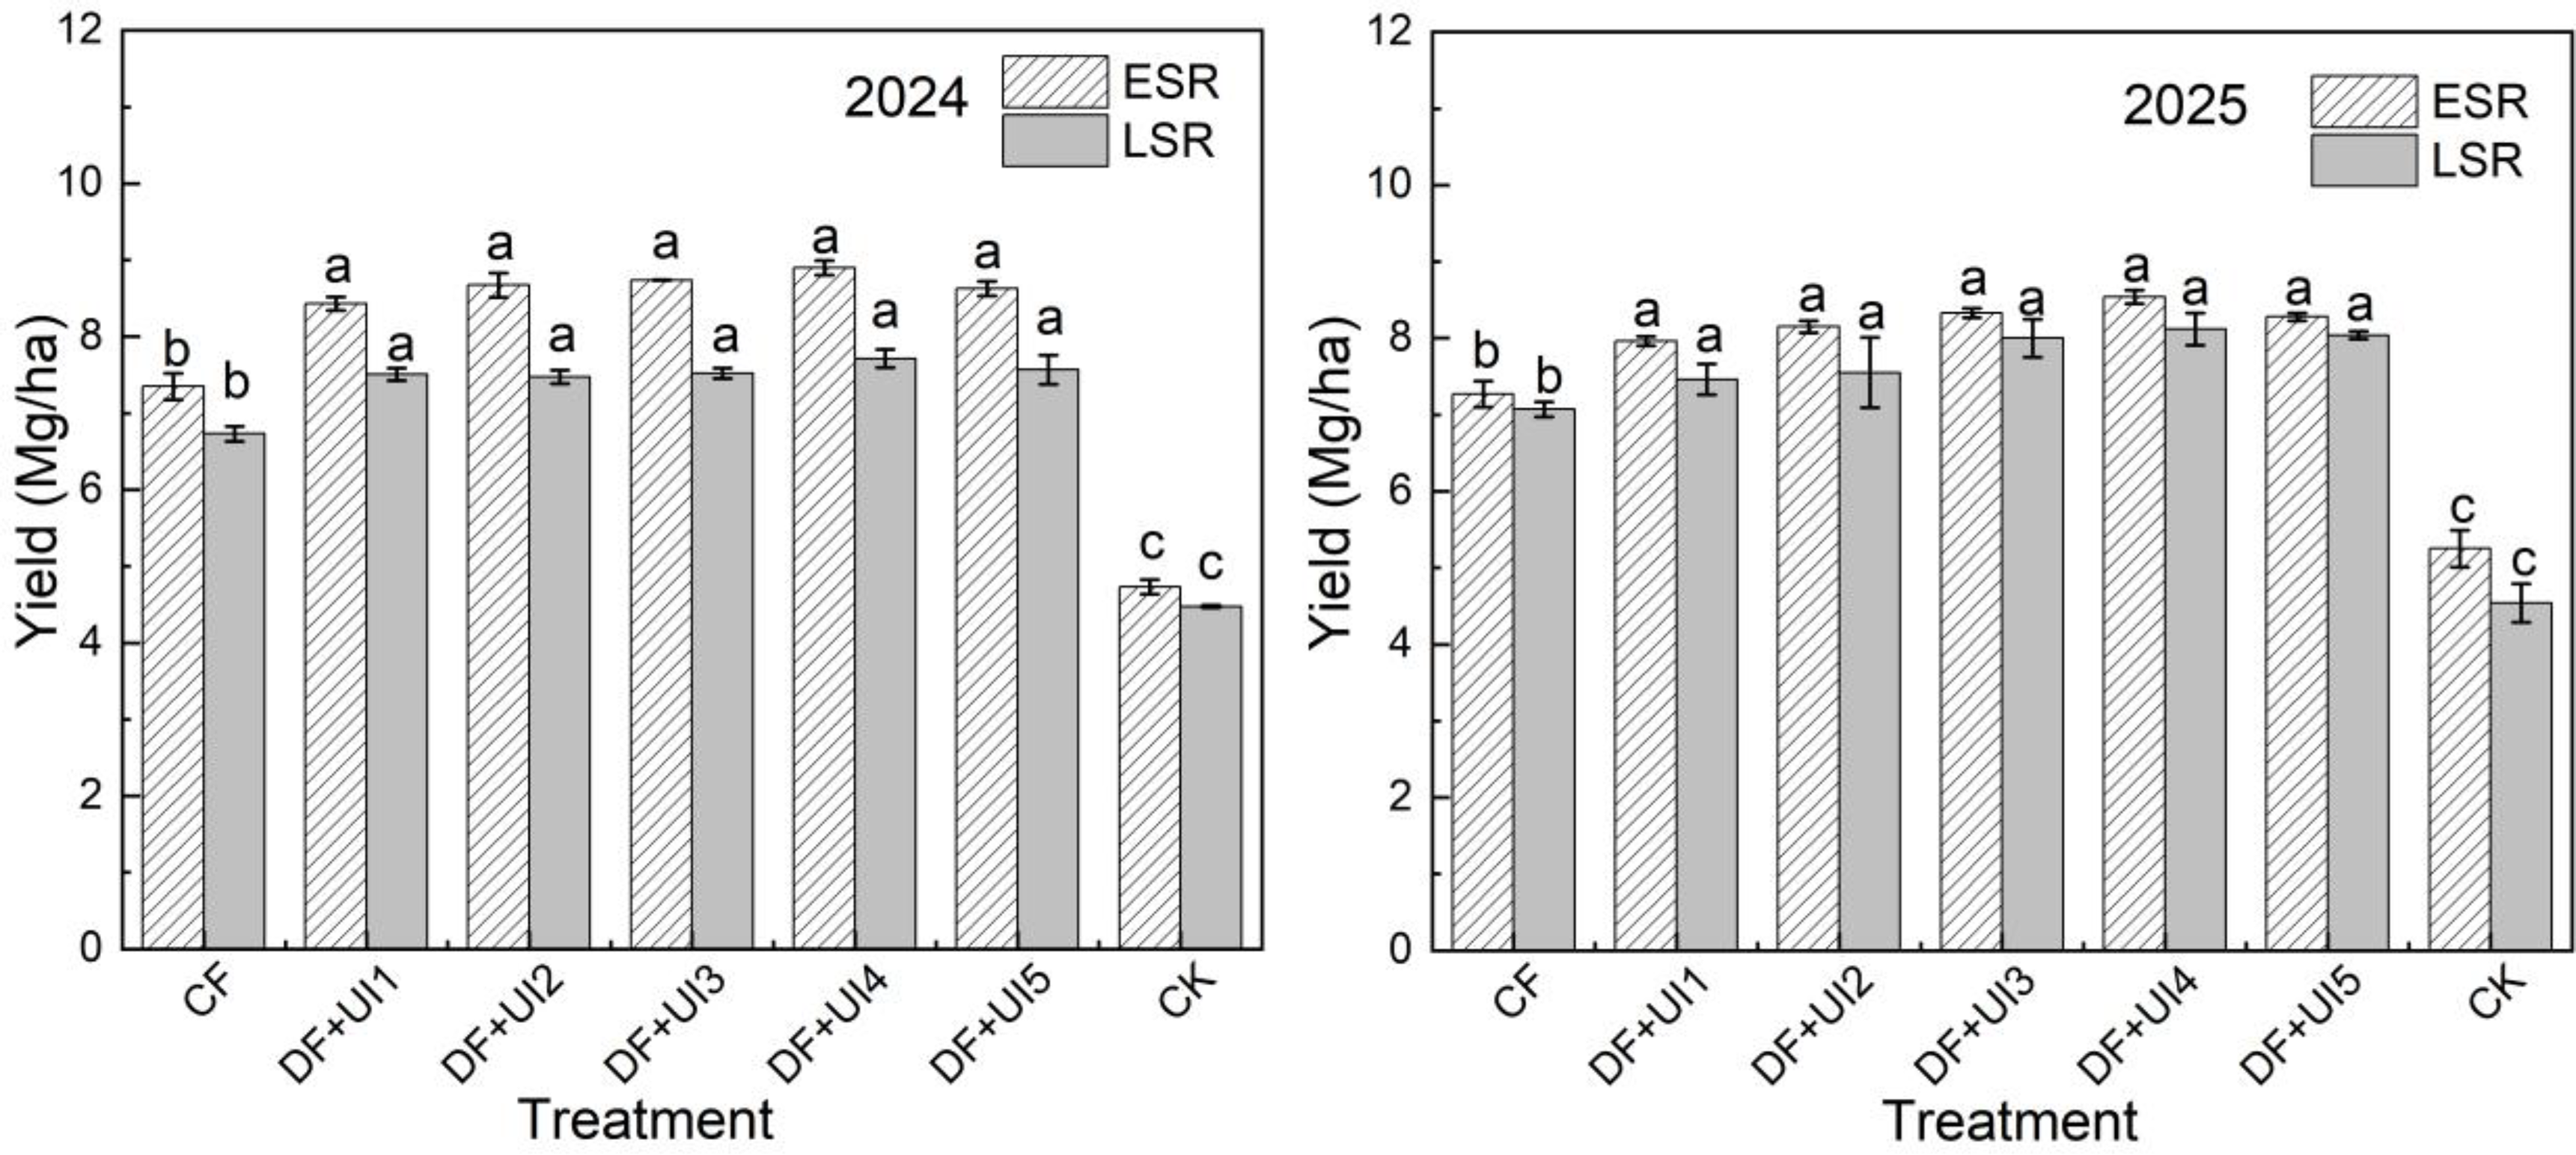
Significant variations in grain yield were observed among different fertilization treatments in the double-cropping rice system (Figure 5). Compared with the control (CK), all the treatments with N application significantly increased the yield (P < 0.05). In the urea treatment, the DF + UI4 treatment achieved a grain yield of 8.9 and 7.2 Mg/ha (2024) and 8.5 and 8.1 Mg/ha (2025) of ESR and LSR crops, respectively. The grain yield performance among different treatments showed significant differences between the two growing seasons. The yield of the DF + UI treatment was significantly higher than that of the CF treatment. For ESR and LSR, the yields increased by 14.7–21.1% and 11.1–14.6% (2024, P < 0.05), and 9.4–17.5% and 5.6–14.9% (2025), respectively. These results indicate that the method of combining DF with NBPT is an effective agronomic strategy for improving the productivity of the double-cropping rice system. Although there were seasonal variations in the treatment effects, the overall benefits remained consistent across different growing seasons.
Grain yield of double-cropping rice under different fertilization treatments. CK, no nitrogen fertilizer; CF, 100% Urea-N; DF, side-deep fertilization reduces nitrogen by 30%; UI, urease inhibitor; DF+UI1, DF with 0.5% UI; DF+UI2, DF with 0.75% UI; DF+UI3, DF with 1.0% UI; DF+UI4, DF with 1.25% UI; DF+UI5, DF with 1.5% UI, respectively. ESR, early-season rice; LSR, late-season rice. Bars represent standard error of the mean (SEM; n = 3). Different letters indicate significant differences among treatments within the same year at the 5% level (Tukey’s Honestly Significant Difference (HSD) test).

Figure 5 Long description
The bar graph compares grain yield of double-cropping rice under different fertilization treatments for the years 2024 and 2025. The x-axis represents various treatments: CK, CF, DF plus UI1 to UI5. The y-axis measures yield in megagrams per hectare, ranging from 0 to 12. Each treatment is represented by two bars: one for early-season rice (ESR) and one for late-season rice (LSR). The ESR bars are hatched, while the LSR bars are solid. The treatments include CK (no nitrogen fertilizer), CF (100% Urea-N), DF (side-deep fertilization reduces nitrogen by 30%), and DF combined with different percentages of urease inhibitor (UI1 to UI5). Bars represent standard error of the mean (SEM; n = 3). Different letters indicate significant differences among treatments within the same year at the 5% level (Tukey’s Honestly Significant Difference (HSD) test). All values are approximated.
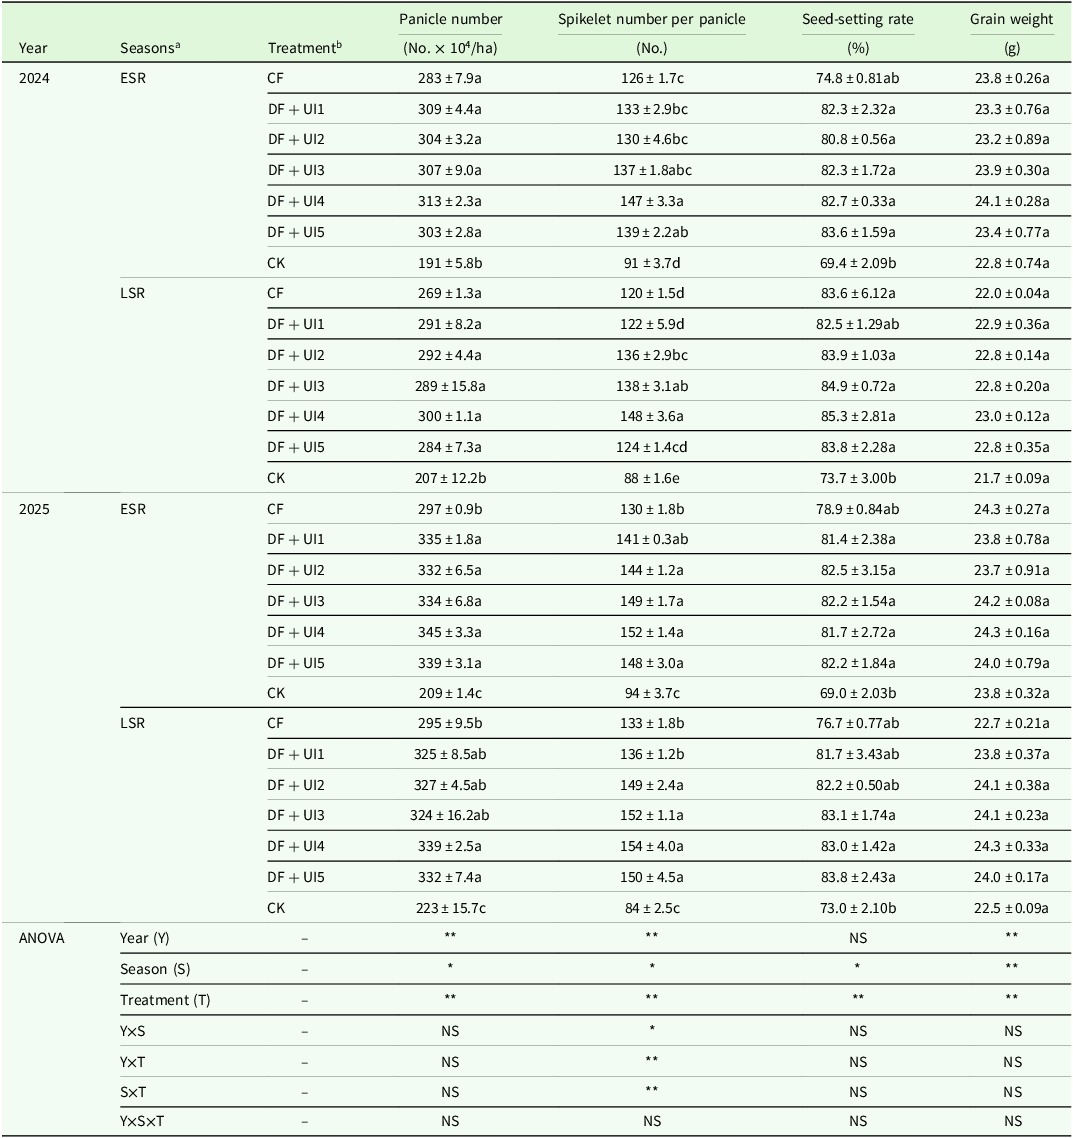
ANOVA revealed that year had no significant effect on the yield rate (P > 0.05), whereas season (P < 0.05) and fertilization treatment (P < 0.01) significantly affected the yield components. From the perspective of interaction effects, the interaction between the two had no significant effect on the number of effective ears, yield rate and 1000-grain weight (P > 0.05); Y×S×T had no significant effect on the yield components (P > 0.05; Table 4). Both treatments (CF and UI) significantly increased the spikelet number per panicle and panicle number, compared with the CK (P < 0.05). Comparative analysis indicated that the UI treatment outperformed the CF treatment in improving key yield indicators. Specifically, in ESR, the UI treatment increased the number of effective ears and the number of grains per ear by 7.1–10.7% and 3.2–16.6% (2024), 10.9–15.4% and 8.7–17.2% (2025), respectively. Similar improvements were also observed in LSR, increasing by 5.8–11.5% and 2.1–23.7% (2024), 10.0–15.1% and 2.1–16.0%, respectively (Table 4).
Yield and yield components for early-and late-season rice under different fertilization treatments

Table 4 Long description
The table presents data on yield and yield components for early and late season rice under different fertilization treatments across the years 2024 and 2025. It includes columns for year, seasons, treatment, panicle number, spikelet number per panicle, seed-setting rate, and grain weight. The table has 24 rows and 7 columns, with each row representing a specific combination of year, season, and treatment. Notable trends include significant increases in panicle number and spikelet number per panicle for both CF and UI treatments compared to CK. The UI treatment generally outperforms the CF treatment in improving key yield indicators. The ANOVA section at the bottom indicates the statistical significance of various factors on yield components.
a ESR, early-season rice; LSR, late-season rice.
b CK, no nitrogen fertilizer; CF, 100% Urea-N; DF, side-deep fertilization reduces nitrogen by 30%; UI, urease inhibitor; DF + UI1, DF with 0.5% UI; DF + UI2, DF with 0.75% UI; DF + UI3, DF with 1.0% UI; DF + UI4, DF with 1.25% UI; DF + UI5, DF with 1.5% UI, respectively.
Data are means ± SE. Different letters indicate significant differences among treatments within the same year at the 5% level (Tukey’s Honestly Significant Difference (HSD) test).
*Significant at the 0.05 probability level. **Significant at the 0.01 probability level. NS, non-significant.
Total N uptake and NUE
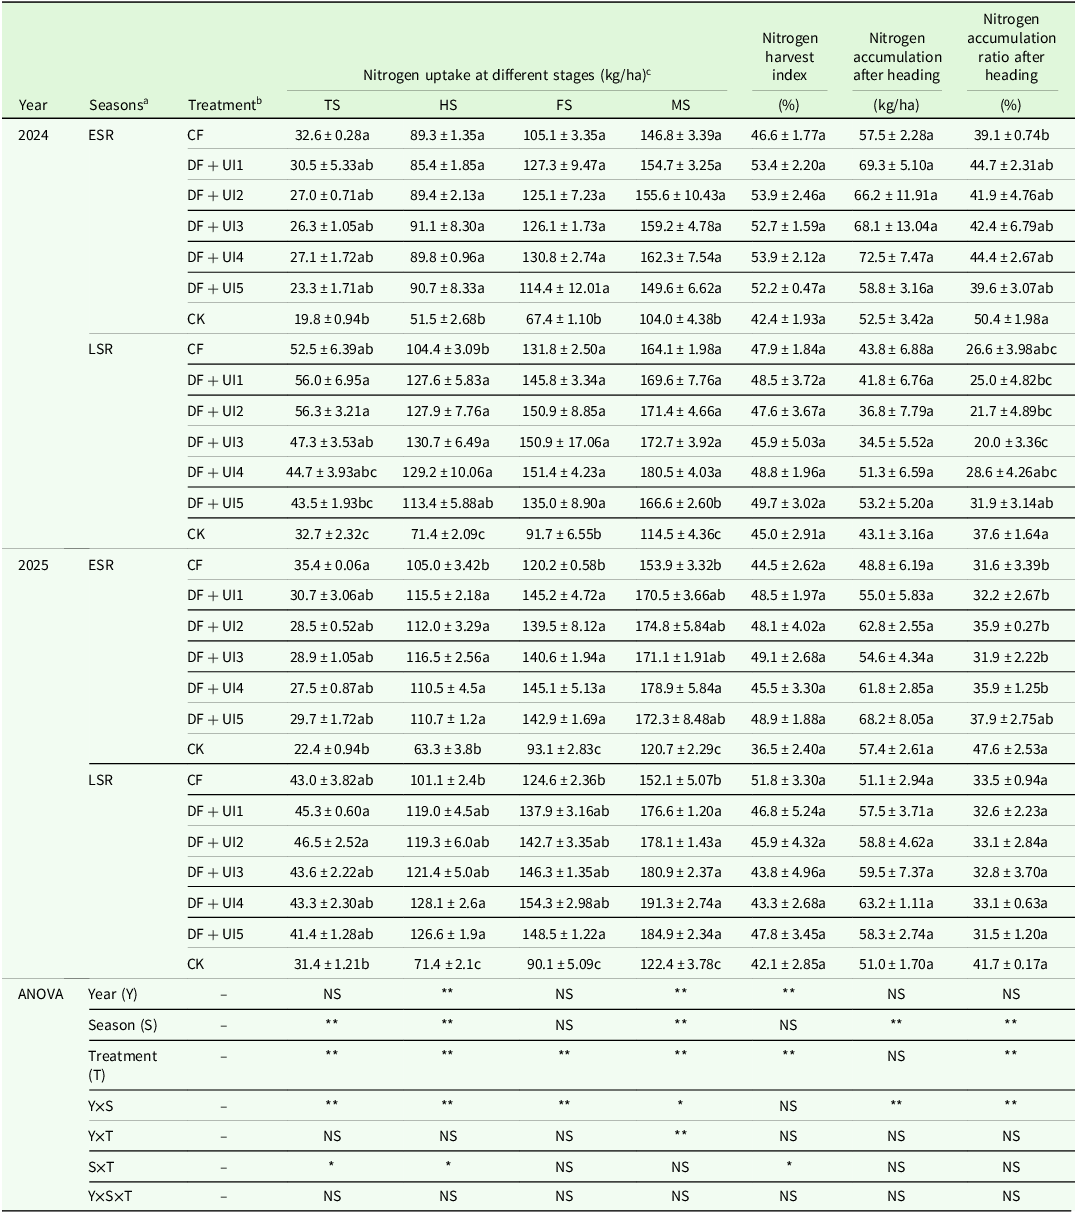
Under all treatment conditions, the N uptake of double-cropping rice showed an upward trend throughout the entire growth period, and the control group (CK) consistently exhibited the lowest value (Table 5). This indicates that the N application significantly increased N accumulation in the rice plants (P < 0.05). During the growth period, no significant differences were observed in N accumulation among different UI dosage treatments (P > 0.05). Compared with the CK treatment, N application increased the N accumulation of ESR and LSR in the mature stage by 41.2–56.0% and 43.3–57.7% (2024) and 27.5–48.3% and 24.3–56.3% (2025), respectively. Compared with that of the CF treatment, the total N accumulation of ESR and LSR in the DF + UI treatment was 1.9–10.5% and 1.7–10.0% higher (2024) and 10.8–16.3% and 16.1–25.7% higher (2025), respectively. The DF + UI4 treatment group exhibited the maximum total N accumulation of ESR and LSR of 162 and 181 kg/ha (2024) and 179 and 191 kg/ha (2025), respectively. N accumulation after heading was higher than that of the CF treatment, and the application of NBPT was beneficial for increasing the accumulation of N in the later stage of rice growth.
Nitrogen uptake at different growth stages and nitrogen harvest under different fertilization treatments in early-and late-rice growing seasons

Table 5 Long description
The table presents data on nitrogen uptake at different growth stages and nitrogen harvest under various fertilization treatments across early and late rice growing seasons. It includes measurements from the years 2024 and 2025, with treatments such as CF, DF with different UI dosages, and a control group (CK). The table has 25 rows and 13 columns, detailing nitrogen uptake at stages TS, HS, FS, and MS, as well as nitrogen harvest index, nitrogen accumulation after heading, and nitrogen accumulation ratio after heading. Notable trends include the consistent lowest nitrogen uptake in the control group and significant increases in nitrogen accumulation with different UI dosage treatments compared to the control. The DFUI4 treatment group shows the highest total nitrogen accumulation in both early and late rice seasons for the years 2024 and 2025.
a ESR, early-season rice; LSR, late-season rice.
b CK, no nitrogen fertilizer; CF, 100% Urea-N; DF, side-deep fertilization reduces nitrogen by 30%; UI, urease inhibitor; DF + UI1, DF with 0.5% UI; DF + UI2, DF with 0.75% UI; DF + UI3, DF with 1.0% UI; DF + UI4, DF with 1.25% UI; DF + UI5, DF with 1.5% UI, respectively.
c TS, tillering stage; HS, Heading stage; FS, Filling stage; MS, Maturity stage.
Data are means ± SE. Different letters indicate significant differences among treatments within the same year at the 5% level (Tukey’s Honestly Significant Difference (HSD) test).
*Significant at the 0.05 probability level. **Significant at the 0.01 probability level. NS, non-significant.
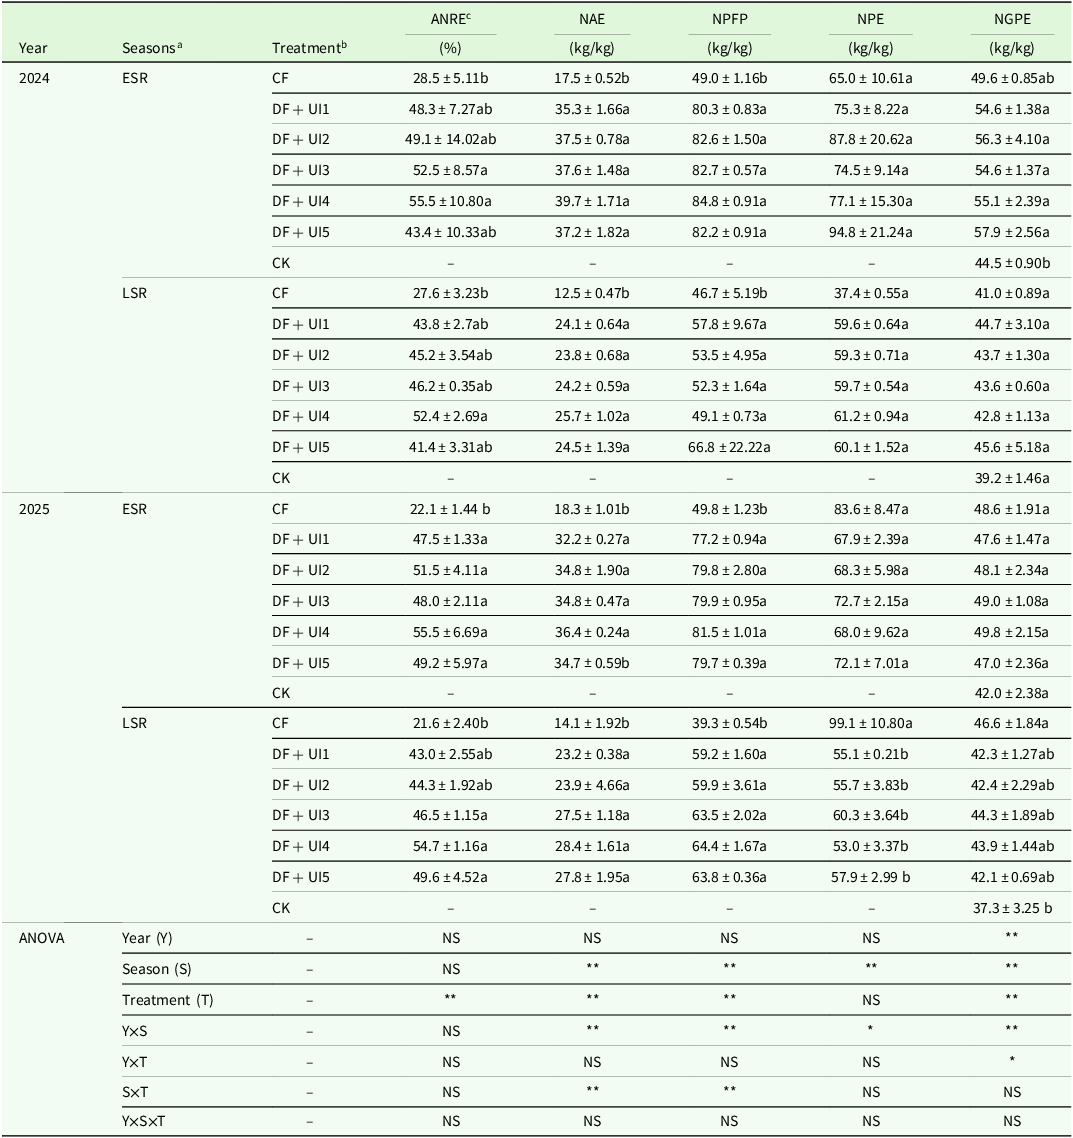
Different treatments had significantly varying effects on the ANRE and NAE (P < 0.01). These effects were not influenced by the year or the interaction between year and treatment (P > 0.05). In 2024, compared with that in CF, the ANRE of ESR and LSR in the DF + UI treatment increased by 19.8–26.9 and 13.8–24.9 percentage points, respectively; the NAE increased by 17.8–22.2% and 11.3–13.2%; the NPFP increased by 31.3–35.8% and 22.2–35.8%, respectively (Table 6). In 2025, compared with that in CF, the ANRE of ESR and LSR in the DF + UI treatment increased by 25.3–33.4 and 21.5–33.1 percentage points, respectively; the NAE increased by 17.3–21.6% and 11.28–13.18%; the NPFP increased by 27.4–31.7% and 20.0–25.2%, respectively (Table 6). The ANRE and NAE under the DF + UI14 treatment were significantly higher than those under the CF treatment (Table 6, P < 0.05), with the ANRE reaching the highest level under the DF + UI4 treatment. With the increase in the dosage of UI, the ANRE of double-cropping rice increased first and then decreased.
Apparent recovery efficiency, nitrogen physiological efficiency and nitrogen agronomy efficiency for the early-and late-rice seasons under different fertilization treatments

Table 6 Long description
The table presents data on apparent recovery efficiency (ANRE), nitrogen physiological efficiency (NAE), nitrogen physiological efficiency (NPFP), nitrogen physiological efficiency (NPE), and nitrogen physiological efficiency (NGPE) for early and late rice seasons under various fertilization treatments across the years 2024 and 2025. The table includes 24 rows and 8 columns, with columns labeled Year, Seasons, Treatment, ANRE (percentage), NAE (kilograms per kilogram), NPFP (kilograms per kilogram), NPE (kilograms per kilogram), and NGPE (kilograms per kilogram). The rows are categorized by year, season, and treatment type, with specific values provided for each combination. Notable trends include significant increases in ANRE and NAE under different treatments compared to the control (CF), with the highest increases observed under the DFUI4 treatment. The data highlights the varying impacts of different fertilization treatments on rice crop efficiency metrics.
a ESR, early-season rice; LSR, late-season rice.
b CK, no nitrogen fertilizer; CF, 100% Urea-N; DF, side-deep fertilization reduces nitrogen by 30%; UI, urease inhibitor; DF + UI1, DF with 0.5% UI; DF + UI2, DF with 0.75% UI; DF + UI3, DF with 1.0% UI; DF + UI4, DF with 1.25% UI; DF + UI5, DF with 1.5% UI, respectively.
c ANRE, apparent recovery efficiency; NAE, nitrogen agronomy efficiency; NPFP, nitrogen partial factor productivity; NPE, nitrogen physiological efficiency; NGPE, nitrogen grain production efficiency.
Data are means ± SE. Different letters indicate significant differences among treatments within the same year at the 5% level (Tukey’s Honestly Significant Difference (HSD) test).
*Significant at the 0.05 probability level. **Significant at the 0.01 probability level. NS, non-significant.
Discussion
NH3 volatilization during the rice growing seasons
The UI application can effectively reduce NH3 volatilization rate, and the cumulative NH3 volatilization loss can be decreased (Soares et al., Reference Soares, Cantarella and Menegale2012). Therefore, UIs are commonly used in production to improve N utilization efficiency. UI addition and the combined application of UIs and nitrification inhibitors can delay the peak period of NH3 volatilization (Byrnes and Freney, Reference Byrnes and Freney1995; Freney et al., Reference Freney, Keerthisinghe, Phongpan, Chaiwanakupt and Harrington1995). The volatilization of NH3 from rice fields is one of the major pathways of N loss (Yang et al., Reference Yang, Li, Ni, Yu, Yang, Wang, Liu, Ye, Tao, Liu and Wu2020a, Reference Yang, Ji, Sheng, Zhang, Feng, Guo and Chen2020b). Field measurements have consistently demonstrated that approximately 80–90% of the cumulative NH3 emissions occur within the first 7 days following fertilizer application (Feng et al., Reference Feng, Sun, Xue, Liu, Gao, Lu and Yang2017; Sun et al., Reference Sun, Zhang, Powlson, Min and Shi2015). Our study reveal the characteristic patterns of NH3 emissions: CF treatment exhibited peak emission level on day 3 after fertilization. However, unlike previous reports, here, two significant changes were observed in the emission dynamics under the DF + UI treatment: the peak emission time was delayed by 2 d; more importantly, the peak intensity was simultaneously reduced (Figure 1). To our knowledge this dual effect – delay and reduction of the peak – is a new discovery. Delayed release can better synchronize the supply of N with the growth of rice roots and the peak period of N absorption, thereby improving the utilization efficiency. Subsequently, the NH3 emission fluxes of both treatments returned to a level close to that of the CK group approximately 3 weeks later. This temporal dynamic showed strong consistency with that of the well-documented NH3 emission profiles from the paddy systems of the Taihu Lake region (Yao et al., Reference Yao, Zhang, Tian, Zhao, Zeng, Zhang, Zhao and Yin2018), confirming the robustness of this emission pattern across different rice growing regions. This may be because UIs themselves do not have effective inhibitory components and need to be converted into their oxide NBPT structure to showcase urease-inhibiting activity (McCarty et al., Reference McCarty, Bremner and Chai1989). In addition, the oxidation process is influenced by various factors such as soil texture, moisture, temperature, microbial activity and inhibitor concentration, among others (Freney et al., Reference Freney, Keerthisinghe, Phongpan, Chaiwanakupt and Harrington1995). In this experimental field, the application of N fertilizer led to a higher cumulative NH3 volatilization loss, and the DF + UI treatment could significantly reduce the N loss caused by NH3 volatilization (P < 0.05, Table 2). These emission ranges are highly consistent with the previous reported values (Sun et al., Reference Sun, A., Feng, Vithanage, Mandal, Shaheen, Rinklebe, Shi and Wang2019; Yang et al., Reference Yang, Li, Ni, Yu, Yang, Wang, Liu, Ye, Tao, Liu and Wu2020a, Reference Yang, Ji, Sheng, Zhang, Feng, Guo and Chen2020b), confirming the repeatability of the NH3 circulation pattern in the rice ecosystem. The volatilization of NH3 mainly occurs during the tillering stage (Figure 2). During this stage, there are three key factors contributing to high emissions: relatively weak root activity, slow N absorption by rice seedlings, high fertilizer application rate (Cao et al., Reference Cao, Tian, Yin and Zhu2013; Sun et al., Reference Sun, A., Feng, Vithanage, Mandal, Shaheen, Rinklebe, Shi and Wang2019) and long periods of high temperature and intense sunlight, which are conducive to NH3 volatilization. Therefore, N fertilizer application during the tillering stage resulted in the highest NH3 loss rate, and UI application effectively reduced NH3 loss. This further proves that DF + UI can significantly reduce NH3 accumulation while reducing fertilizer usage, achieving a 30% reduction in N application and minimizing NH3 volatilization (Table 2).
Effects of UIs on NH3 volatilization in double-cropping rice systems
Ecological and environmental protection is as important as the safety of food crops. The emissions of NH3 and greenhouse gases are regarded as key constraints on agricultural production and environmental protection (Wang et al., Reference Wang, Sha, Zhang, Qin, Xu, Goulding and Liu2023). The non-volatile NH3 – whether from the applied urea or the mineralization of soil organic N – remains in the soil as ammonium ions (NH4 +), serving as a substrate for NH3-oxidizing microorganisms, including NH3-oxidizing bacteria and archaea (Shen et al., Reference Shen, Zhang, Di and He2012). These microorganisms initiate nitrification by oxidizing NH3 to hydroxylamine (NH2OH) and subsequently to nitrite (NO2−). During this process, N2O can be produced as a by-product through various microbial pathways, including inorganic decomposition intermediates and denitrification during anoxic conditions (Daly et al., Reference Daly, Hernandez-Ramirez, Congreves, Clough, Voigt, Harris and Ruser2024). The enzymatic basis of this connection is closely related to our research findings. By inhibiting the activity of urease – the enzyme responsible for hydrolysing urea into ammonium ions – UIs can delay hydrolysis and reduce the peak concentration of ammonium ions in the surface water (Figures 2 and 4). This is mainly because the UIs quickly inhibit the extracellular urease activity that plays a major role in the soil, achieving the initial goal of delaying urea hydrolysis and reducing NH3 volatilization (Gupta et al., Reference Gupta, Yildirim, Andrikopoulos, Wille and Roessner2023). Research has demonstrated that oxidized products of NBPT can effectively suppress soil urease activity while reducing surface water pH (Yao et al., Reference Yao, Zhang, Tian, Zhao, Zeng, Zhang, Zhao and Yin2018). Whether applied individually or in combination with nitrification inhibitors, significantly reduced NH3 volatilization and N2O emissions from paddy fields while simultaneously improving crop yields (Hao et al., Reference Hao, Sun, Zhou, Ma, Wang, Liu, Ji, Kuang and Qiu2023; Yao et al., Reference Yao, Zeng and Song2020). Urea addition may stimulate the mineralization of soil’s own organic N through a ‘triggering effect’, providing more substrates for nitrification and denitrification, thereby generating additional N2O (Daly et al., Reference Daly, Hernandez-Ramirez, Congreves, Clough, Voigt, Harris and Ruser2024). UIs, by slowing down urea hydrolysis, reduce NH3 volatilization and may affect the subsequent N2O production by altering the supply time and intensity of NH4 +.
This mechanism operates through UIs slowing urea hydrolysis in soil, thereby mitigating the rapid rise in NH3 concentration and pH around urea granules, ultimately reducing peak NH3 flux (Ni et al., Reference Ni, Pacholski and Kage2014). Similarly, Lan et al. (Reference Lan, He, Wang, Deng, Zhou, Luo, Chen, Zeng, Yuan, Zeng and Xiao2022) observed a 50% NH3 emission reduction with NBPT-amended urea; these findings show remarkable consistency with the current results (Table 2). Further, Zhang et al. (Reference Zhang, Wang and Luo2023) observed a dose-dependent decrease in NH3 emissions in rice–rapeseed rotation systems with increasing NBPT application. NBPT application reduced NH3 losses by 32.7–50.2% and 39.9–65.2% in ESR and LSR, respectively, compared with those under CF (Table 2). These outcomes are mechanistically explained by the dual action of NBPT: significant suppression of soil urease activity (P < 0.05, Figure 4) and delay in urea hydrolysis, collectively establishing NBPT as an effective mitigation strategy. The pronounced reduction during the first week post-fertilization is attributed to the suppression of urease activity by UIs, which delays amide N hydrolysis and consequently lowers NH4 + and NH3 concentrations in the soil solution, thereby mitigating NH3 volatilization (Table 2) – consistent with a previous report (Ren et al., Reference Ren, Huang, Liu, Zhao and Zhang2023). The synergistic emission reduction effect of DF and UI was quantitatively studied. The reduction amplitude of NH3 (18.7–37.0%) achieved by the combined application of DF and UI was higher than that reported in previous studies on the sole DF (18.6–26.9%; Zhong et al., Reference Zhong, Zhou, Fei, Huang, Wang, Kang and Peng2021) and optimized fertilization management (organic–inorganic compound fertilizer, DF and combined application of high-efficiency fertilizer), which achieved 7–40% NH3 reduction (Liu et al., Reference Liu, Fu, Wang, Zhang, Cao, Tian and Liu2025) and exceeded the 23.4% achieved by the sole application of UI (Ren et al., Reference Ren, Huang, Liu, Zhao and Zhang2023) and 16.2% NH3 accumulation loss reduction in rice fields, compared with conventional urea application (Silva et al., Reference Silva, Sequeira, Sermarini and Otto2017). This indicates that a complementary mechanism exists between the two – DF reduces the contact between urea and surface urease through physical barriers, while UI further inhibits urease activity at the contact site. Accordingly, a multi-objective collaborative optimization framework has been proposed, clearly defining the optimal UI dosage (1.25%) for achieving a balance among NH3 reduction, N absorption and yield formation, providing an operational recommended threshold for practical production.
Effects of UI on ANRE, grain yield and yield-scaled NH3 volatilization
As a fundamental mineral nutrient, N plays crucial roles in crop growth and development. N deficiency adversely affects multiple agricultural parameters, including plant growth rates, yield potential and key physiological processes. Research has demonstrated that UIs can effectively improve crop yields when co-applied with N fertilizers, with documented success in wheat (Zaman and Nguyen, Reference Zaman and Nguyen2012), maize (Sanz-Cobena et al., Reference Sanz-Cobena, Sánchez-Martín, García-Torres and Vallejo2012) and other staple crops. Nevertheless, the yield-enhancing effects of UIs show considerable variability across studies, with some reporting negligible improvements (Henning et al., Reference Henning, Branham and Mulvaney2013; Suter et al., Reference Suter, Sultana, Turner, Davies, Walker and Chen2013). Linquist et al. (Reference Linquist, Liu, van Kessel and van Groenigen2013) quantified a modest but statistically significant 6% grain yield increase in rice production using UI-treated urea versus conventional urea. These investigations consistently revealed two major agronomic advantages: substantial mitigation of NH3 volatilization losses, and simultaneous enhancement of both crop productivity and ANRE – as evidenced by comprehensive meta-analyses (Rajkovich et al., Reference Rajkovich, Osmond, Weisz, Crozier, Israel and Austin2017). This dual-benefit pattern establishes NBPT application as a promising strategy for sustainable N management in modern agriculture. The application of UIs and nitrification inhibitors modifies N transformation processes by suppressing soil urease activity and NH3-oxidizing microorganisms, thereby enhancing NUE (Hong et al., Reference Hong, Li, Qi, Chaowen, Haitao, Fuxiang and Shuqun2023). Field experiments have demonstrated that compared with conventional urea application, inhibitor-treated urea (with UI concentration ∼ 0.14‰) significantly improves both yield and N uptake in major crops including maize, rice and oilseed rape (Hong et al., Reference Hong, Li, Qi, Chaowen, Haitao, Fuxiang and Shuqun2023; Li et al., Reference Li, Li, Yu, Mao and Ma2021; Ni et al., Reference Ni, Pacholski and Kage2014). Particularly in double-cropped rice systems, UI application showed remarkable effects on N utilization. Compared with the traditional fertilization method, the DF + UI treatment significantly increased the ANRE and NAE of ESR and LSR – DF + UI4 treatment had a significantly higher ANRE than did the CF treatment – (Table 6). The inhibitor slows down the hydrolysis of urea to ammonium (NH4 +) by inhibiting urease activity. This delays NH4 + accumulation in the soil solution, thereby reducing the risk of NH3 volatilization and other N losses. Consequently, more fertilizer N remains available for crop uptake, improving NUE and reducing environmental pollution (Chakraborty et al., Reference Chakraborty, Purakayastha, Pendall, Dey, Jain and Kumar2023). These findings align with those of earlier studies, confirming the consistent performance of inhibitor technologies across different rice cultivation systems (Yang et al., Reference Yang, Li, Ni, Yu, Yang, Wang, Liu, Ye, Tao, Liu and Wu2020a; Yao et al., Reference Yao, Zhang, Tian, Zhao, Zeng, Zhang, Zhao and Yin2018). UIs and nitrification inhibitors, when used as N fertilizer enhancers, can effectively increase crop yields (Abalos et al., Reference Abalos, Jeffery, Sanz-Cobena, Guardia and Vallejo2014). With increasing application rates of these inhibitors, soil urease activity decreases correspondingly. Consequently, optimized N management drives yield by enhancing photosynthate production and accumulation, which manifests in increased panicle number and grains per panicle. This effect is mediated through an improved population structure – featuring a higher productive tiller rate alongside stable panicle number – and a greater spikelet number per unit area from larger, more fertile panicles (Hu et al., Reference Hu, Zhu, Lu, Jiang, Gao, Zhang and Wei2023). Crop yield is ultimately governed by direct component traits such as tiller number, fertile spikelets, grains per spike and grain weight (Chen et al., Reference Chen, Sun, Li, Wang, Shi, Zhang and Jing2020), with spikelets per m2 and per panicle consistently identified as key determinants (Xu et al., Reference Xu, Zhan, Yu, Nie, Huang, Cui and Peng2018). DF + UI treatments furnished adequate N in the later growth stages and promoted grain filling in double-cropping rice (Table 5). Therefore, UI application greatly increased the grain yield of both ESR and LSR because of its positive effects on the numbers of spikelets per panicle and panicles/m2 (Table 4). Specifically, soil urease activity decreased progressively with increasing inhibitor concentrations, with a particularly pronounced inhibitory effect observed when UI application exceeded 1% of the N fertilizer input. Liu et al. (Reference Liu, Fan, Zhang, Chen, Li and Cao2015) highlighted that although UIs reduce NH3 volatilization, they do not significantly increase grain output. Owing to the high initial soil mineral N content, N was not the sole yield-limiting factor; thus, UI-induced preservation of N did not necessarily translate into higher grain yields (Wang et al., Reference Wang, Sha, Zhang, Qin, Xu, Goulding and Liu2023). Although the combined application of urea and NBPT can significantly reduce NH3 volatilization, farmers’ adoption decisions mainly depend on the impact of this measure on productivity. The study determined the optimal application threshold for maximizing agronomic benefits. Although a higher proportion of urea enhancer application (relative to N fertilizer at 1.5%) can minimize NH3 volatilization losses, the maximum rice yield occurs at a slightly lower 1.25% addition rate (Figure 5). This difference is mainly due to the uptake of N. The total N absorption of DF + UI4 at the maturity stage is higher, and these results are consistent with the established research conclusion that bird enzyme inhibitor addition can increase rice yield by approximately 6%, compared with conventional urea application (Linquist et al., Reference Linquist, Liu, van Kessel and van Groenigen2013). This is mainly because the UI can inhibit the activity of urease in the soil, thereby slowing down the hydrolysis rate, thus reducing the concentration of inorganic N in the soil solution and decreasing NH3 conversion (Figure 4).
One of the significant new findings of this study is that under the double-cropping rice cultivation conditions, the rice yield showed a non-linear response to the increase in the dosage of UIs. As the dosage of UIs increased (from UI1 to UI5), the NH3 emission gradually decreased, but the yield and N fertilizer utilization reached their peak at UI4 and slightly declined at UI5. This indicates that excessive UIs may cause the release of N to exceed the peak demand period of the crops – this finding challenges the simplistic assumption that ‘the higher the inhibitor dosage, the better the effect’, providing a scientific basis for precise application. To our knowledge, this is the first time that in the double-cropping rice cultivation system, the optimal curve of UI dosage and reduced N input has been reported for adopting the double-cropping mode. This study was conducted at a single site with different varieties used in early and late seasons, which limits the generalizability of the findings and confounds varietal effects with seasonal effects. Future research should validate these results across diverse agroecological zones and include multiple varieties per season to disentangle variety-by-season interactions. Comprehensive assessments of greenhouse gas emissions and economic returns are also needed to evaluate the overall sustainability of this practice.
Conclusion
In this study, we found that reducing N fertilizer input by 30% and combining DF with a UI delayed the peak of NH3 volatilization by two days while simultaneously reducing its intensity. In addition, a non-linear, dose-dependent response of rice yield to increasing UI application rates was observed in the double-cropping rice system. This concurrent delay and reduction in the NH3 volatilization peak improved the temporal synchronization between N supply and crop demand, thereby enhancing NUE and grain yield. From a practical perspective, the DF + UI4 treatment (70% conventional N rate + 1.25% NBPT) offers a readily adoptable strategy for farmers in double-cropping rice systems. This approach is consistent with the national goal of reducing fertilizer input while still maintaining or increasing crop yields, thus balancing the two important aspects of environmental sustainability and food security.
Author contributions
Xuemei Zhong: Conceptualization, Methodology, Writing – original draft, Writing – review & editing, Funding acquisition, Supervision. Xueyi Zhong: Methodology, Data curation, Investigation, Writing – review & editing. Xuan Zhou: Conceptualization, Writing – review & editing. LingKun Xie: Writing - review & editing. Wei Yang: Writing – review & editing. Tao Zi: Investigation, Data curation, Writing – original draft, Supervision, Project administration.
Funding statement
This work was supported by the Scientific Research Fund of Hunan Provincial Education Department (grant number 23B1004); the Key Project Fund of Hunan Biological Electromechanical Vocational Technical College (grant number 24YZD02); the Hunan Provincial Natural Science Foundation General Project (grant number 2023JJ30353); the Director Fund of the Hunan Institute of Soil and Fertilizer (grant number 2024TFS101); and the Project Supported by Scientific Research Fund of Hunan Provincial Education Department (grant number 24B1034).
Competing interests
The authors declare there are no conflicts of interest.
Ethical standards
Not applicable.