The evidence for gender differences in language ability is unclear in adults. Hyde and Linn (Reference Hyde and Linn1988) performed a meta-analysis of over 165 studies conducted in the USA between 1973 and 1986 with participants of varying age ranges. Gender differences found in a wide range of tasks (e.g., reading comprehension, speech production, essay writing, analogies, etc.), were small in size. In 66% of studies, no significant differences were found between males and females, and only 26% of studies analyzed showed any linguistic advantage for females.
However, evidence seems to favor women with regards to verbal fluency, as the study by Weiss, Kemmler, Deisenhammer, Fleischhacker, and Delazer (Reference Weiss, Kemmler, Deisenhammer, Fleischhacker and Delazer2003) demonstrates. This study included a phonological fluency task in which participants had one minute to produce as many words as possible starting with the letters A, B, and S, as well as a semantic fluency task in which they had to produce, in the same amount of time, as many words in the lexical sets of supermarket, animals, and vegetables as they could. They found that females outperformed males in both. Barbarotto, Laiacona, and Capitani (Reference Barbarotto, Laiacona and Capitani2008) found an advantage of boys between 3 to 5 years old to name tools and vehicles based on its high familiarity. However, large-scale studies, such as that of Tombaugha, Kozakb, and Reesc (Reference Tombaugha, Kozakb and Reesc1999), with 1,300 adult participants, also applying two verbal fluency tasks, found differences in education level (21% of variance) and age (11% of variance), while gender only accounted for 1% of variance.
Linguistic differences between genders seem to be more pronounced early in development and may well disappear when children reach a certain age. Girls at the age of three surpass boys in verbal fluency, though this difference decreases and disappears at 10 or 11 years of age, as Coates (Reference Coates1993) concluded from a literature review. Two studies of linguistic development investigating children’s language abilities between one and two years of age are that of Fenson et al. (Reference Fenson, Dale, Reznick, Bates, Thal, Pethick and Stiles1994) and Feldman et al. (Reference Feldman, Dollaghan, Campbell, Kurs-Lasky, Janosky and Paradise2000). Both used the MacArthur Communicative Development Inventory (MCDI) as a parent-generated report about the linguistic abilities of their children. The differences favored girls; however, they were still very small, accounting for 1% or 2% of variance. Bouchard, Trudeau, Sutton, Boudreault, and Deneault (Reference Bouchard, Trudeau, Sutton, Boudreault and Deneault2009) also using the MCDI show that girls produced more words than boys: girls’ utterances contained a greater number of grammatical forms and were more syntactically complex. Moreover, a study of the first 50 and 100 words produced showed significant differences in favor of earlier achievement by girls (23 and 25 months) than for boys (26 and 27 months). Bornstein, Hahn, and Haynes (Reference Bornstein, Hahn and Haynes2004) carried out a longitudinal study with boys and girls that were one-year-old at the beginning of the study and six years of age by the end. They showed that girls outperformed boys in multiple measurements of language, but these differences lessened with age. Also, linguistic differences in children of ages 9 to 15 were measured in a functional resonance experiment across linguistic tasks (Burman, Bitan, & Booth, Reference Burman, Bitan and Booth2008). The results showed greater bilateral activation in the inferior frontal cortex and superior temporal gyrus and left fusiform gyrus, for girls than for boys. These differences tended to disappear with age. In contrast, Kramer, Delis, and Daniel (Reference Kramer, Delis and Daniel1988) showed that in all the groups under study (i.e., from age 5 to 16 years old), girls outperformed boys in semantic categorization tasks, while boys were better at the serial categorization of elements.
The advantage of girls seems to be centered on word production. Eriksson et al. (Reference Eriksson, Marschik, Tulviste, Almgren, Perez Pereira, Wehberg and Gallego2012) explored language skills in a sample of more than 13,000 children of 10 non-English languages, Spanish included (296 girls and 297 boys), aged from 0.8 to 2.6 years old. The results showed girls have an advantage in the number of words produced as well as in the number of word combinations. Similar results were found in large-scale studies on English- speaking children (Bornstein et al., Reference Bornstein, Hahn and Haynes2004; Fenson et al., Reference Fenson, Marchman, Thal, Dale, Reznick and Bates2007; Galsworthy, Dionne, Dale & Plomin, Reference Galsworthy, Dionne, Dale and Plomin2000).
The advantage girls have in producing words is supported by the works of Ullman (Hartshorne and Ullman, Reference Hartshorne and Ullman2006; Ullman, Reference Ullman2001, Reference Ullman2004; Ullman et al. Reference Ullman, Estabrooke, Steinhauer, Brovetto, Pancheva and Ozawa2002; Ullman, Miranda and Travers, Reference Ullman, Miranda, Travers, Becker, Berkley, Geary, Hampson, Herman and Young2008) that emphasize women’s greater ability in using declarative memory in contrast to men’s use of procedural memory. Declarative memory is related to linguistic tasks that involve explicit learning and information retrieval. Therefore, declarative memory is linked to a direct storing and recovering of words from the long-term memory. In contrast, procedural memory requires the use of rules of composition and decomposition of words, such as the combinatory use of morphemes to produce words. Kaushanskaya and Yoo (Reference Kaushanskaya and Yoo2011) tested, in part, this hypothesis, observing the learning of phonologically familiar or unfamiliar novel words (using native or non native phonemes, respectively) among adults, with women outperforming men when learning phonologically familiar novel words but not when learning unfamiliar ones. In addition, 5–7 year-old girls learn novel words better than boys having more familiar referents and phonemes (Kaushanskaya, Gross, & Buac, Reference Kaushanskaya, Gross and Buac2013). The works of Kaushanskaya and Yoo (Reference Kaushanskaya and Yoo2011) and Kaushanskaya et al. (Reference Kaushanskaya, Gross and Buac2013) support this greater capacity of girls’ declarative memory to recover stored information from the long term-memory, though they did not test girls’ and boys’ ability to use procedural memory: the use of rules to produce words.
Procedural memory has been tested through the morphological processing of words. Within the field of morphology, the comprehension and production of the past tense in English has been particularly productive. When the formation of the past tense follows a given rule (e.g., in English adding ‘-ed’ to the root of the verb as in; ‘work-ed’) the verb is considered regular. However, when the application of the rule generates an incorrect form, often called over-regularization (e.g., ‘goed’), the verb is thought to be irregular. Over-regularizations are frequently produced by children during language development (see the seminal work of Marcus et al., Reference Marcus, Pinker, Ullman, Hollander, Rosen, Xu and Clahsen1992 and the review by Maslen, Theakston, Lieven, & Tomasello, Reference Maslen, Theakston, Lieven and Tomasello2004), as well as in anomic patients with difficulties in accessing their lexical memory but with a preserved ability to apply learned rules (Cuetos-Vega, Domínguez, Baauw, & Berthier, Reference Cuetos-Vega, Domínguez, Baauw and Berthier2007). This account of the over-regularization phenomenon fits well with the predictions derived from models of morphological double route (Schreuder & Baayen, Reference Schreuder and Baayen1997): An ‘indirect’ or rule based route for regular forms (work-worked) in which the grammatical rule is applied by default and a ‘direct’ route to the lexicon for the irregular morphological forms which cannot be derived by rules (go-went) (blocking the rule application, Marcus et al. Reference Marcus, Pinker, Ullman, Hollander, Rosen, Xu and Clahsen1992).
The declarative/procedural model for language is a neurocognitive model based on the notion of a double route to explain morphological processing (Ullman, Reference Ullman2001). The model proposes two distinct routes at functional and anatomical level. Hence, according to the model, word memory, our metaphoric lexicon, is embedded in the declarative memory system, while the application of grammatical rules to compose morphologically complex words depends on procedural memory. In an attempt to test this model, Hartshorne and Ullman (Reference Hartshorne and Ullman2006) argued that the declarative memory system might be somehow enhanced in females. This boosted system benefits the memory and retrieval of words and as such females will be better than males at producing the past tense of irregular verbs in English. Contrary to their predictions, the results showed that the opposite was the case: Females produced more over-regularizations than males. The authors noticed, however, that the over-regularization in females, and not males, occurred predominantly for those verbs with many regular phonological neighbors. (i.e., words that sound similar, such as ‘watched’, ‘hatched’, ‘matched’ and ‘patched’). In these cases, verbs such as ‘hold’ were over-regularized producing errors such as ‘holded’. Hartshorne and Ullman (Reference Hartshorne and Ullman2006) argued that these gender differences in number and type of over-regularization errors were due to different routes for lexical access. Thus, female over-regularization was explained as the result of associations in lexical memory, while male over-regularization was a consequence of the application of rules by the procedural memory system. Although a number of other studies have also reported that females outperform males in verbal memory tasks (Halpern & LaMay, Reference Halpern and LaMay2000; Kimura & Clarke, Reference Kimura and Clarke2002), Kidd and Lum (Reference Kidd and Lum2008) using experimental data failed to replicate Hartshorme and Ullman´s (Reference Hartshorne and Ullman2006) results.
Spanish is a morphologically complex language with an abundance of regular and irregular verbs. Some works have studied the acquisition of regular and irregular verbs in Spanish (Clashen, Aveledo & Roca, Reference Clahsen, Aveledo and Roca2002; López-Ornat, Fernández, Gallo, & Mariscal,, Reference López-Ornat, Fernández, Gallo and Mariscal1994) in the framework of the dual route model referred to above. Taking as a starting point the work of Marcus et al. (Reference Marcus, Pinker, Ullman, Hollander, Rosen, Xu and Clahsen1992), Aveledo (Reference Aveledo2006) has demonstrated that the over-regularization rate was around 3% for longitudinal samples and 13% for a transversal sample. More interestingly, the number of over-regularizations was higher than the number of errors for regular verbs, which supports an extended use of procedural memory. Moreover, over-regularization commences around 2 years old and coincides with a massive use of verb composition rules (see Plunkett & Marchman, Reference Plunkett and Marchman1993), for a different connectionist model of U-shape learning of irregular tense in English.
This study aims to investigate the dual route model of morphology in children through an elicitation task requiring the production of regular and irregular verbs in Spanish. This task allows regularity and frequency to be manipulated, both very important aspects in this area, but participants need to have already reached some level of linguistic competence. This is the reason why 5 and 7–year-olds were chosen as participants.
Our first aim is to test whether or not the predictions made based on the declarative/procedural model will be confirmed in two groups of Spanish children. It is predicted that at the participants’ age, the ability to apply morphological inflections to verbs will have developed. Nevertheless, younger children will have more reduced representations of words in their declarative memory, thus, the number of regularizations for irregular forms will be greater than in older children. On the other hand, the impact of frequency could be higher in older children’s responses.
Secondly, gender differences could affect results. Taking into account that girls’ verb production could rely on declarative memory, verbs should be accessed by a direct route to the long-term memory to recover the phonological representation of these verbal forms. This procedure entails the production of fewer errors with irregular verbs for girls than for boys. The prediction for boys would also depend on the predominant memory use. Assuming that boys are better at using rules (procedural memory), assembling the verb stem with the tense suffix, and also assuming that they could apply this procedure in an extensive way, they would be expected to make a greater number of over-regularization errors, in particular, for low frequency irregular verbs. Finally, the effect of frequency would be greater for girls, given their more extended use of declarative memory (modulated by familiarity). As far as we know, there has been no research in testing differences between Spanish regular and irregular verbs using an elicitation task to observe gender and developmental differences.
Method
Participants
This study was carried out with a group of 60 children (30 girls and 30 boys). Half of them were in preschool (i.e., 5 years old) while the other half were in 1st grade of Elementary School (i.e., 7 years old). Participants come from three different schools from the metropolitan area of San Cristóbal de la Laguna, Tenerife, in the Canary Islands, with a similar socio-demographic level: Urban middle class. They speak the Spanish dialect of this geographical area, which includes some phonological and lexico-semantic variations of normative Spanish. All the children followed a typical development, and none of them suffered from reading or learning difficulties, as reported by their teachers.
Materials and Design
A factorial design was used with two between-participant variables: School year-preschool and 1st grade and gender and two within-participant variables: Regularity and frequency.
Experimental stimuli comprised 60 verbs embedded in 60 sentences (see appendix). Half the stimuli were high frequency and half low frequency. Verbs were matched depending on number of neighbors across conditions and on frequency within conditions (high or low frequency), see Table 1. None of the t-test comparisons across the four conditions were significant). Frequency measures were taken from Alameda and Cuetos (Reference Alameda and Cuetos1995).
Mean Frequency (and Standard Deviation) of Verbs in Each Experimental Condition

Sentences of similar length were prepared. In addition, all sentences followed the same grammatical structure and had a main and subordinate clause. The present tense form of the verb was introduced in the main clause. This was followed by a subordinate clause that required the past tense of the same verb. All the sentences had the same grammatical and format structure (e.g., “Escribo mi nombre cada día, ayer, como cada día, yo; respuesta: escribí mi nombre.” [“I write my name every day, yesterday, like every day, I; response: wrote my name”.])
Procedure
Participants were given an elicitation task. Sentences were read aloud to the child with a silent gap corresponding to the verb the child was asked to produce: The child was asked to provide the correct verb for the subordinate clause. Sentences were administered in four fixed random orders with three practice sentences given to the children before the first experimental sentence was presented. During the three practice sentences, the researcher ensured that the children understood the procedure and produced adequate responses otherwise practice items were repeated. Any response differing from the first person of the past tense was considered erroneous.
Children were tested individually in a quiet room with a comfortable atmosphere by researchers. Parents, teachers and children had been previously informed of the procedure and provided consent.
Results
The results of statistical analyses will be presented in three main sections. First, a general analysis, including both age groups is presented. Second, two separate analyses are presented, one for the 5-year-old group and the other for 7 year-olds one. We also conducted a qualitative analysis, categorizing error types that may add relevant information to the quantitative analyses.
General analyses
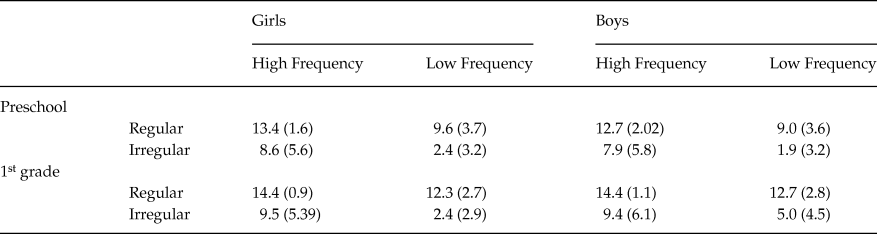
Table 2 shows the mean correct responses for categories taking into account the total number of 15 items.
Mean Correct Responses (and Standard Deviations) for Each Experimental Condition

A 2 x 2 x 2 x 2 ANOVA was carried out with education level (i.e., school year) and gender as between-participant variables and regularity and frequency as within-participant ones. The effect of regularity for participant led to more correct answers for regular than irregular verbs, F 1(1, 56) = 941.85, p <.001, η2 = .94, 1 – β = 1.00; F 2(1, 56) = 47.95, p < .001, η2 = .461, 1 – β = 1.00. The main effect of frequency was also significant, F 1(1,56) = 499.66, p < .001, η2 = .899, 1 – β = 1.00; F 2(1, 56) = 22.06, p < .001, η2 = .283, 1 – β = .996, with greater accuracy for high frequency verbs. In addition, children in 1st grade produced more correct responses than those from preschool level, F 1(1, 56) = 19.60, p < .001, η2 = .259, 1 – β = .992; F 2(1, 56) = 75.99, p < .001, η2 = .576, 1 – β = 1.00. The gender effect was not significant. However, interaction between school year and regularity was significant, F 1(1, 56) = 4.79, p < .05, η2 = .079, 1 – β = .576; F 2(1, 56) = 4.79, p < .05, η2 = .079, 1 – β = .576, showing greater difference between regular and irregular verbs in 1st grade than in preschool (see Figure 1).
School Year by Regularity Interaction. The bars show the mean correct responses by condition.

Interaction between school year and frequency was also significant showing that the influence of frequency was greater in preschool than in 1st grade, F 1(1, 56) = 7.71, p = .007, η2 = .121, 1 – β = .779; F 2(1, 56) = 6.69, p = .012, η2 = .107, 1 – β = .720, see Figure 2.
School Year by Frequency Interaction. The bars show the mean correct responses by condition.

Although the gender effect was not significant, gender did interact significantly with frequency, with a greater frequency effect in girls than boys, F 1(1, 56) = 5.13, p = .027, η2 = .084, 1 – β = .605; F 2(1, 56) = 6.413, p = .014, η2 = .263, 1 – β = .992; see Figure 3.
Gender by Frequency Interaction. The bars show the mean correct responses by condition.

The significant interaction between regularity and frequency showed that the frequency effect was more substantial for irregular than for regular verbs, F 1(1, 56) = 65.13, p < .001, η2 = .538, 1 – β = 1.00, and non-significant for participants, F 2 = 2,76, p = .1; see Figure 4.
Regularity by Frequency Interaction. The bars show the mean correct response by condition.

The interaction between school year and gender was significant only in the analysis by items, F 2(1, 56) = 19.96, p < .001, η2 = .263, 1 – β = .992, (F 1 = 2, 81, p = .09), indicating that girls were more efficient than boys in preschool while boys were more accurate in 1st grade.
Additionally, a number of three-way interactions were significant, such as frequency by school year and gender, F 1(1, 56) = 3.07, p = .085, η2 = .052, 1 – β = .406; F 2(1, 56) = 4.87, p = .031, η2 = .080, 1 – β = .583, and regularity by frequency and school year, F 1(1, 56) = 3.85, p = .064. η2 = .538 1 – β = .488; F 2(1, 56) = 3.20, p = .079, η2 = .054, 1 – β = .421. As these interactions involved school year, data were also analyzed separately for each school year.
Analysis of preschool children’s results
Results from preschool showed a significant effect for regularity, F 1(1, 28) = 310.11, p < .001, η2 = .917, 1 – β = 1.00; F 2(1, 56) = 38.17, p < .001, η2 = 0.405, 1 – β = 1.00, with greater accuracy for regular than irregular verbs; a significant effect of frequency, F 1(1, 28) = 315.62, p < .001, η2 = 0.919, 1 – β = 1.00; F 2(1, 56) = 25.74, p < .001, η2 = .315, 1 – β = .999, with greater accuracy for high rather than low frequency verbs and a gender effect that was only significant for items F 2(1, 56) = 6.09, p = .011, η2 = .110, 1 – β = .733, with more accurate responses observed in girls than boys. Moreover, the interaction between regularity and frequency was significant, although only for participant analysis, F 1(1, 28) = 19.17, p < .001, η2 = .406, 1 – β = .988, showing greater frequency effects in the production of irregular verbs.
Analysis of 1st grade children’s results
First grade data showed significant effects for regularity, F 1(1, 28) = 782.94, p < .001, η2 = .965, 1 – β = 1.00; F 2 (1, 56) = 54.04, p < .001, η2 = .491, 1 – β = 1.00, with more accurate responses for regular than irregular verbs. The main effect of frequency, F 1(1, 28) = 191.69, p < .001, η2 = .873, 1 – β = 1.00; F 2(1, 56) = 16.61, p < .001, η2 = .229, 1 – β = .980) showed greater accuracy for high frequency verbs and a main gender effect, although this was only observed in analysis by items, F 2(1, 56) = 11.10, p < .01, η2 = .165, 1 – β = .906, with fewer errors observed in boys. The interaction of gender and regularity was significant F 1(1, 28) = 4.41, p < .05, η2 = .136 1 – β = .527; F 2(1, 56) = 5.26, p < .05, η2 = .086, 1 – β = .616, indicating that regularity had a greater effect on girls’ performance than boys. Another significant interaction was gender by frequency, F 1(1, 28) = 8.07, p < .01, η2 = .224, 1 – β = .783; F 2(1, 56) = 12.10, p < .001, η2 = .178, 1 – β = .928, showing a stronger effect of frequency on girls than boys. The interaction between frequency and regularity was also significant demonstrating larger frequency differences in irregular than regular verbs, F 1(1,28) = 49.00, p < .01, η2 = .636, 1 – β = 1.00; F 2(1, 56) = 4.19, p < .05, η2 = .070, 1 – β = .521.
Qualitative analysis of errors
Errors produced by children were classified into eight categories: Tense change, number or person of the verb; repetitions, omissions, regularizations of the present tense (e.g., “manteguí” [I keeped]), regularizations of the infinitive (e.g., “mantení” [I keeped]), phonological errors, semantic errors and others.
Tense change, number or person, involves the incorrect application of a rule on the base form of the verb (e.g., applying the past tense ending (e.g., cant-é, the Spanish past tense of the verb to sing) instead of the future form ending (e.g., canta-ré, the Spanish future tense of the verb to sing). These errors differ from over-regularizations, since it involves the application of a correct rule.
1. Repetition errors and omissions refer to the absence of a response or repetition of the verb as presented to the child. One possible reason for these errors is the lack of representation of the correct tense in the child’s lexicon (see the evaluation of aphasic patients with damage in the lexical phonological output, for example in Martin, Reference Martin, Papathanasiou and Coppens2016).
2. Regularization of the present tense refers to the addition of the regular past tense morpheme to the stem of the present tense of an irregular verb (e.g., saying “mantenguí” [I keeped]) instead of “mantuve” [I kept]) from “mantengo” [I keep]).
3. Regularization of the infinitive involves the addition of the regular paste tense morpheme to the infinitive form of the verb (e.g., saying “mantení” [I keeped]) instead of “mantuve” [I kept]) from “mantener” [To keep]). These errors could indicate a more abstract knowledge and better representation of verb rules than regularization-of-the-present-tense errors where the child uses a literal form of the verb, which has just been heard, needing only to attach the past suffix.
4. Phonological errors refer to the production of a verb phonologically similar to the target verb (e.g., saying “puscó”, from “buscó” [he searched]) instead of “puso” [he put]). It is believed these errors arise from the activation of a phonologically similar word in the lexicon (Martin, Reference Martin, Papathanasiou and Coppens2016)
5. Semantic errors refer to the production of a verb semantically similar to the target verb (e.g., saying “bebí” [I drank], instead of “comí” [I ate]).
6. Others refer to all other errors.
This taxonomy attributes a type of error to a specific level of linguistic processing but reality is far from being that simple. For example, the phonological errors are attributed to a lexical level, however, these errors could be also attributed to a prelexical-syllabic level or to a peripheral articulatory level. Nevertheless, the exploration of these and other kinds of errors can be very useful to reinforce the results of the quantitative analyses. In this way, if frequency produces significant effects on a particular age or gender group and the phonological errors increase in the same group, this combination could be taken as support of direct lexical access to the verbal forms being produced.
The most important difference between younger and older children was apparent in the repetition and omission errors as more errors were produced by preschool children (see Figure 5). This is probably due to a lower number of verbal representations stored in their lexicon. In addition, the number of repetitions by 5 year-old children was higher for boys than girls. Thus, the latter possibly produce and manage broader vocabulary. Furthermore, the number of errors of time, number and person was also higher for preschool children indicating that older students know and use rules of verbal composition more effectively.
Number of Errors by Category in the Qualitative Analysis. The bars represent the errors for pre-school boys, preschool girls, 1st grade boys and 1st grade girls from left to right in each category.

Discussion
The results of this study show the main effects of regularity and verb frequency with greater accuracy demonstrated for those verbs that obey Spanish morphological rules of the past tense, as well as those high in frequency. Frequency and regularity also showed a significant interaction with a greater frequency effect observed in the production of irregular verbs. These results have been widely documented and support dual accounts of morphosyntactic development (Balota & Ferraro, Reference Balota and Ferraro1993; Ellis & Schmidt, Reference Ellis and Schmidt1998; Seidenberg & Bruck, Reference Seidenberg and Bruck1990).
Developmental effects
The effect of educational level was also significant with the oldest children (i.e., 1st grade) generating the greatest number of correct responses. The interaction of level with frequency shows larger differences in frequency at preschool: An effect that could indicate younger children rely more on lexical knowledge than the application of rules to produce verbs. Furthermore, the greater effect of frequency in girls supports more effective use of direct access to declarative memory, as Ullman defends (Hartshorne and Ullman, Reference Hartshorne and Ullman2006; Ullman et al., Reference Ullman, Miranda, Travers, Becker, Berkley, Geary, Hampson, Herman and Young2008), although this effect should be qualified later by the more competent use of regular verbs among girls.
The idea of a more extensive and superior use of morphological rules by the oldest children was supported by the interaction found between regularity and educational level. This interaction showed that, although the oldest children generated more accurate regular and irregular verbal responses the improvement was greater for regular verbs (see Figure 1). Interestingly, the number of over-regularizations of the infinitive was higher for 7 year-olds, rather than for 5 year-olds, which was initially a surprising result. However, see Marcus et al. (Reference Marcus, Pinker, Ullman, Hollander, Rosen, Xu and Clahsen1992) and Aveledo (Reference Aveledo2006). They consider the increase in over-regularization with age, as evidence of better competence in the use of morphological rules. The improved accuracy exhibited by oldest children in the production of regular verbs supports this interpretation. In addition, the type of over-regularization, with more infinitive over-regularization, could show a more abstract morphological knowledge of rules, as can be seen with a greater change in the verbal form they had just heard in the sentence (mantení comes from the infinitive mantener [to maintain], whereas mantenguí comes from the present mantengo [I maintain], the word presented just before in the sentence).
Further support for the evolution of the morphological system in oldest children was also found in the qualitative analyses. Firstly, the small number of errors in which children changed the tense, number and person of the verb demonstrates this. Secondly, the interaction between verb frequency and education level showed a stronger influence on the lexical procedure to access verbs (less frequent forms receive more errors, see Figure 2) in the youngest children, which causes them to commit more omissions and repetitions (see Figure 5), indicating, also, a reduced lexical knowledge. Children at 1st grade, however, have internalized morphological rules for verbal production more effectively, as may be inferred from the generation of more regularization errors.
Gender differences
As in Hartshorne and Ullman’s (Reference Hartshorne and Ullman2006) study, girls were not better at producing irregular verb past tenses. In fact, the oldest girls were particularly inaccurate with regards to low frequency irregular verbs (see Table 2), while the entire group of girls (preschool and 1st grade) showed lower accuracies only for low frequency verbs, irrespective of their regularity, which points to better control of verbal inflexions at 7 than at five years old. Hartshorne and Ullman (Reference Hartshorne and Ullman2006) argue that since the majority of the errors they observed coincided with verbs with a high density of orthographic neighbors, the errors were the result of associations in lexical memory. Thus, in their view, girls were still directly accessing the lexicon by means of the declarative memory system rather than using the rule governed procedural system. In contrast to Hartshorne and Ullman’s (Reference Hartshorne and Ullman2006) study, the stimuli of the present experiment were matched by a number of lexical neighbors. Therefore, the higher rate of errors generated by 1st grade girls for irregular low frequency verbs may not be caused by co-variation of irregular forms with the number of orthographic neighbors but could be due to the use of past tense rules when applied to irregular verbs.
The qualitative analysis (see Figure 5) also shows important differences between girls at preschool and 1st grade and differences with boys’ development. For example, repetition errors and over-regularization from the infinitive were more abundant in preschool than in 1st grade girls. Over-regularization indicates a potentially early development of the application of rules, while repetition indicates reduced vocabulary for the youngest girls, who seem to enhance their lexical representations at a later stage when reaching 1st grade. The oldest boys, on the contrary, show less omission and repetition errors, more over-regularizations from infinitives and more changes of number, tense and person. This situation could evidence a delay in boys with respect to girls when applying broad morphological rules and simultaneously increase their representation of infrequent verbs.
In contrast to Bornstein et al. (Reference Bornstein, Hahn and Haynes2004), the present study did not find gender differences early on (e.g., in preschool) that diminished with age (e.g., by 1st grade). In actual fact, gender differences were found in the older rather than younger group. An important point to bear in mind is contrasting the age of participants (5 and 7 years) and the task proposed here (elicitation task) with the ages and tasks in the majority of developmental studies in the literature. These studies commonly involve children between 2 and 6 years old and a spontaneous speech recording. Error rates increase substantially in our elicitation task, even when participants’ ages are higher, because the task is more demanding (differences between narratives production triggered by the elicitation task and speech samples recording were also found by Fiestas & Peña, Reference Fiestas and Peña2004 and Gazella & Stockman, Reference Gazella and Stockman2003, and differences in grammaticality whit the same tasks were found by Jackson-Maldonado & Maldonado, Reference Jackson-Maldonado and Maldonado2017). The strict requirements of the task would clarify why, at the age of 7, differences between girls and boys emerge. For instance, the greater accuracy of girls at 1st grade with regular and more frequent verbs, as well as the absence of differences at preschool, support that, at this age, girls are more efficient than boys when applying both, procedural and declarative memory. This allows direct access to lexical representations and also the application of morphological compositional rules to obtain correct tenses (Aveledo, Reference Aveledo2006; Marcus et al., Reference Marcus, Pinker, Ullman, Hollander, Rosen, Xu and Clahsen1992). The parallel evolution of frequency and regularity variables on the accuracy of girl’s responses could be interpreted as supporting a connectionist model of language production based on a single mechanism that take the orthographic similarity between words as the only evidence to extract the morphological familiarity between verbal forms of the same stem (Plunkett & Marchman, Reference Plunkett and Marchman1993). The high rate of errors for low irregular verbal forms, with respect to high regular forms, as an argument in favor of double route accounts could be responded by connectionists supporters as a problem of less orthographic similarity, but even so, irregular forms maintain a certain degree of similarity that allows the learning based on orthography. Many verbs included in our experiment change its orthographic aspect from the present form, offered to the children in the elicitation task, to the past form, only in a vowel or a diphthong, such as in duermo-dormí [I sleep-I slept], vuelvo-volví [I come back-I went back], ruego-rogué [I beg-I begged]. Therefore, the orthographic similarity is maintained even for irregular verbs, and the relationship between forms, could be learned by children in a few expositions. However, the number of errors committed by girls on the irregular low frequency verbs is not reduced with the experience accumulated by 7 years old girls in relation to 5 years and therefore, that is not supporting a single mechanism as the proposed by Plunkett and Marchman (Reference Plunkett and Marchman1993). The boys, however, increase the rate of accuracy for these verbs in oldest children (see Table 2). Boys and girls maintain a different evolution in the use of morphological rules and the interaction of regularity by frequency support, we think, the double account for the production of verbal forms.
Constructivist proposals of verbal inflexion acquisition support also a non-differentiated system of verbal learning based on experience and a gradual development of inflexion versus the abrupt and error-free acquisition of verbs proposed by the generativists (Tomasello, Reference Tomasello2000). Some data on Spanish children support this gradual acquisition of verb production based on the errors produced by two children between 2.0 and 2.6 years old (Aguado-Orea & Pine, Reference Aguado-Orea and Pine2015). Regarding our results, the interaction between frequency and regularity obtained supports the assumptions of the dual route model. However, other interactions such as that between age and frequency and also the parallel increase in girls’ to use rules and exploit their lexical access support a development of verbal forms based on experience with words. In other words, the greater impact of frequency on the youngest children highlights the importance of increasing the lexicon before developing rules.
Gender differences between girls and boys seem to be more relevant in the evolution of linguistic ability than within a particular age. Further research should be undertaken to clarify the level of inter-dependency between procedural and declarative memory, taking into account the need of observing a wider range of ages (i.e., testing the elicitation task from the age of 3 to 10). This range would allow for a more comprehensive comparison between girls and boys when testing the hypothesis, the boys might evolve later than girls in the use of lexical and by-rules processing. Also the manipulation, or the control, of some developmental abilities different of language, such as general intelligence, could provide new hypothesis about their inter-dependence.
The greater impact of frequency on the production of irregular forms as well as the evolution from a lexical to a rule-based procedure of production, at oldest children, support a dual route model of verbal production. The results are conditioned by the elicitation task, more demanding than the collection of spontaneous samples of speech typically used with younger children. Gender differences between girls and boys were observed at the age of 7, suggesting differing developmental speeds for different memory procedures. Girls show a better domain of morphological rules but also of lexical direct access.
Appendix
List of verbs employed in the study along with their values on frequency, length and number of neighbors