Nomenclature
-
 $x = a,e,\Omega,i,\omega, \theta $
-
the orbital element vector
-
$t_{i,p}^{initial}$
,
$t_{i,p}^{end}$
-
the initial and end time of the
$p$
th sub-mission for the
$i$
th satellite -
$t_{i,p}^{lambert}$
,
$t_{i,back}^{lambert}$
-
time required for satellite
$i$
to transfer orbit -
$t_i^{parking}$
,
$t_{i,p,k}^{service}$
-
time required of satellite
$i$
for parking and on-orbit service -
$t_i^{end}\;$
-
the time for servicing satellite
$i$
to return to the space station -
$\delta {v_{i,p}}$
-
the change in velocity vector for satellite
$i$
during the
$p$
th manoeuver -
${\textbf{S}} = \mathop \sum \nolimits_{i = 1}^m \left\{ {{\textbf{S}}_i^{trans},{\textbf{S}}_i^{time}} \right\}$
-
optimisation variables
-
${\textbf{C}}$
-
total cost
-
$a_{q,w}^i$
-
the binary variable that elucidate the transfer path of satellite
$i$
-
${\beta _0},\gamma, \bar \alpha, {N_{}},{N_d},{M_p}$
-
firefly algorithm parameters
-
$s_i^k,s_j^k$
-
individual fireflies


Abbreviations
- OOS
-
on-orbit service
- NP-hard
-
non-deterministic polynomial hard
- TSP
-
travelling salesman problem
- VRP
-
vehicle routing problem
- GA
-
genetic algorithm
- FA
-
firefly algorithm
- ACO
-
ant colony optimisation
- PSO
-
particle swarm optimisation
- LNS
-
large neighbourhood search
- TRCTSP
-
time-related coloured travelling salesman problem
- CTSP
-
coloured travelling salesman problem
- EFA
-
enhanced firefly algorithm
- PSMS
-
positional substitution mutation strategy
- DES
-
differential evolution strategy
- T-PSO
-
Taguchi-based particle swarm optimisation
1.0 Introduction
In recent years, on-orbit service (OOS) has emerged as a focal point of interest within the aerospace domain, driven largely by its significant economic implications and the promising applications it heralds. Routine on-orbit servicing operations encompass visual inspections, refueling, maintenance and debris removal, among sundry others. Regardless of the OOS mission’s type, the servicing satellite must initially traverse from a parking orbit to effectuate a rendezvous with the target. Subsequently, it must sustain proximity to the target until proceeding to the subsequent target or returning as requisite. As space technology advances, the paradigm of OOS has shifted from a one-to-one to a one-to-many and many-to-many configuration. This evolution entails deploying one or more servicing satellites to sequentially deliver services to multiple targets. In the context of one-to-many and many-to-many service modalities, the prudent planning of service sequences can significantly reduce the economic costs associated with missions. Consequently, exploring mission planning and orbital manoeuver strategies under these OOS configurations becomes critically important. Indeed, whether the issue pertains to visual inspections, refueling, maintenance, debris removal or any other form of on-orbit service scheduling optimisation, it fundamentally revolves around optimising the sequence of routes to the servicing satellites. Hence, this investigation transcends the confines of any specific on-orbit service category, delving into the essence of route sequence optimisation for servicing satellites, which constitutes the fundamental challenge in achieving optimal scheduling for on-orbit services.
This optimal scheduling conundrum for route sequences epitomises a quintessential non-deterministic polynomial (NP) hard problem, amenable to modelling as the travelling salesman problem (TSP) [Reference Dorigo and Gambardella1] and the vehicle routing problem (VRP) [Reference Baker and Ayechew2], among various other related variants. Deterministic methodologies are only feasible for addressing small-scale NP-hard problems. As the complexity of these problems increases, deterministic approaches falter in delivering optimal solutions within limited time. A multitude of meta-heuristic algorithms are employed to address this class of challenges, including the genetic algorithm (GA) [Reference Mirjalili3], the firefly algorithm (FA) [Reference Fister, Fister, Yang and Brest4], particle swarm optimisation (PSO) [Reference Kennedy and Eberhart5], ant colony optimisation (ACO) [Reference Dorigo, Birattari and Stutzle6] and their various adaptations, among others. In the study by Yang [Reference Yang, Ye, Xu, Yueneng and Hua7], an economical manoeuvering strategy for inspecting multiple geosynchronous satellites was proposed, rooted in GA-based optimisation. The research presented in Ref. [Reference Sorenson and Nurre Pinkley8] framed the optimisation problem of multi-orbit routing and scheduling for refuelable space robots in on-orbit servicing as a variant of the VRP, adeptly addressed through the arc creation algorithm. Zhang and Li [Reference Zhang, Parks, Luo and Tang9, Reference Li and Xu10] offered solutions to the challenges of multi-satellite refueling planning in near-circular low-Earth orbit and Sun-synchronous orbit, respectively, employing GA and combinatorial heuristic algorithms. In Ref. [Reference Han, Guo, Wang, Li and Pedrycz11], a sophisticated two-stage optimisation framework leveraging GA was introduced to concurrently address orbit design and mission scheduling for an on-orbit refueling system operating in sun-synchronous orbit. References [Reference Rodrigues Neto and Ramos12] and [Reference Zona, Zavoli, Federici and Avanzini13] both focused on refining GA to determine the optimal sequence for active debris removal by servicing satellites. Yu [Reference Jing, Xiaoqian and Lihu14], tackled the complexities of mission scheduling for active debris removal in low-Earth orbit using PSO, meticulously accounting for communication time-window constraints, terminal state constraints and time distribution constraints. Shen [Reference Shen, Zhang, Casalino and Pastrone15], reformulated the optimisation problem of debris swarm removal as an extended TSP and resolved it using ACO. Bang introduced a sophisticated two-stage framework in Ref. [Reference Bang and Ahn16] to address the multi-objective optimisation problem associated with active debris removal tasks. In Ref. [Reference Han, Guo, Li, Zhi and Lv17], a large neighbourhood search (LNS) adaptive GA was introduced to strategise on-orbit repair tasks, with explicit attention to task duration constraints for many-to-many geosynchronous orbit satellites. Additionally, some research endeavors, such as those in Refs [Reference Chen, Gardner, Grogan and Ho18, Reference Sarton, Chen, Gunasekara and Ho19], focus on orchestrating the manoeuvers of servicing satellites during OOS operations, rather than optimising scheduling for a specific OOS mission. However, constrained by the choice of orbital manoeuvering strategies, the aforementioned findings limit the flexibility to dictate the temporal expenditure of on-orbit services. While approaches like Hohmann-based orbital manoeuvers excel in fuel efficiency, they restrict the flexibility in configuring the duration of orbital manoeuvers, which can be critical for missions with stringent time constraints.
In the studies conducted by Bakhtiari [Reference Bakhtiari, Daneshjou and Mohammadi-Dehabadi20] and Daneshjou [Reference Daneshjou, Mohammadi-Dehabadi and Bakhtiari21], both researchers addressed the challenge of scheduling on-orbit service missions while allowing for free determination of orbit change timing. Their approaches involved optimisation frameworks based on PSO and Taguchi-based PSO (T-PSO) combined with the Lambert-based orbit change strategy. It is noteworthy that the models founded on the Lambert manoeuver strategy in Refs. [Reference Bakhtiari, Daneshjou and Mohammadi-Dehabadi20, Reference Daneshjou, Mohammadi-Dehabadi and Bakhtiari21] optimise the temporal variable, thereby placing greater demands on the optimisation algorithms, especially when dealing with a large number of service objectives. Unfortunately, the number of service targets in both cases does not exceed ten. Moreover, Refs [Reference Bakhtiari, Daneshjou and Mohammadi-Dehabadi20, Reference Daneshjou, Mohammadi-Dehabadi and Bakhtiari21] do not incorporate additional constraints within the optimal scheduling process of on-orbit services.
The prevailing limitation in optimising on-orbit service scheduling encompasses constraints such as fuel limitations, time window constraints and J2 perturbations, as thoroughly examined in Refs [Reference Zhang, Parks, Luo and Tang9, Reference Li and Xu10, Reference Shen, Zhang, Casalino and Pastrone15, Reference Han, Guo, Li, Zhi and Lv17]. While significant research has been devoted to the optimal scheduling of OOS, we argue that certain critical limitations, such as differences in target access capabilities, have yet to be addressed. Current studies typically assume that each servicing satellite can universally access every target, implying an omnipresent capacity to serve any target. However, this assumption is unrealistic. For example, servicing satellites designed primarily for refueling may lack the capability to perform maintenance services. Even within the same category of on-orbit servicing missions, such as maintenance, varying specific maintenance requirements can lead to scenarios where only particular servicing satellites are equipped to handle specific targets. As space science and technology advance, a likely future scenario involves deploying a constellation of servicing satellites, each with one or more service capabilities, tasked with providing on-orbit services to a diverse array of targets with varying demands. In this complex environment, conventional scheduling models that ignore variations in access capabilities may become inadequate. This scenario highlights the urgent need for more sophisticated scheduling models capable of managing the specific needs of diverse targets while considering the heterogeneous access capabilities of each satellite. Unfortunately, to our knowledge, no existing literature explores the optimal scheduling of on-orbit services with consideration for variations in target access capabilities.
To address this research gap, we present a novel approach for modeling the optimal scheduling of on-orbit services, carefully incorporating variations in target accessibility. This is framed as a time-related coloured travelling salesman problem (TRCTSP), and we propose an enhanced firefly algorithm (EFA) to methodically tackle this complex issue. The key contributions of this paper are succinctly outlined as follows:
-
(1) The pursuit of optimal scheduling for on-orbit services, accounting for varying target accessibility, is innovatively reframed as a TRCTSP. Unlike the coloured traveling salesman problem (CTSP) [Reference Li, Zhou, Sun, Dai and Yu22], the TRCTSP incorporates both time-bounded and time-dependent cost functions.
-
(2) The TRCTSP model developed in this study significantly surpasses the complexity of the traditional CTSP model, due to the nuances of orbital dynamics and the constraints imposed by target accessibility. To address this challenge, a novel EFA is introduced. This advanced algorithm combines the positional substitution mutation strategy (PSMS) with the differential evolution strategy (DES). Experimental results demonstrate that EFA outperforms GA [Reference Mirjalili3], LNS-GA [Reference Han, Guo, Li, Zhi and Lv17], PSO [Reference Kennedy and Eberhart5], T-PSO [Reference Daneshjou, Mohammadi-Dehabadi and Bakhtiari21] and FA [Reference Fister, Fister, Yang and Brest4] in the given problem scenario.
The structure of this article is as follows: Section 2 outlines the necessary prerequisites. Section 3 details the optimisation model, while Section 4 explores the algorithmic design. Section 5 presents numerical simulations to validate the proposed approach. Finally, Section 6 offers the conclusion.
2.0 Problem scenario and on-orbit service strategy
In the envisioned mission scenario,
 $m$
satellites are deployed to perform on-orbit servicing operations at
 $n$
designated targets. The service categories include visual inspection, refueling, maintenance and debris removal, numbered sequentially as 1, 2, 3 and 4, respectively. All servicing satellites are equipped with the capability for visual inspection. For each servicing satellite
 $i$
(where
 $i \le m$
), it possesses one or more of the following service functions in addition to visual inspection: refueling, maintenance or debris removal. Alternatively, servicing satellite
 $i$
may be equipped solely with visual inspection capabilities. Each designated target
 $j$
(where
 $j \le n$
) has a single specific service requirement. Typically, the on-orbit services are carried out in the following phases: The servicing satellite departs from the space station and enters a transfer orbit. It then exits the transfer orbit to rendezvous with the designated target at the servicing point, where it performs the required tasks. Afterward, the satellite proceeds to the next target, completes all servicing operations and eventually returns to the space station.
In Fig. 1, we provide a detailed illustration of the entire mission process, showcasing two on-orbit service operations carried out by satellite
 $i$
. Satellite
 $i$
is assigned to perform on-orbit services for
 ${P_i}$
targets (
 $\mathop \sum \nolimits_{i = 1}^m {P_i} = n$
), necessitating
 ${P_i}$
manoeuvers and corresponding service operations. Thus, satellite
 $i$
is responsible for
 ${P_i}$
sub-missions in total. In the context of Fig. 1,
 ${P_i} = 2$
. The
 $i$
th servicing satellite co-orbits with the space station within the parking orbit for a time denoted as
 $t_i^{parking}$
. Subsequently, it begins its first sub-mission by manoeuvering to and servicing its initial target. During this phase, the manoeuver time is represented as
 $t_{i,1}^{lambert}$
, the change in velocity vector from the manoeuver is
 $\delta {v_{i,1}}$
, and the service time for the first target is denoted as
 $t_{i,1,k}^{service}$
, where
 $k \in \left\{ {1,2,3,4} \right\}$
indicates the type of on-orbit service. After completing the first sub-mission, satellite
 $i$
allocates a time period of
 $t_{i,2}^{lambert}$
to achieve rendezvous with the next service target. The changes in the velocity vector during this maneuver are represented as
 $\delta {v_{i,2}}$
. The duration for servicing the second target is denoted as
 $t_{i,2,k}^{service}$
. Once all designated targets have been serviced, satellite
 $i$
requires
 $t_{i,back}^{lambert}$
to return to the space station, with velocity vector adjustments documented as
 $\delta {v_{i,back}}$
. The temporal, orbital state and mass relationships throughout the on-orbit service for the multi-satellite mission are depicted below.
The overview of the on-orbit service mission process.

2.1 Time relationship
The time instants
 $t_{i,p}^{initial}$
and
 $t_{i,p}^{end}$
marking the initial and end of the
 $p$
th sub-mission for the
 $i$
th servicing satellite (
 $1 \le p \le {P_i}$
) are determined by
 \begin{align} \begin{array}{*{20}{l}}{t_{i,p}^{initial}} { = \left\{ {\begin{array}{*{20}{l}}{t_i^{parking}} {\left( {p = 1} \right)}\\[3pt] {t_{i,p - 1}^{end}} {(1 \lt p \le {P_i})}\end{array}} \right.}\\[3pt] {t_{i,p}^{end}} { = t_{i,p}^{initial} + t_{i,p}^{lambert} + t_{i,p,k}^{service}}\end{array} \end{align}
The time instant,
 $t_i^{end}$
, for servicing satellite
 $i$
to return to the space station after accomplishing all on-orbit services can be formulated as
 \begin{align} t_i^{end} = t_{i,{P_i}}^{end} + t_{i,back}^{lambert}. \end{align}
2.2 Orbital element vector of a target after time
${\boldsymbol{\Delta }}t$

The dynamics of an object in space can be delineated through the orbital element vector
 $x = \left[ {a,e,{\Omega},i,\omega, \theta } \right]$
, where
 $a$
represents the semimajor axis,
 $e$
signifies the eccentricity,
 ${\Omega}$
represents the right ascension of the ascending node,
 $i$
stands for the inclination,
 $\omega $
denotes the argument of perigee, and
 $\theta $
represents the true anomaly. When targets revolve in a specific Keplerian orbit, it is primarily the true anomaly that undergoes variations. Given a target state
 $x\left( {{t_0}} \right)$
at
 ${t_0}$
and a time interval
 ${\Delta}t$
, we can calculate
 $\boldsymbol{{x}}\!\left( {{t_0} + {\Delta}t} \right)$
as:
 \begin{align} \boldsymbol{{x}} \!\left( {{t_0} + {\Delta}t} \right) = {\mathcal G}\!\left( {\boldsymbol{{x}}\left( {{t_0}} \right),{\Delta}t} \right) \end{align}
For a detailed derivation, see the Appendix 6.
2.3 Lambert-based manoeuver
Each servicing satellite needs to perform orbital transfers during the mission to rendezvous with the service target. In this study, servicing satellites undergo orbital transfer procedures based on Lambert’s theorem. Two manoeuvers are taken into account for each orbital transfer. Provided with the initial position vector
 ${\boldsymbol{{r}}_1}$
, final position vector
 ${\boldsymbol{{r}}_2}$
, and the transfer time
 ${\Delta}t$
of the transfer orbit, the necessary velocity changes for the two manoeuvers can be computed as:
 \begin{align} {\boldsymbol{{v}}_1} = {{\mathcal{L}}_1}\!\left( {{\boldsymbol{{r}}_1},{\boldsymbol{{r}}_2},{\Delta}t} \right),{\boldsymbol{{v}}_2} = {{\mathcal{L}}_2}\!\left( {{\boldsymbol{{r}}_1},{\boldsymbol{{r}}_2},{\Delta}t} \right) \end{align}
For a detailed derivation, see the Appendix.
In addition, if the orbital element
 $x$
of an object at a specific point along an orbit are known, it allows for the determination of the object’s position and velocity vectors
 $\boldsymbol{{r}}$
and
 $\boldsymbol{{v}}$
at that point, and vice versa. We represent this functional relationship as:
 \begin{align} \begin{array}{*{20}{l}}{\boldsymbol{{x}} = {{\mathcal T}_x}( {\boldsymbol{{r,\,v}}} ),\boldsymbol{{r}} = {{\mathcal T}_r}( \boldsymbol{{x}}),\boldsymbol{{v}} = {{\mathcal T}_v}( \boldsymbol{{x}}).}\end{array} \end{align}
Suppose that the
 $p$
th sub-mission of the
 $i$
th servicing satellite requires a manoeuver to rendezvous with the
 $j$
th target. The initiation time of this sub-mission is denoted as
 $t_{i,p}^{initial}$
, and the duration of the Lambert-based manoeuver is
 $t_{i,p}^{lambert}$
. The orbital elements for the
 $i$
th servicing satellite and the
 $j$
th target at
 $t_{i,p}^{initial}$
are known and designated as
 ${\boldsymbol{{x}}_i}\left( {t_{i,p}^{initia{\rm{l}}}} \right)$
and
 ${\boldsymbol{{x}}_j}\left( {t_{i,p}^{initial}} \right)$
. Combining the previously derived information, the change in velocity vector
 $\delta {v_{i,p}}$
required for
 $i$
th servicing satellite to manoeuver during the
 $p$
th sub-mission is
 \begin{align} {v_{i,p}} =\,& \parallel {{\mathcal{L}}_2}\left( {{{\mathcal T}_r}\left( {{\boldsymbol{{x}}_i}\left( {t_{i,p}^{initia{\rm{l}}}} \right)} \right),{{\mathcal T}_r}\left( {{\mathcal G}\left( {{\boldsymbol{{x}}_j}\left( {t_{i,p}^{initial}} \right),t_{i,p}^{lambert}} \right)} \right),{\Delta}t} \right) \nonumber \\[4pt] & - {{\mathcal T}_v}\left( {{\mathcal G}\left( {{\boldsymbol{{x}}_j}\left( {t_{i,p}^{initial}} \right),t_{i,p}^{lambert}} \right)} \right)\parallel + \parallel {{\mathcal T}_v}\left( {{\boldsymbol{{x}}_i}\left( {t_{i,p}^{initial}} \right)} \right) \nonumber\\[3pt] & - {{\mathcal{L}}_1}\left( {{{\mathcal T}_r}\left( {{\boldsymbol{{x}}_i}\left( {t_{i,p}^{initial}} \right)} \right),{{\mathcal T}_r}\left( {{\mathcal G}\left( {{\boldsymbol{{x}}_j}\left( {t_{i,p}^{initial}} \right),t_{i,p}^{lambe{\rm{r}}t}} \right)} \right),{\Delta}t} \right)\parallel \end{align}
Given that the initial mass of the
 $i$
th servicing spacecraft is
 ${m_{i,0}}$
and its mass after completing the
 $p$
th sub-mission is
 ${m_{i,p}}$
, the mass of fuel consumed by the
 $i$
th servicing spacecraft in the
 $p$
th sub-mission is
 \begin{align} \delta {m_{i,p}} = {m_{i,p - 1}} - {m_{i,p - 1}}\exp\!\left( {\frac{{ - \delta {v_{i,p}}}}{{{g_0}{I_{sp}}}}} \right) \end{align}
where
 ${g_0}$
is the sea-level standard acceleration of gravity, and
 ${I_{sp}}$
is the specific impulse of thrusters.
3.0 Optimisation model
In alignment with the on-orbit service strategy outlined in the previous section, the multi-objective on-orbit service problem can be framed as a TRCTSP, which falls under the category of NP-hard combinatorial optimisation problems. The coloured travelling salesman problem (CTSP) is defined as follows: each salesman and city is associated with one or more colours, and a city can be visited only once by a salesman of the same colour. The primary objective is to determine the shortest Hamiltonian loop for all salesmen while strictly adhering to the colour constraints. In this analogy, colour represents the type of on-orbit service being performed, salesman signifies the servicing satellite, and city denotes the target being serviced. This section focuses on defining the design variables, outlining the objective function and specifying the constraint conditions.
3.1 Design variables
As previously mentioned, the completed on-orbit service operation comprises
 $m$
independent service sub-missions, each corresponding to a target sequence
 ${{\textbf{S}}_i}$
, where
 $i$
represents the serial number of the sub-mission and also the serial number of the corresponding servicing satellite. Each sequence
 ${{\textbf{S}}_i}$
encompasses two pieces of information, comprising the transfer sequence
 \begin{align*} {\textbf{S}}_i^{trans} = \left[ {s_{i,1}^{trans},s_{i,2}^{trans}, \cdots, s_{i,p}^{trans}, \cdots, s_{i,{P_i}}^{trans}} \right] \end{align*}
and the time sequence
 \begin{align*} {\textbf{S}}_i^{time} = \left[ {t_i^{parking},t_{i,1}^{lambert}, \cdots, t_{i,{P_i}}^{lambert},t_{i,1,k}^{service}, \cdots, t_{i,{P_i},k}^{service},t_{i,back}^{lambert}} \right]. \end{align*}
where
 $s_{i,p}^{trans}$
signifies the serial number of the target for servicing satellite
 $i$
in the
 $p$
th sub-mission. The explanations for all other variables have been provided in the preceding section. Consequently, the optimisation variables for the multi-objective on-orbit service problem can be expressed as:
 \begin{align} {\textbf{S}} = \mathop \sum \limits_{i = 1}^m {{\textbf{S}}_i} = \mathop \sum \limits_{i = 1}^m \left\{ {{\textbf{S}}_i^{trans},{\textbf{S}}_i^{time}} \right\}. \end{align}
3.2 Constraint conditions
The transfer sequence
 ${\textbf{S}}_i^{trans}$
is insufficient for detailing the constraints on transfer paths in the TRCTSP model. Consequently, we employ the binary variable
 $a_{q,w}^i \in \left\{ {0,1} \right\}$
to elucidate the transfer path of the
 $i$
th servicing satellite and provide the associated constraints. In this context,
 $q,w \in \left\{ {0,1,2, \ldots, n} \right\}$
, where
 $\left\{ 0 \right\}$
denotes the space station, and
 $\left\{ {1,2, \ldots, n} \right\}$
denote the serial numbers of the targets.
 $a_{q,w}^i = 1$
if the
 $i$
th servicing satellite possesses a direct manoeuvering path between target
 $q$
and target
 $w$
; and otherwise,
 $a_{q,w}^i = 0$
. As an illustrative example to elucidate this concept, let’s consider the transfer sequence of the 1st servicing satellite
 ${\textbf{S}}_1^{trans} = \left[ {2,1,5} \right]$
. In this case, we have:
 $a_{0,2}^1 = 1$
,
 $a_{2,1}^1 = 1$
,
 $a_{1,5}^1 = 1$
,
 $a_{5,0}^1 = 1$
, and all other relevant binary variables are 0. For the sake of simplicity in our description, we denote
 $\left\{ {1,2, \cdots, n} \right\}$
as
 $\langle n\rangle $
. The multi-objective on-orbit service problem is governed by the following constraint conditions:
-
(a) All servicing satellites are required to embark from and return to the space station.
 \begin{align} \mathop \sum \limits_{w = 1}^n a_{0,w}^i = 1,\forall i \in \langle m\rangle, \forall w \in \langle n\rangle \\[-25pt] \nonumber \end{align}
 \begin{align} \mathop \sum \limits_{q = 1}^n a_{q,0}^i = 1,\forall i \in \langle m\rangle, \forall q \in \langle n\rangle \end{align}
Allow the service capacity set of the satellite and the service requirement set of the target to be denoted as
 $c_i^{satellite}$
and
 $c_q^{target}$
, respectively, with
 $c_i^{satellite},c_q^{target} \in \left\{ {1,2,3,4} \right\}$
. In accordance with the problem scenario outlined in Section 2, each target has a solitary requirement, while each satellite can possess either one or two service capabilities. If
 $c_q^{target} \in c_i^{satellite}$
, it signifies that servicing satellite
 $i$
possesses the capability to service target
 $q$
. Subsequently, we can derive the serial number set of targets accessible by the
 $i$
th satellite as
 ${V_i} = \left\{ {q:c_q^{target} \in c_i^{satellite},q \in 1,2, \cdots, n} \right\}$
.
-
(b) Servicing satellite
$i$
cannot access targets for which it lacks the capability to provide service:

 \begin{align} \mathop \sum \limits_{q = 1}^n \mathop \sum \limits_{w = 1}^n a_{q,w}^i = 0,\forall i \in \langle m\rangle, \forall q \in \langle n\rangle \backslash {V_i},\forall w \in \langle n\rangle \\[-25pt] \nonumber \end{align}
 \begin{align} \mathop \sum \limits_{q = 1}^n \mathop \sum \limits_{w = 1}^n a_{q,w}^i = 0,\forall i \in m,\forall q \in n,\forall w \in n\backslash {V_i}. \end{align}
-
(c) Each target must be accessed once and only once:
 \begin{align} \mathop \sum \limits_{q = 1}^n \mathop \sum \limits_{i = 1}^m a_{q,w}^i = 1,\forall i \in \langle m\rangle, \forall q \in \langle n\rangle, \forall w \in \langle n\rangle, q \ne w \\[-25pt] \nonumber \end{align}
 \begin{align} \mathop \sum \limits_{ = 1}^n \mathop \sum \limits_{i = 1}^m a_{q,w}^i = 1,\forall i \in \langle m\rangle, \forall q \in \langle n\rangle, \forall w \in \langle n\rangle, q \ne w \\[-25pt] \nonumber \end{align}
 \begin{align} \mathop \sum \limits_{q = 1}^n a_{qw}^i = \mathop \sum \limits_{l = 1}^n a_{wl}^i,q \ne w \ne l,\forall w,q,l \in \langle n\rangle, \forall i \in \langle m\rangle \end{align}
-
(d) The incorporation of subloops in the transfer path of servicing satellite manoeuvers is strictly forbidden:
 \begin{align} u_q^i - u_w^i + n \times a_{q,w}^i \le n - 1,\forall q,w \in n,q \ne w,\forall i \in m, \end{align}
where
 $u_q^i$
represents the count of targets serviced by satellite
 $i$
from the station to target
 $q$
.
-
(e) Considering the restrictions on the fuel capacity of each servicing satellite, the total fuel consumption during manoeuvers will not surpass a maximum value
$\delta {m_{i,max}}$
:

 \begin{align} \delta {m_{i,back}} + \mathop \sum \limits_{p = 1}^{{P_i}} \delta {m_{i,p}} \le \delta {m_{i,max}}, \end{align}
-
(f) The parking time, manoeuver time, and on-orbit service time for each servicing spacecraft are restricted:
 \begin{align} \begin{array}{c@{\quad}c}t_{min}^{final} \le {t_{max}} \le & t_{max}^{final}\\[3pt] t_{i,min}^{lambert} \le t_{i,p}^{lambert} \le & t_{i,max}^{lambert}\\[3pt] t_{i,min}^{lambert} \le t_{i,back}^{lambert} \le & t_{i,max}^{lambert}\\[3pt] t_{i,min}^{parking} \le t_i^{parking} \le & t_{i,max}^{parking}\\[3pt] t_{i,p,k,min}^{service} \le t_{i,p,k}^{service} \le & t_{i,p,k,max}^{service} \end{array} \end{align}
where
 $t_{min}^{final}$
,
 $t_{max}^{final}$
,
 $t_{i,min}^{lambert}$
,
 $t_{i,max}^{lambert}$
,
 $t_{i,min}^{r{\rm{k}}ing}$
,
 $t_{i,max}^{parking}$
,
 $t_{i,p,k,min}^{service}$
, and
 $t_{i,p,k,max}^{service}$
are known constants. If
 $t_{i,p,k}^{service}$
exceeds
 $t_{i,p,k,min}^{service}$
, it indicates that the
 $i$
th satellite will park in the target orbit upon accomplishing its
 $i$
th service target sub-mission, with a parking duration of
 $t_{i,p,k}^{service} - t_{i,p,k,min}^{service}$
.
3.3 The cost function
This multi-objective optimisation function is normalised prior to summation. The total cost
 ${\textbf{C}}$
of the campaign is defined as:
 \begin{align} {\textbf{C}} = \kappa {{{t_{max}} - t_{min}^{final}} \over {t_{max}^{final} - t_{min}^{final}}} + \left( {1 - \kappa } \right){{\sum\limits_{i = 1}^m {\left( {\delta {m_{i,back}} + \sum\limits_{p = 1}^{{P_i}} \delta {m_{i,p}}} \right)} } \over {m\delta {m_{i,max}}}} + \varepsilon {n_{violate}} \end{align}
where
 ${t_{max}} = max\left( {t_{1,{P_1}}^{end},t_{2,{P_2}}^{end}, \cdots, t_{i,{P_i}}^{end}, \cdots, t_{m,{P_m}}^{end}} \right)$
represents the duration required to accomplish the entire task,
 $\kappa $
denotes the weight parameter,
 $\varepsilon $
is the penalty coefficient, and
 ${n_{violate}}$
represents the number of targets in the planned path that violate the reachability variances restriction. The penalty coefficient
 $\varepsilon $
should take a value much larger than the normalised multi-objective function to ensure that the relevant constraints are achieved.
 $\delta {m_{min}}$
is the minimum mass consumption of the task estimated by advance computation. Our optimisation objective encompasses two facets: minimissing mission completion time and reducing fuel consumption for servicing satellite manoeuvers. Unfortunately, these objectives are inherently in conflict; shorter mission completion times typically result in higher fuel consumption, necessitating a trade-off between the two. The weighting parameter
 $\kappa $
captures this trade-off, where a higher value of
 $\kappa $
indicates a greater emphasis on swift mission completion at the cost of increased fuel consumption. We will discuss the effect of the value of the weighting parameter
 $\kappa $
on the experimental results in the subsequent section.
Remark 1.
This study introduces a pioneering approach that integrates the constraints of variances in target accessibility for optimising the scheduling of on-orbit services, conceptualising it as TRCTSP. To our knowledge, this original concept has not been previously proposed. TRCTSP distinguishes itself from CTSP [Reference Li, Zhou, Sun, Dai and Yu22] through the incorporation of a time-bounded and time-dependent cost function. Condition
 $a$
defines the mathematical expression of the constraint on variances in target accessibility. Failure to satisfy this constraint incurs a significant total cost (19), due to the penalty term
 $\varepsilon {n_{violate}}$
.
Remark 2.
Indeed, the constraint of variances in target accessibility demands a higher level of optimisation expertise from the meta-heuristic algorithm compared to the time window restriction and fuel constraint [Reference Zhang, Parks, Luo and Tang9, Reference Li and Xu10, Reference Shen, Zhang, Casalino and Pastrone15, Reference Han, Guo, Li, Zhi and Lv17]. Moreover, the optimisation challenge is further intensified by the temporal optimisation sequence
 $S_i^{time}$
. Traditional meta-heuristic algorithms such as GA, PSO, FA, etc., often fall short in producing optimal outcomes or even feasible solutions that comply with the constraints, especially as the number of serviced satellites increases. This shortcoming will be highlighted in subsequent experiments. Consequently, there is an urgent need to refine conventional meta-heuristic algorithms and enhance their optimisation capabilities to meet the model-solving requirements outlined in this study. In this context, FA will undergo refinement, as elaborated in the following section.
4.0 Algorithm design
In this section, we will employ EFA to address the multi-objective on-orbit servicing problem delineated in the preceding section. The traditional firefly algorithm draws inspiration from the collective behaviour of fireflies during their aggregation and can be formulated as follows [Reference Fister, Fister, Yang and Brest4]:
-
(1) The light intensity of the
$i$
th firefly, represented by the solution
${s_i}$
, is inversely proportional to the value of the cost function
${\textbf{C}}$
. -
(2) The attractiveness
${\beta _{ij}}$
between firefly
$i$
and firefly
$j$
is mathematically defined as follows:


 \begin{align} {\beta _{ij}} = {\beta _0}{{\rm{e}}^{ - \gamma r_{ij}^2}} \end{align}
where
 ${\beta _0}$
represents the attractiveness when
 ${r_{ij}} = 0$
,
 ${\rm{e}}$
denotes Euler’s number, and
 $\gamma $
signifies the light absorption coefficient. The Euclidean distance between two fireflies
 ${s_i}$
and
 ${s_j}$
, denoted as
 ${r_{ij}}$
, is expressed as:
 \begin{align} {r_{ij}} = \left\| {{s_i} - {s_j}} \right\| = \sqrt {\sum\limits_{d = 1}^N {{{\left( {{s_{i,d}} - {s_{j,d}}} \right)}^2}} } \end{align}
where
 $N$
characterises the dimensionality of the optimisation problem.
-
(3) The
$i$
th firefly shifts towards another more attractive
$j$
th firefly, and
${s_i}$
is updated as follows:


 \begin{align} s_i^k = s_i^{k - 1} + {\beta _{ij}} \cdot \left( {s_j^{k - 1} - s_i^{k - 1}} \right) + \alpha {\varepsilon _i} \end{align}
where
 $k$
represents the iteration number of the algorithm,
 $\alpha $
stands for the step factor, and
 ${\varepsilon _i}$
is an N-dimensional random number following either a uniform or Gaussian distribution. Scholars have primarily adopted a dynamic step-size strategy to enhance the stochastic aspect of the algorithm. In mathematical terms, this is represented as:
 \begin{align} {\alpha ^{k + 1}} = \bar \alpha {\alpha ^k} \end{align}
where
 $\bar \alpha $
represents the dynamic step coefficient. With this adjustment, (22] transforms as follows:
 \begin{align} s_i^k = s_i^{k - 1} + {\beta _{ij}} \cdot \left( {s_j^{k - 1} - s_i^{k - 1}} \right) + {\alpha ^k}{\varepsilon _i} \end{align}
The multi-objective on-orbit servicing problem poses a formidable optimisation challenge with a multitude of local optimal solutions. The inherent complexity can result in the firefly algorithm experiencing premature convergence, characterised by a swift decline in population diversity, thereby impeding the optimisation process. Moreover, the pronounced attraction of the population to local optima may induce continuous oscillations, hindering the algorithm from achieving convergence. In response to these challenges, this study introduces PSMS and DES meticulously designed to augment algorithmic performance.
4.1 Positional substitution mutation strategy
During the update process of firefly individuals, we introduce PSMS. Let the solution of firefly individual
 $i$
after the
 $k$
th iteration be denoted as
 $s_i^k$
. We randomly select two elements within
 $s_i^k$
and exchange their positions, resulting in
 $\bar s_i^k$
. Subsequently, the values of the consumption functions, denoted as
 ${\textbf{C}}\left( {s_i^k} \right)$
and
 ${\textbf{C}}\left( {\bar s_i^k} \right)$
, are calculated. If
 ${\textbf{C}}\left( {\bar s_i^k} \right) \lt {\textbf{C}}\left( {s_i^k} \right)$
, we replace the solution
 $s_i^k$
with
 $\bar s_i^k$
. This positional substitution operation is repeated
 ${N_s}$
times.
On one hand, given that this operation occurs subsequent to individual position updates and is nested within the population update process, the value of
 ${N_s}$
must not be overly large. Excessive values would augment the computational intricacy of the algorithm, consequently diminishing its convergence speed. On the other hand, if the frequency of these operations is too scant, the alterations in individual positions will be negligible, rendering the escape from local optima unattainable and impairing the precision of the optimisation search. Therefore, it is recommended that
 ${N_s}$
be confined within the range
 $2 \le {N_s} \le 5$
.
4.2 Differential evolution strategy
To maximise the utilisation of population-wide optimal information and enhance the performance of the algorithm, DES is incorporated into the population updating process. After
 $k$
iterations, the best solution
 $s_{best}^k$
within the firefly population is recorded. Subsequently, two solutions of fireflies,
 $s_i^k$
and
 $s_j^k$
, are randomly selected from the population to compute
 $\bar s_{best}^k$
using the following formula:
 \begin{align} \bar s_{best}^k = s_{best}^k + \eta \left( {s_i^k - s_j^k} \right) \end{align}
In this equation,
 $\eta $
is a variable following a normal distribution. Subsequently, the values of the consumption functions, denoted as
 ${\textbf{C}}\left( {s_{best}^k} \right)$
and
 ${\textbf{C}}\left( {\bar s_{best}^k} \right)$
, are calculated. If
 ${\textbf{C}}\left( {\bar s_{best}^k} \right) \lt {\textbf{C}}\left( {s_{best}^k} \right)$
, we replace the solution
 $s_{best}^k$
with
 $\bar s_{best}^k$
. The differential evolution operation is repeated
 ${N_d}$
times.
As there is no circular nesting in this operation,
 ${N_d}$
can be chosen to be a relatively larger value, enabling the utilisation of historical optimal information to guide the search process and enhance the algorithm’s convergence accuracy. Taking cues from the differential evolution algorithm, the value of
 ${N_d}$
can be set equal to the population size, denoted as
 ${M_P}$
.
The pseudo-code of EFA is depicted in Algorithm 1. DES is outlined in Algorithm 2, and PSMS is detailed in Algorithm 3. Here, the function
 ${\textbf{RandomNaturalNumber}}\left( {{M_P}} \right)$
denotes the generation of random natural numbers that are less than or equal to
 ${M_P}$
.
The enhanced firefly algorithm

Remark 3.
Inspired by the methodology introduced in LNS [Reference Han, Guo, Li, Zhi and Lv17], we introduce PSMS as an enhancement to FA. However, PSMS, as proposed in this study, offers two distinct advantages over LNS: (a) While LNS executes at the conclusion of each iteration of the algorithm, PSMS operates during each update of the population individuals within the algorithm. Specifically, for each optimisation instance, LNS executes
 ${M_I}$
times, whereas PSMS executes
 ${M_I}{M_P}$
times. This discrepancy implies that the extensive exploration capacity of PSMS far exceeds that of LNS. (b) In contrast to the intricate destruction and repair operations featured in LNS, PSMS employs a simpler and more efficacious positional substitution operation. This operation is equally adept at enhancing local search capabilities. Additionally, PSMS incorporates an acceptance criterion akin to a hill-climber for new solutions, wherein solutions are updated only when superior results are achieved, thereby averting the generation of detrimental new solutions. This enhancement effectively amplifies the algorithm’s capacity for extensive exploration and facilitates the generation of solutions that adhere to imposed constraints.
Remark 4. DES draws inspiration from the principles of the differential evolution algorithm (DEA) outlined in [Reference Das and Suganthan23], operating at the conclusion of each iteration of EFA. Given that DES aims to augment FA’s search prowess and escape local optima, it incorporates an acceptance criterion akin to a hill-climber for new solutions, a feature not present in DEA. Consequently, the algorithm’s local search capability is effectively bolstered.
Function of  ${\textbf{DifferentialEvolution}}\left( {\left\{ {s_1^k, \cdots, s_N^k} \right\}} \right)$

Function of  ${\textbf{SubstitutionMutation}}\left( {s_i^k} \right)$

5.0 Experiments and results
In this section, we will conduct three scenarios with a total of nine cases of experiments.
5.1 Experimental settings
Each servicing satellite has a total mass of 1,000 kg and carries 500 kg of chemical fuel, with the thruster parameter
 ${g_0}{I_{sp}}$
set at 3,000 m/s [Reference Zhang, Parks, Luo and Tang9]. The initial solutions are generated randomly, and the parameter settings used during the simulation are detailed in Table 1. The experimental setup includes an Intel(R) Core(TM) i7-13700 CPU.
Parameter settings

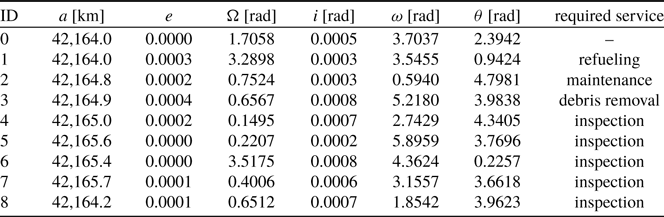
In scenario 1, the space station, all servicing satellites, and all targets are operating in geostationary Earth orbit (GEO). Drawing inspiration from the GEO orbital element settings in the literature [Reference Han, Guo, Li, Zhi and Lv17, Reference Yan, Guo, Li and Song24], the corresponding orbital elements are randomly generated within the following ranges:
 $a \in \left[ {42,164,{\rm{\;}}42,166} \right]{\rm{km}}$
,
 $e \in \left[ {0,0.0004} \right]$
,
 ${\Omega} \in {\left[ {0,360} \right]^ \circ }$
,
 $i \in {\left[ {0,0.05} \right]^ \circ }$
,
 $\omega \in {\left[ {0,360} \right]^ \circ }$
,
 $\theta \in {\left[ {0,360} \right]^ \circ }$
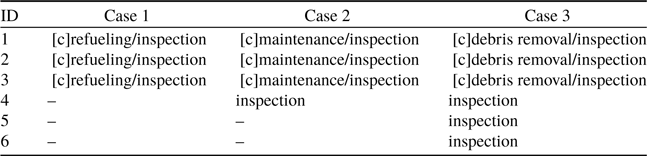
. Experiments will be conducted under scenario 1 with three cases: 3 satellites serving 8 targets, 4 satellites serving 15 targets, and 6 satellites serving 20 targets. Table 2 outlines the service capabilities of the servicing satellites in these three cases, where ID represents the number of the servicing satellite. The initial orbital parameters for the three cases in scenario 1, along with the specific on-orbit service requirements, are presented in Tables 7, 10 and 11 in the Appendix, where ID denotes the number of each target, and ID 0 represents the space station.
Servicing capabilities of servicing satellites

In scenario 2, the space station, all servicing satellites, all targets are operating on randomly generated orbits. The corresponding orbital elements are randomly generated in the following range:
 $a \in \left[ {6,800,{\rm{\;}}42,000} \right]\;{\rm{km}}$
,
 $e \in \left[ {0,0.2} \right]$
,
 ${\Omega} \in {\left[ {0,360} \right]^ \circ }$
,
 $i \in {\left[ {0,180} \right]^ \circ }$
,
 $\omega \in {\left[ {0,360} \right]^ \circ }$
,
 $\theta \in {\left[ {0,360} \right]^ \circ }$
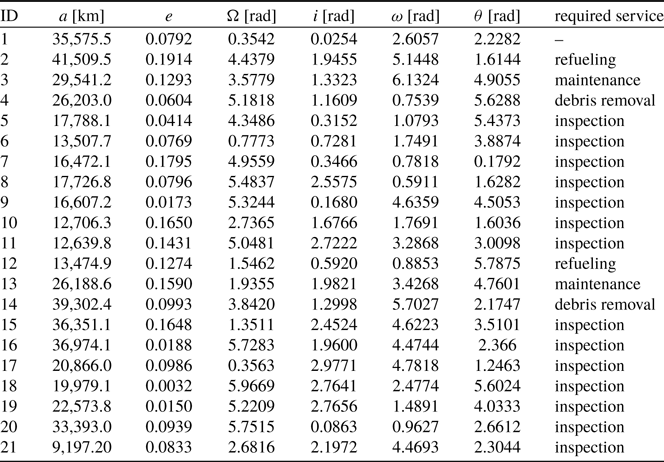
. We will conduct experiments under scenario 2 with 3 satellites serving 8 targets, 4 satellites serving 15 targets, and 6 satellites serving 20 targets, for a total of three cases. Table 2 outlines the service capabilities of the servicing satellites in three cases under scenario 2, where ID is the number of the serving satellite. The initial orbital parameters for the three cases under scenario 2 and the specific on-orbit service requirements are presented in Tables 8, 12 and 13 in the Appendix, where ID is the number of each target and ID 0 represents the space station.
In scenario 3, the space station, all servicing satellites, all targets are operating on low Earth orbits. The corresponding orbital elements are randomly generated in the following range:
 $a \in \left[ {7,380,{\rm{\;}}7,400} \right]{\rm{km}}$
,
 $e \in \left[ {0,0.0004} \right]$
,
 ${\Omega} \in {\left[ {99,101} \right]^ \circ }$
,
 $i \in {\left[ {81,82} \right]^ \circ }$
,
 $\omega \in {\left[ {0,0} \right]^ \circ }$
,
 $\theta \in {\left[ {0,360} \right]^ \circ }$
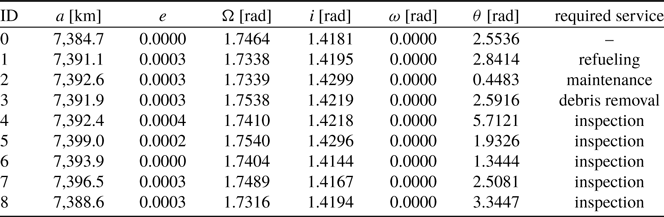
[Reference Jing, Xiaoqian and Lihu14]. We will conduct experiments under scenario 3 with 3 satellites serving 8 targets, 4 satellites serving 15 targets, and 6 satellites serving 20 targets, for a total of three cases. Table 2 outlines the service capabilities of the servicing satellites in three cases under scenario 3, where ID is the number of the serving satellite. The initial orbital parameters for the three cases under scenario 3 and the specific on-orbit service requirements are presented in Tables 9, 14 and 15 in the Appendix, where ID is the number of each target and ID 0 represents the space station.
5.2 Optimisation results
Tables 16, 17 and 18 give the optimisation results for the three cases of scenario 1, including transfer sequence, time of arrival, time of departure, velocity change and total fuel mass consumption.
Here, we will use the information of servicing satellite 1 from the optimisation results under case 1, scenario 1, as an example to elucidate the significance of the optimisation outcome.
Transfer sequence 0-7-4-1-0 indicates that servicing satellite 1 departs from the space station, sequentially provides on-orbit services to targets 7, 4 and 1, and ultimately returns to the space station.
Time of arrival refers to the moment when servicing satellite 1 reaches the target corresponding to the transfer sequence mentioned above. Specifically, servicing satellite 1 is stationed at the initial moment of 0. The subsequent arrival times at targets 7, 4 and 1 are 47.97, 86.37 and 127.96 h, respectively. Finally, the satellite returns to the station at 166.16 h.
Time of departure denotes the moment when servicing satellite 1 departs from the target corresponding to the transfer sequence mentioned above. Specifically, satellite 1 left the space station at 22.47 h and departed from targets 7, 4 and 1 at 63.97, 106.66 and 143.96 h, respectively.
It is noteworthy that the time of arrival and time of departure can be used to calculate both the duration required for each orbital transfer and the time spent on each on-orbit service. For instance, the time spent servicing target 7 by satellite 1 is determined by subtracting the time of arrival at target 7 from the time of departure from target 7, yielding 16 h. The time required for the orbital transfer from the station to target 7 is calculated by subtracting the time of departure from the station from the time of arrival at target 7, resulting in 25 h.
Additionally, we provide the velocity change required for each orbital transfer based on Lambert’s theory. For example, the velocity change required to maneuver from the station to target 7 is 178.04 m/s. Finally, the table details the fuel consumption of each servicing satellite upon completing its mission.
Tables 19, 20 and 21 present the optimisation results for the three cases in scenario 2. Tables 22, 23 and 24 present the optimisation results for the three cases in scenario 3. These results are displayed in the same manner as those for scenario 1.
It should be noted that scenario 2 is purely a mathematical simulation and does not account for practical engineering applications. When parameterising the target initial orbits for scenario 2, we did not reference values from commonly used orbits. The purpose of this setup is twofold: to verify the validity and superiority of the proposed algorithm from another perspective, and to lay the theoretical groundwork for potential spatial applications. The results indicate that the velocity change required for orbital transfer is substantial under the scenario 2 settings. Conventional chemical fuels would be insufficient to meet such demands. Therefore, in scenario 2, we assume that the servicing satellite is equipped with high-power ion thrusters, offering a specific impulse of up to 70,000 m/s [Reference Koroteev, Lovtsov, Vyacheslav, Muravlev, Andrey and Shagayda25].
5.3 Superiority experimental results
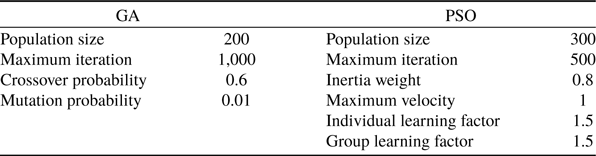
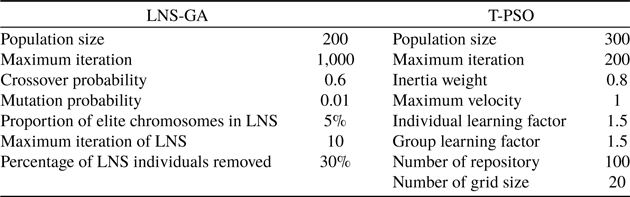
In this subsection, we conduct a comparative analysis between GA [Reference Mirjalili3], LNS-GA [Reference Han, Guo, Li, Zhi and Lv17], PSO [Reference Kennedy and Eberhart5], T-PSO [Reference Daneshjou, Mohammadi-Dehabadi and Bakhtiari21] and FA [Reference Fister, Fister, Yang and Brest4] as benchmark algorithms against EFA. Each algorithm undergoes execution on 10 randomly generated instances to comprehensively assess their optimisation capabilities. The rules for generating orbital elements for each instance are the same as for scenario 1 and scenario 2. Detailed parameters for the compared GA, and PSO algorithms are provided in Table 3, while parameters for the compared LNS-GA and T-PSO algorithms are elucidated in Table 4.
The parameters of the compared GA, PSO

The parameters of the compared LNG-GA, T-PSO

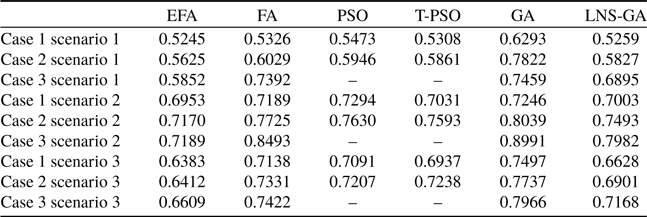
Table 5 presents a comparison of the average cost achieved by various algorithms. In case 1, marked by lower problem complexity, the differences in solutions generated by the three algorithms are subtle. However, in case 3, characterised by higher problem complexity, the EFA proposed herein demonstrates a significantly superior solution quality compared to the other algorithms. Additionally, the average number of iterations failing to meet the constraints provides further insight into the algorithms’ ability to explore a broad solution space, as shown in Table 6. Notably, both PSO and TPSO fail to produce solutions that adhere to the constraints in case 3. The reasons for this outcome will be elaborated upon in the following subsection.
Average cost for different algorithms

Average number of the iterations unsatisfying the constraints for different algorithms

5.4 Hyperparametric sensitivity experiments
In this subsection, we will analyse the effects of the weight parameter
 $\kappa $
and the penalty coefficient
 $\varepsilon $
on the optimisation results, using case 1 of scenario 1 as an example.
We conducted experiments by varying the weight parameter
 $\kappa $
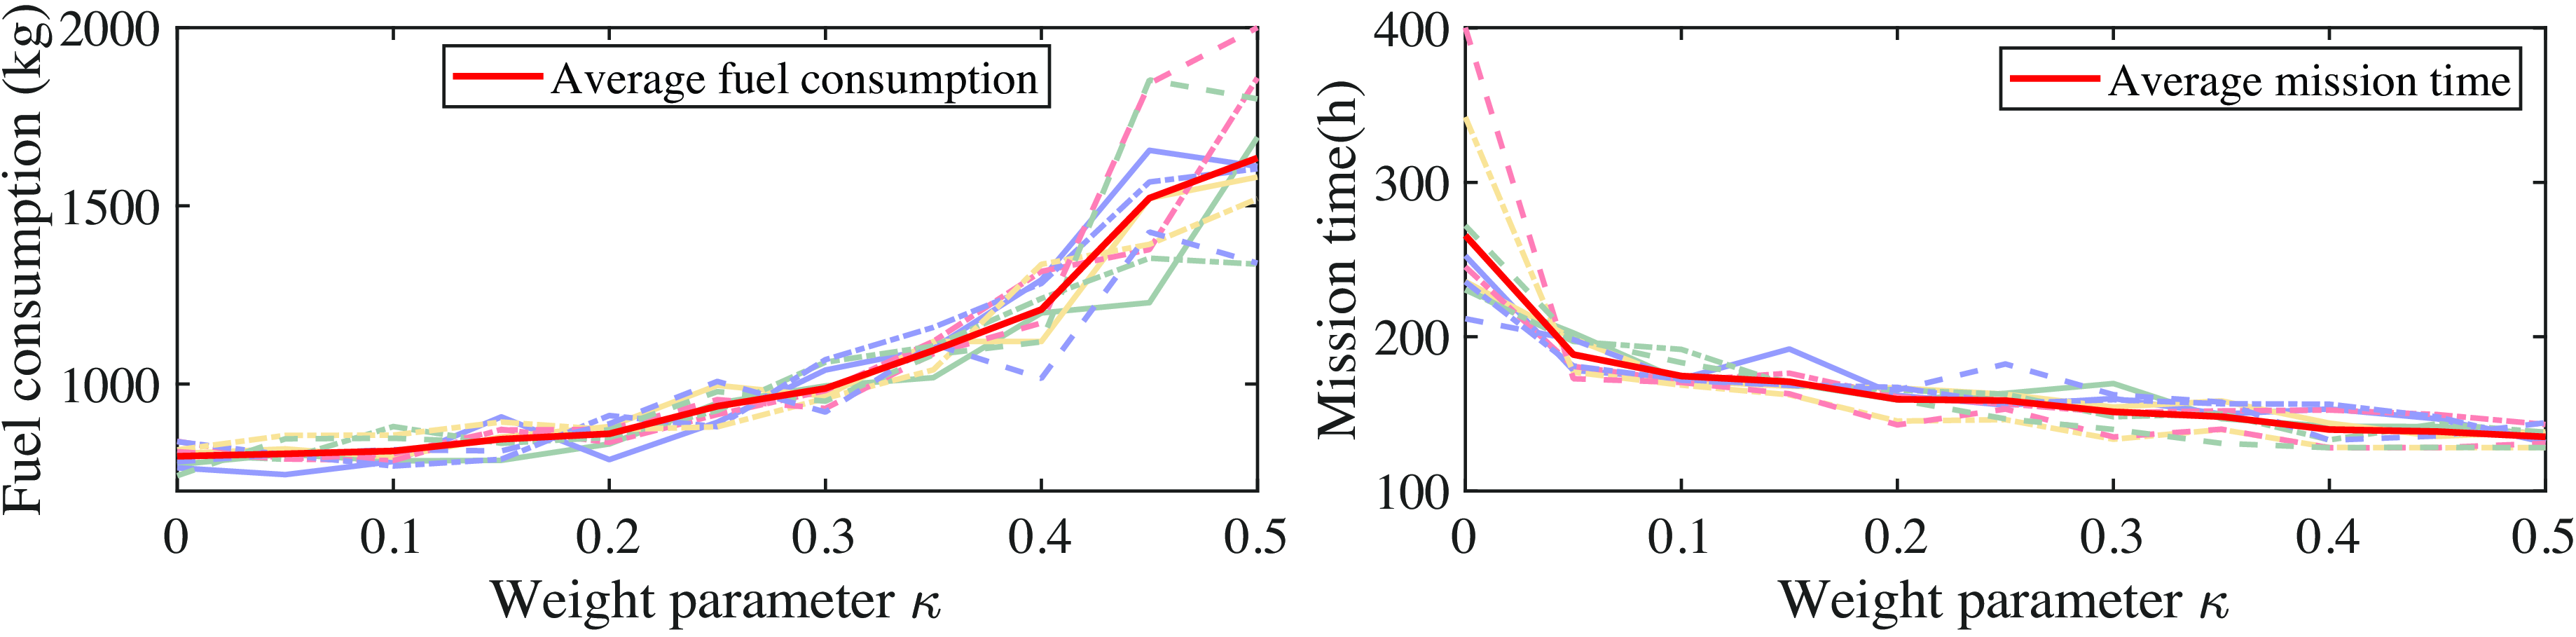
from 0 to 0.5 in intervals of 0.05. To mitigate the impact of random factors, each experiment was repeated 10 times. The experimental results are depicted in Fig. 2, where the dashed curves represent the results of the 10 individual experiments, and the red curve represents the average value across these experiments. As observed, an increase in the weight parameter
 $\kappa $
indicates that the optimisation algorithm is more inclined to select routes that minimise time at the expense of higher fuel consumption.
Optimisation results under different weight parameters
 $\kappa $
.

For a single orbital transfer, it is possible to achieve a more time-efficient and fuel-efficient re-orbiting based on Lambert’s theory. However, as Fig. 2 illustrates, increasing
 $\kappa $
does not necessarily reduce mission time while increasing fuel consumption. Nonetheless, from a broader perspective, by analysing the average data from multiple experiments, we can draw some conclusions. If the priority is to conserve fuel while accepting longer mission durations,
 $\kappa $
should be decreased. Conversely, if a shorter mission time is preferred, even at the cost of higher fuel consumption,
 $\kappa $
should be increased.
We conducted experiments by varying the penalty coefficient
 $\varepsilon $
from 0.2 to 2 in intervals of 0.2. To mitigate the effects of random factors, each experiment was repeated 10 times. The experimental results are displayed in Fig. 3, where the dashed curves represent the results of the 10 individual experiments, and the red curve represents the average value across these experiments. When
 $\varepsilon $
is set to 0.2 and 0.4, the algorithm fails to produce optimisation results that meet the constraints. As
 $\varepsilon $
gradually increases, the optimization algorithm becomes more inclined to generate results that satisfy the constraints. Once
 $\varepsilon $
reaches a certain threshold, the algorithm consistently produces results that almost always satisfy the constraints. Therefore, we recommend choosing a larger value for
 $\varepsilon $
. Given that the objective function is normalised, we have set
 $\varepsilon = 2$
in this study.
Optimisation results under different penalty coefficients
 $\varepsilon $
.

5.5 Discussion of results
Based on the experimental outcomes presented in the preceding subsection, it is clear that in cases with fewer optimisation variables — indicating a reduced number of service satellites — and lower complexity, the differences among the algorithms are minimal. Conversely, in cases of increased complexity, the proposed EFA demonstrates notably superior performance. Below, we provide a detailed analysis of the results for each algorithm.
The particles in PSO possess both velocity and position attributes, granting PSO robust local search capabilities. Consequently, PSO and T-PSO perform well in scenario 1, which is characterised by low model complexity. However, PSO lacks the stochastic elements found in GA, such as mutation and crossover operations, as well as the stochastic term
 $\alpha {\varepsilon _i}$
in FA’s update mechanism. This absence limits PSO’s ability to explore large solution spaces thoroughly. As a result, PSO and T-PSO struggle to generate solutions that adhere to constraints in scenario 3, which is of high complexity. Notably, T-PSO, optimised solely with hyper-parameters, does not significantly enhance PSO’s exploration or local search capabilities, leading to only a modest improvement over PSO.
GA exhibits a strong capacity for exploring expansive solution spaces due to its use of crossover and mutation operations. However, GA is known for its limited local search capabilities and tendency towards premature convergence [Reference Liu, Guo and Weng26]. Although LNS-GA was introduced by [Reference Han, Guo, Li, Zhi and Lv17] to improve GA’s local search performance, this enhancement does not fully address GA’s limitations. Consequently, both GA and LNS-GA underperform relative to FA. Nevertheless, GA’s ability to explore vast solution spaces allows it to find solutions that conform to constraints even in scenario 3, characterised by the highest complexity — unlike PSO, where exploration efforts are insufficient.
In contrast to PSO and GA, FA achieves a better balance between extensive exploration and local search capabilities. The incorporation of PSMS enhances FA’s ability to explore large solution spaces, while DES improves its local search performance, effectively addressing the challenges posed by TRCTSP. Notably, in scenario 3, the EFA demonstrates markedly superior performance compared to other meta-heuristics. We believe that EFA will continue to outperform other algorithms in cases with elevated complexity.
6.0 Conclusion
This article explores the complexities of optimal scheduling for many-to-many on-orbit services, incorporating detailed considerations of variations in target accessibility. In addressing the inherently challenging multi-objective optimal scheduling problem, a paradigm within the NP-hard realm of combinatorial optimisation, we introduce the EFA. The simulation results across various scenarios decisively demonstrate the efficacy and superiority of the proposed algorithm. Future research will focus on refining and advancing intelligent algorithms to tackle the real-time optimal scheduling challenges inherent to on-orbit services.
Acknowledgements
This work was supported in part by the National Natural Science Foundation of China (grant number: 61304108).
Data availability
The data used to support the findings of this study are available from the corresponding author upon request.
Competing interests
The authors declare that they have no known competing financial interests or personal relationships that could have appeared to influence the work reported in this article.
Appendix
A.1 Initial states of targets in the experiments
Initial states of targets for case 1 under scenario 1

Initial states of targets for case 1 under scenario 2

Initial states of targets for case 1 under scenario 3

Initial states of targets for case 2 under scenario 1

Initial states of targets for case 3 under scenario 1

Initial states of targets for case 2 under scenario 2

Initial states of targets for case 3 under scenario 2

Initial states of targets for case 2 under scenario 3

Initial states of targets for case 3 under scenario 3

A.2 Optimisation results
Optimal solution for case 1 under scenario 1

Optimal solution for case 2 under scenario 1

Optimal solution for case 3 under scenario 1

Optimal solution for case 1 under scenario 2

Optimal solution for case 2 under scenario 2

Optimal solution for case 3 under scenario 2

Optimal solution for case 1 under scenario 3

Optimal solution for case 2 under scenario 3

Optimal solution for case 3 under scenario 3

A.3 Orbital element vector of an target after time
${\boldsymbol{\Delta }}t$

Given a target state
 $x\left( {{t_0}} \right)$
at
 ${t_0}$
and a time interval
 ${\Delta}t$
, we can calculate
 $x\left( {{t_0} + {\Delta}t} \right)$
using the following procedure [Reference Curtis27]. Given the known true anomaly
 $\theta \left( {{t_0}} \right)$
at the moment
 ${t_0}$
and the equation
 ${\rm{tan}}\frac{E}{2} = \sqrt {\frac{{1 - e}}{{1 + e}}} {\rm{tan}}\frac{\theta }{2}$
, we can derive the eccentric anomaly
 $E\left( {{t_0}} \right)$
as follows:
 \begin{align} E\left( {{t_0}} \right) = 2{\rm{ta}}{{\rm{n}}^{ - 1}}\left( {\sqrt {\frac{{1 - e}}{{1 + e}}} {\rm{tan}}\frac{{\theta \left( {{t_0}} \right)}}{2}} \right) \end{align}
Following Kepler’s equation, we can express the mean anomaly at the moment
 ${t_0}$
as
 \begin{align} {M_e}\left( {{t_0}} \right) = E\left( {{t_0}} \right) - e{\rm{sin}}E\left( {{t_0}} \right) \end{align}
The period of an elliptical or circular orbit can be represented as
 \begin{align} T = \frac{{2\pi }}{{\sqrt \mu }}{a^{3/2}} \end{align}
where
 $\mu = 398,600\,{\rm km}^{3}/{\rm s}^{2}$
represents the gravitational parameter for earth, and
 $a$
signifies either the semimajor axis of an elliptical orbit or the radius of a circular orbit. Therefore, the mean anomaly at
 ${t_0} + {\Delta}t$
can be expressed as
 \begin{align} {M_e}\left( {{t_0} + {\Delta}t} \right) = {M_e}\left( {{t_0}} \right) + {\Delta}t\frac{{2\pi }}{{\sqrt \mu }}{a^{3/2}} \end{align}
Given
 ${M_e}\left( {{t_0} + {\Delta}t} \right)$
, and relying on the equality
 ${M_e} = E - e{\rm{sin}}E$
, we can employ an iterative method to solve for
 $E\left( {{t_0} + {\Delta}t} \right)$
. Ultimately, we can determine
 $\theta \left( {{t_0} + {\Delta}t} \right)$
from equation
 ${\rm{tan}}\frac{E}{2} = \sqrt {\frac{{1 - e}}{{1 + e}}} {\rm{tan}}\frac{\theta }{2}$
as follows:
 \begin{align} \theta \left( {{t_0} + {\Delta}t} \right) = 2{\rm{ta}}{{\rm{n}}^{ - 1}}\left( {\sqrt {\frac{{1 + e}}{{1 - e}}} {\rm{tan}}\frac{{E\left( {{t_0} + {\Delta}t} \right)}}{2}} \right) \end{align}
The equation above necessitates that no manoeuvers take place within the Keplerian orbit, ensuring that no orbital elements other than the true anomaly undergo changes. We denote the functional relationship between
 $x\left( {{t_0}} \right)$
and
 $x\left( {{t_0} + {\Delta}t} \right)$
as
 \begin{align} x\left( {{t_0} + {\Delta}t} \right) = {\mathcal G}\left( {x\left( {{t_0}} \right),{\Delta}t} \right) \end{align}
A.4 Lambert-based manoeuver
Provided with the initial position vector
 ${\boldsymbol{{r}}_1}$
, final position vector
 ${\boldsymbol{{r}}_2}$
, and the transfer time
 ${\Delta}t$
of the transfer orbit, the necessary velocity changes for the two manoeuvers can be computed using the following procedure [Reference Curtis27].
With knowledge of
 ${\boldsymbol{{r}}_1}$
and
 ${\boldsymbol{{r}}_2}$
, the change in the true anomaly
 ${\Delta}\theta $
formed by the initial and final position vectors on the transfer orbit satisfies
 ${\rm{cos\Delta }}\theta = \frac{{\boldsymbol{{r}}_1} \cdot {\boldsymbol{{r}}_2}}{{r_1}{r_2}}$
, where
 ${r_1}$
and
 ${r_2}$
represent the magnitudes of
 ${\boldsymbol{{r}}_1}$
and
 ${\boldsymbol{{r}}_2}$
, respectively. Two scenarios must be taken into account: prograde trajectories (
 ${0^ \circ } \lt i \lt {90^ \circ }$
) and retrograde trajectories (
 ${90^ \circ } \lt i \lt {180^ \circ }$
), where
 $i$
denotes the inclination of the transfer orbit. Hence, the solution for
 ${\Delta}\theta $
can be formulated as
 \begin{align} \Delta \theta=\left\{\begin{array}{l@{\quad}l@{\quad}l} \cos ^{-1}\left(\frac{\boldsymbol{{r}}_1 \cdot \boldsymbol{{r}}_2}{r_1 r_2}\right) & \text { if } \sin \Delta \theta \cos i \geq 0 &\text { prograde}\\ 360^{\circ}-\cos ^{-1}\left(\frac{\boldsymbol{{r}}_1 \cdot \boldsymbol{{r}}_2}{r_1 r_2}\right) & \text { if }\sin \Delta \theta \cos i \lt 0 &\text { prograde}\\ \cos ^{-1}\left(\frac{\boldsymbol{{r}}_1 \cdot \boldsymbol{{r}}_2}{r_1 r_2}\right) & \text { if }\sin \Delta \theta \cos i \lt 0&\text { retrograde} \\ 360^{\circ}-\cos ^{-1}\left(\frac{\boldsymbol{{r}}_1 \cdot \boldsymbol{{r}}_2}{r_1 r_2}\right) & \text { if }\sin \Delta \theta \cos i \geq 0 &\text { retrograde} \end{array}\right.\end{align}
By defining the velocity vectors at the initial and final positions on the transfer orbit as
 ${\boldsymbol{{v}}_1}$
and
 ${\boldsymbol{{v}}_2}$
, respectively, the following relationship holds:
 \begin{align} \boldsymbol{{r}}_2 & = f \boldsymbol{{r}}_1+g \boldsymbol{{v}}_1 \nonumber \\[3pt] \boldsymbol{{v}}_2 & = \dot{f} \boldsymbol{{r}}_1+\dot{g} \boldsymbol{{v}}_1 \end{align}
where Lagrange coefficients
 $f,g$
and their derivatives
 $\dot f,\dot g$
are given by
 \begin{align} \begin{array}{*{20}{l}}{} {f = 1 - \frac{{{\chi ^2}}}{{{r_1}}}C\left( z \right)}\\[3pt] {} {g = {\Delta}t - \frac{1}{{\sqrt \mu }}{\chi ^3}S\left( z \right)}\\[3pt] {} {\dot f = \frac{{\sqrt \mu }}{{{r_1}{r_2}}}\chi \left( {zS\left( z \right) - 1} \right)}\\[3pt] {} {\dot g = 1 - \frac{{{\chi ^2}}}{{{r_2}}}C\left( z \right)}\end{array} \end{align}
In the equations above,
 $z$
is represented as
 $z = \alpha {\chi ^2}$
, where
 $\alpha $
and
 $\chi $
denote the reciprocal of the semimajor axis and the universal anomaly of the transfer orbit, respectively. The Stumpff function
 $S\left( z \right)$
and
 $C\left( z \right)$
are defined as
 \begin{align} S\left( z \right) = \left\{ {\begin{array}{*{20}{l}}{\frac{{\sqrt z - {\rm{sin}}\sqrt z }}{{{{(\sqrt z )}^3}}}} {(z \gt 0)}\\[3pt] {\frac{{{\rm{sinh}}\sqrt { - z} - \sqrt { - z} }}{{{{(\sqrt z )}^3}}}} {(z \lt 0)}\\[3pt] {\frac{1}{6}} {\left( {z = 0} \right)}\end{array},{\rm{\;\;\;\;}}C\left( z \right) = \left\{ {\begin{array}{*{20}{l}}{\frac{{1 - {\rm{cos}}\sqrt z }}{z}} {(z \gt 0)}\\[3pt] {\frac{{{\rm{cosh}}\sqrt { - z} - 1}}{{ - z}}} {(z \lt 0)}\\[3pt] {\frac{1}{2}} {\left( {z = 0} \right)}\end{array}} \right.} \right. \end{align}
To determine
 ${\boldsymbol{{v}}_1}$
and
 ${\boldsymbol{{v}}_2}$
, it is essential to calculate the unknown variables
 $z$
and
 $\chi $
in (A9). This have been previously solved in the Ref. [Reference Curtis27] using analytical relationships related to orbital mechanics and recursive methods. Their derivation will not be reiterated here. Given
 ${\boldsymbol{{r}}_1}$
,
 ${\boldsymbol{{r}}_2}$
, and
 ${\Delta}t$
, Lambert’s theorem is applied to determine
 ${\boldsymbol{{v}}_1}$
and
 ${\boldsymbol{{v}}_2}$
. This functional relationship is expressed as:
 \begin{align} {\boldsymbol{{v}}_1} = {{\mathcal{L}}_1}\left( {{\boldsymbol{{r}}_1},{\boldsymbol{{r}}_2},{\Delta}t} \right),{\boldsymbol{{v}}_2} = {{\mathcal{L}}_2}\left( {{\boldsymbol{{r}}_1},{\boldsymbol{{r}}_2},{\Delta}t} \right) \end{align}