



Introduction
In recent years, ultrawideband (UWB) antennas have been widely used in high-speed wireless communication, penetrating radar, precise positioning, and medical imaging due to their ultrawide operating bandwidth, strong penetrability, and compact size. UWB antennas with excellent ultraband impedance matching, stable radiation pattern, high gain, high directionality, and simple structure are required for the above applications.
The Vivaldi antenna (VA), first introduced by Gibson in 1979 [Reference Gibson1], is a classic UWB antenna with the advantages of high directionality, low profile, symmetric radiation pattern, and ease of fabrication. However, most of the traditional VAs have a large electrical size, which is not suitable for low-frequency applications. Additionally, the maximum operating frequency of traditional VA is limited by its Balun structure, resulting in poor high-frequency performance. Then, the antipodal Vivaldi antenna (AVA) has been proposed by Gazit in 1988 for bandwidth improvement [Reference Gazit2], which placed the radiation fins on top and bottom sides of the substrate separately, and adopted a microstrip line to a parallel transmission line as a feed structure instead of a Balun to achieve an extremely UWB operating frequency band.
On this basis, various techniques have been proposed to further enhance the radiation characteristics and expand the operating bandwidth of AVA. Curved shape and multiple planar choke slot edges are applied to the outer side of both radiation fins to extend the surface current path; therefore, the low-end radiation characteristic is improved [Reference Shen, Yang, Xia, Wan and Kang3–Reference De, Das and Kundu8]. Moreover, dual-slot structure is widely introduced to suppress side lobes and reduce cross polarization [Reference Nie, Shen, Zhang and Liu9, Reference Jiang, Yan, Wang, Bi and Meng10], but this structure suffers from a relatively large size and requires an additional power divider. Also, balanced AVA with three metal layers and two dielectric layers is proposed for lower cross polarization [Reference Langley, Hall and Newham11–Reference Mahalingam, Ruth Jency, Ramasamy and Ko13], but it has a complex structure and an unstable radiation pattern at high frequencies. Additionally, metal patches, metasurfaces, or dielectric lenses are loaded along the normal direction as directors to improve radiation directionality and enhance the main lobe gain [Reference Wang, Xu, Sun, Wang and Wang14–Reference Das, Clavin, Debbarma, Sharma, Lambert and Hobart18]. However, these directors result in a larger length and a distorted radiation pattern at high frequencies. Besides, an all-metal AVA has been proposed for high-power microwave applications, but related research is limited to relatively narrow bandwidth and low gain [Reference Chen, Yin, Jiang, Mao, Lv, Jiang and Liu19]. Furthermore, various methods such as metasurface, characteristic mode analysis, and antenna mode scattering field manipulation are introduced to achieve broadband Radar Cross Section (RCS) reduction of AVA [Reference Das, Kundu and Kumar20–Reference Zhao, Jiang, Hu and Gao22], but these structures lose the advantage of AVA’s low profile. In summary, the above methods cannot achieve a balance between UWB, high gain, and miniaturization in AVA.
In this paper, a compact AVA with improved radiation performance is proposed. This AVA exhibits UWB and high gain in a relatively small size, which is achieved by employing a comb-like radiation fin with four gradual partially elliptical slots in its outer side, and loading a clover-shaped director composed of three elliptical parasitic patches. This paper is organized as follows. In the ‘Antenna design and principle’ section, the structure, principle, and characteristics of the designed AVA are introduced in detail. In the ‘Experiment verification’ section, the simulated performances along with the measured results are compared and explicated. Finally, the ‘Conclusion’ section concludes the paper.
Antenna design and principle
The configuration of the proposed antenna is shown in Figure 1, which is composed of two layers of metal and a dielectric substrate (Rogers AD255A: ε r = 2.55, tanδ = 0.0018, thickness = 1 mm). The shape of the dielectric substrate is a rectangle with elliptical protrusions, as shown in Figure 1(a). The top layer metal is a comb-like radiation fin with a microstrip line, while the bottom layer is composed of the same radiation fin with a gradient grounding line and a clover-shaped director.
Geometry of the proposed AVA. (a) Top layer view (left) and bottom layer view (right). (b) Side view. (c) Comb-like radiation fin. (d) Clover-shaped director.

Figure 1 Long description
The image A showing two plan views with a legend at the right listing Top radiation fin, Microstrip line, Bottom radiation fin, Gradient grounding line, Director and Substrate. In the left plan view, a substrate outline contains a vertical microstrip line that runs upward from a small rectangular feed region near the bottom edge and meets a larger fin-shaped region. Dimension markers label L along the left side and W along the bottom and additional width markers label Wa near the top and Wb near the bottom. Coordinate labels x1 comma y1 appear near the lower left of the fin region and x2 comma y2 appear near the upper right of the fin region. In the right plan view, a fin-shaped region is shown beside a curved boundary labeled Exponential curve, with a director shape placed near the fin. A horizontal dimension marker at the bottom labels Wg and a vertical dimension marker near the lower right labels Lg. Coordinate labels x1 comma y1 appear near the lower left of the fin region and x2 comma y2 appear near the upper right of the fin region. The image B showing a side view with stacked labeled layers and features: Microstrip line is labeled along the upper line, top radiation fin is labeled along the upper fin region, Side feed is labeled at the left, Gradient grounding line is labeled along a lower line, Bottom radiation fin is labeled along a lower fin region and Clover-shaped director is labeled beneath the lower fin region. The image C showing an isolated comb-like fin profile with five repeated tooth-like sections, with labels S1, S2, S3, S4 and S5 placed along the fin and labels P1, P2, P3, P4 and P5 placed to the right of the corresponding sections. The image D showing an isolated clover-shaped director made of multiple narrow lobes, with labels L1, L2, L3, L4 and L5 placed along the lobes. Across the four images, the figure defines a parameterized antenna geometry by naming the conductive fin shapes, the microstrip line and side feed connection, the gradient grounding line, the director shape and the dimension parameters L, W, Wa, Wb, Wg, Lg and the coordinate points x1 comma y1 and x2 comma y2, without any numeric values or units shown.
Here, the inner side shape of both comb-like radiation fins is an exponential curve, while the outer side is the comb-like structure that consists of four gradual partially elliptical slots, as shown in Figure 1(c). The clover-shaped director is composed of three elliptical parasitic patches, as shown in Figure 1(d).
The exponential curve equation of both radiation fins is as follows:
 \begin{equation}y = \pm \left( {{C_1}{e^{Rx}} + {C_2}} \right).\end{equation}
Here,
 \begin{equation}{C_1} = \left( {{y_2}-{y_1}} \right)/\left( {{e^{Rx}}^2-{e^{Rx}}^1} \right),\end{equation}
 \begin{equation}{C_2} = \left( {{y_1}{e^{Rx}}^2-{y_2}{e^{Rx}}^1} \right)/\left( {{e^{Rx}}^2-{e^{Rx}}^1} \right),\end{equation}
where (x 1, y 1) and (x 2, y 2) are the start and end points of the curve, respectively, and R is the curvature.
When AVA works, surface waves propagate along the exponential gradient slot line. During its propagation process, when the slot line opening is small, the electromagnetic wave energy is confined between the metal patches, resulting in weaker radiation. When the current is transmitted to a larger opening, the metal’s ability to confine the electric field weakens, thus the energy radiates into free space. Since AVA’s exponential gradient slot line opening starts from exactly zero, in theory, it has an infinitely high operating frequency. In practice, the high-frequency gain attenuation caused by non-uniform phase limits its maximum operating frequency. On the other hand, the maximum width of the traditional AVA slot line opening determines its minimum operating frequency, and the physical size limitation makes it difficult to extend its operating frequency to lower frequencies.
In order to improve the gain and expand the low-frequency bandwidth, a comb-like structure consisting of four gradual partially elliptical slots is introduced to the outer side of both radiation fins to expand the surface current path and reduce reverse current. Besides, a clover-shaped director is loaded along the radiation direction to further enhance the gain. The initial AVA, the AVA with comb-like radiation fins, and the AVA with comb-like radiation fins and clover-shaped director (the AVA proposed in this paper) were sequentially displayed in Figure 2(a–c). The curvature and overall width and length of the initial AVA have a significant impact on its broadband impedance matching performance, as shown in Figure 3. By parameter optimetric in High Frequency Structure Simulator (HFSS), the size and shape of the initial AVA have been adjusted to achieve the best impedance matching.
Comparison of surface current distribution of AVA at 5 GHz. (a) Conventional AVA (initial AVA). (b) AVA with comb-like radiation fins. (c) AVA with comb-like radiation fins and a clover-shaped director (the designed AVA). (d) 3D radiation pattern of the designed AVA at 20 GHz.

Figure 2 Long description
The image consists of four parts. The first three parts, labeled as (a), (b) and (c), depict the surface current distribution of an AVA at 5 GHz. Each part shows a different configuration. In (a), the conventional AVA is illustrated with red lines indicating inner current, green lines for outer current and yellow lines for reverse current. In (b), the AVA with comb-like radiation fins is shown, maintaining the same color coding for the currents. In (c), the AVA with comb-like radiation fins and a clover-shaped director is presented, again using the same color scheme. The currents are represented by arrows and the intensity is indicated by a color scale on the left, ranging from blue for lower values to red for higher values, measured in amperes per meter. The fourth part, labeled (d), displays a 3D radiation pattern of the designed AVA at 20 GHz, with an axis indicating the x, y and z directions.
Parameter analysis of the influence of the initial antenna’s shape and size on UWB impedance matching and gain. (a) r. (b) L a.

Figure 3 Long description
Image A shows a multi-line graph comparing S11 in decibels versus frequency in gigahertz for three values of parameter r. The x-axis is labeled Frequency (GHz) and ranges from 2 to 48. The y-axis is labeled S11 (dB) and ranges from 0 to minus 40. Three lines represent r equals 0.04, r equals 0.05 and r equals 0.06, each shown with a distinct line style. All three lines show fluctuating S11 values across the frequency band with multiple notches. The line for r equals 0.04 shows deeper notches at several points across the band, reaching approximately minus 35 decibels near 10 GHz and again near 30 GHz. The line for r equals 0.06 shows shallower and narrower notches across most of the band. The line for r equals 0.05 falls between the other two in terms of notch depth and width. The three lines converge near 2 GHz and diverge progressively as frequency increases toward 48 GHz. Key approximate coordinate pairs for r equals 0.04 include (10, minus 35), (20, minus 20), (30, minus 33), (40, minus 18). For r equals 0.05: (10, minus 28), (20, minus 18), (30, minus 25), (40, minus 15). For r equals 0.06: (10, minus 22), (20, minus 15), (30, minus 20), (40, minus 12). Image B shows a multi-line graph comparing gain in decibels versus frequency in gigahertz for three values of parameter L. The x-axis is labeled Frequency (GHz) and ranges from 2 to 48. The y-axis is labeled Gain (dBi) and ranges from 0 to 14. Three lines represent L equals 91 mm, L equals 97 mm and L equals 94 mm, each shown with a distinct line style. All three lines start near 0 decibels at 2 GHz, rise gradually toward a broad peak region between approximately 20 and 35 GHz, then decline toward 48 GHz. The line for L equals 91 mm reaches the highest peak of approximately 13 decibels near 28 GHz. The line for L equals 97 mm reaches a peak of approximately 11 decibels near 25 GHz. The line for L equals 94 mm peaks at approximately 12 decibels near 27 GHz. The three lines are closely spaced across most of the band but diverge most noticeably between 20 and 40 GHz. Key approximate coordinate pairs for L equals 91 mm include (2, 1), (10, 7), (20, 11), (28, 13), (40, 9), (48, 7). For L equals 97 mm: (2, 1), (10, 6), (20, 10), (25, 11), (40, 8), (48, 6). For L equals 94 mm: (2, 1), (10, 7), (20, 11), (27, 12), (40, 9), (48, 7).
Figure 4 shows the comparison of simulation results between conventional AVA (initial AVA) and the proposed one. The detailed structural dimensions of the proposed AVA are given inTable 1.
Compared the simulated results of conventional AVA and the designed AVA. (a) Reflection coefficient (|S 11|). (b) Gain ( ${{\varphi }} = 0^\circ $,
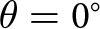 ${{\theta }} = 0^\circ $).

Figure 4 Long description
The image A showing a multi-line graph with the vertical axis label “|S11| (dB)” and the horizontal axis label “Frequency (GHz)”. The horizontal axis range is 0 to 48 gigahertz. The vertical axis range is 0 to negative 40 decibel. A legend lists two series: “Conv. AVA” and “proposed AVA”. The two series are distinguished by different line colors. The plotted lines show repeated narrow dips across much of the frequency range. The “proposed AVA” line shows deeper dips than the “Conv. AVA” line across many frequencies, with multiple dips reaching near negative 40 decibel. The “Conv. AVA” line shows dips that are generally not as deep, with many dips staying above about negative 30 decibel. Exact coordinate pairs are not readable from the image. The image B showing a multi-line graph with the vertical axis label “Gain (dBi)” and the horizontal axis label “Frequency (GHz)”. The horizontal axis range is 0 to 48 gigahertz. The vertical axis range is 0 to 15 decibel isotropic. A legend lists two series: “Conv. AVA” and “proposed AVA”. The two series are distinguished by different line colors. A numeric annotation “13.7” is shown near the upper right of the plot area. The “Conv. AVA” line rises from near 0 decibel isotropic at low frequency to a broad high region around 10 to 13 decibel isotropic through mid frequencies, then declines toward lower values by 48 gigahertz. The “proposed AVA” line follows a similar rise and fall pattern and stays above the “Conv. AVA” line across most of the frequency range, with the highest visible gain near the annotated value 13.7. Exact coordinate pairs are not readable from the image.
Dimensions of the proposed antenna (unit: mm)

Table 1 Long description
The table lists millimeter dimensions for a proposed antenna, covering overall size, feed or slot widths, lengths, angles, and several paired pitch and spacing values. The main body measures 52 mm in width and 102 mm in length, with La at 94 mm and Wd at 40 mm; Wg is 30 mm and W1 is 1.4 mm. Additional feature sizes include L1 at 20 mm, W2 at 1.2 mm, and L2 at 15 mm, with an angle alpha of 9 degrees. Four pitch values increase from 3 to 4 mm across P1 through P4, indicating a stepwise growth in that parameter set. Each corresponding spacing value S1 through S4 is defined as a scaled version of its matching pitch using a fixed aspect ratio factor, so the spacings rise in proportion to the pitches rather than being listed as standalone numbers. The final row gives Ws at 3.1 mm, Ls at 15 mm, and a small radius R of 0.05 mm. Because several spacing entries depend on the chosen aspect ratio factor, their exact numeric values require that factor to be applied consistently.
Note: Here, k is the aspect ratio of elliptical slots in radiation fins, and the value selected in this paper is 2.65.
Technique for end-fire performance improvement based on comb-like radiation fins
AVA is a typical end-fire antenna, which has an electrical size of 0.5λ L to 2λ L (λ L is the wavelength at the lowest operating frequency) and a gain proportional to its length. In order to expand the low-end bandwidth of the proposed AVA, a couple of modified comb-like radiation fins with four gradual partially elliptical slots are applied. The detailed shape of the comb-like radiation fins is shown in Figure 1(c).
The operation principles of extending the low-frequency bandwidth of comb-like radiation fins are presented as follows. First, Figure 2(a) and (b) shows the comparison of surface current distribution between conventional AVA and the AVA with the comb-like radiation fins. It can be seen that comb-like radiation fins could turn the outer current to flow along the edge of those slots, thereby increasing the effective path length of the surface current, which is equivalent to increasing the electrical length of the antenna at the same physical size. The number of elliptical slots is modeled in Figure 5(a) and (b). It can be seen that too small number of slots causes insufficient extension to the surface current path, resulting in less expansion of the frequency band. While a large number could expand the bandwidth slightly more, the gain at lower frequencies is too poor with the limited overall size. So it is meaningless to have more than four slots. Moreover, the aspect ratio of slots is discussed in Figure 6(a) and (b). It indicates that too small slots have limited bandwidth expansion and gain improvement, while oversized slots can cause the antenna to malfunction in some frequency bands. By parameter optimetric in HFSS, the shape and size of the comb-like radiation fins are adjusted to maximize the reduction of the lowest operating frequency. According to the simulation results, the slots achieve the maximum improvement in frequency band and gain with k = 2.65.
Compared the simulated results of conventional AVA and AVA with different comb-like radiation fins (with different numbers of slots) in low frequencies. (a) Reflection coefficient (|S 11|). (b) Gain (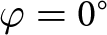 ${{\varphi }} = 0^\circ $,
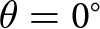 ${{\theta }} = 0^\circ $).

Figure 5 Long description
The image A showing a line graph with four curves and a legend listing: Conv. AVA, Three slots, Five slots, Four slots. The x-axis is labeled Frequency (Gigahertz), with tick labels 0, 1, 2, 3, 4, 5, 6, 7. The y-axis is labeled vertical bar S11 vertical bar (decibel), with tick labels 0, minus 10, minus 20, minus 30, minus 40. Two vertical dashed guide lines are drawn at 2.2 and 3.1 on the frequency axis. The four curves show multiple dips across the frequency range. The Conv. AVA curve has a deep dip near about 1.0 Gigahertz reaching close to minus 40 decibel, then rises and shows additional dips around about 3.0 Gigahertz, about 4.0 Gigahertz and about 6.0 Gigahertz. The Three slots curve has a deep dip near about 1.0 Gigahertz reaching close to minus 40 decibel, then shows dips around about 3.0 Gigahertz, about 4.0 Gigahertz and about 6.0 Gigahertz. The Five slots curve has a deep dip near about 1.0 Gigahertz reaching close to minus 40 decibel, then shows dips around about 3.0 Gigahertz, about 4.0 Gigahertz and about 6.0 Gigahertz. The Four slots curve has a deep dip near about 1.0 Gigahertz reaching close to minus 40 decibel, then shows dips around about 3.0 Gigahertz, about 4.0 Gigahertz and about 6.0 Gigahertz. The image B showing a line graph with four curves and a legend listing: Conv. AVA, Three slots, Five slots, Four slots. The x-axis is labeled Frequency (Gigahertz), with tick labels 0, 1, 2, 3, 4, 5, 6, 7. The y-axis is labeled Gain (decibel), with tick labels 0, 2, 4, 6, 8, 10. Two vertical dashed guide lines are drawn at 2.2 and 3.1 on the frequency axis. All four curves rise with frequency. Near 1 Gigahertz, the curves are near 0 to about 1 decibel. Around 2.2 Gigahertz, the curves are around about 2 to 4 decibel depending on the series. Around 3.1 Gigahertz, the curves are around about 4 to 6 decibel depending on the series. From about 5 to 7 Gigahertz, the curves approach about 9 to 10 decibel and are close to each other near the upper end of the axis.
Compared the simulated results of conventional AVA and AVA with different comb-like radiation fins (with different k) in low frequencies. (a) Reflection coefficient (|S 11|). (b) Gain (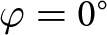 ${{\varphi }} = 0^\circ $,
 ${{\theta }} = 0^\circ $).

Figure 6 Long description
Two sub-images are present. The image A showing a line graph. The x-axis label is Frequency (Gigahertz). The x-axis ranges from 1 to 7 with tick labels at 1, 2, 3, 4, 5, 6 and 7. The y-axis label is vertical bar S subscript 11 vertical bar (decibel). The y-axis ranges from 0 to minus 40 with tick labels at 0, minus 10, minus 20, minus 30 and minus 40. A legend lists four curves: Conv. AVA, k equals 2.5, k equals 2.8 and k equals 2.65. Two vertical dashed reference lines are drawn at x equals 2.2 and x equals 3.1. The Conv. AVA curve starts near 0 decibel at about 1 Gigahertz, drops below minus 10 decibel between about 2 and 3 Gigahertz, rises toward about minus 5 to minus 10 decibel near about 3.5 to 4 Gigahertz, then shows further dips and rises between about 4 and 7 Gigahertz, ending near about minus 10 decibel at 7 Gigahertz. The k equals 2.5 curve starts near 0 decibel at about 1 Gigahertz, drops below minus 10 decibel around the 2 to 3 Gigahertz region, then oscillates with multiple dips between about 3 and 7 Gigahertz, ending near about minus 10 decibel at 7 Gigahertz. The k equals 2.8 curve starts near 0 decibel at about 1 Gigahertz, drops below minus 10 decibel around the 2 to 3 Gigahertz region, then oscillates with dips between about 3 and 7 Gigahertz, ending near about minus 10 decibel at 7 Gigahertz. The k equals 2.65 curve starts near 0 decibel at about 1 Gigahertz, drops below minus 10 decibel around the 2 to 3 Gigahertz region, then oscillates with dips between about 3 and 7 Gigahertz, ending near about minus 10 decibel at 7 Gigahertz. The image B showing a line graph. The x-axis label is Frequency (Gigahertz). The x-axis ranges from 1 to 7 with tick labels at 1, 2, 3, 4, 5, 6 and 7. The y-axis label is Gain (decibel). The y-axis ranges from 0 to 10 with tick labels at 0, 2, 4, 6, 8 and 10. A legend lists four curves: Conv. AVA, k equals 2.5, k equals 2.8 and k equals 2.65. A vertical dashed reference line is drawn at x equals 2.2. All four curves rise from low gain near 1 Gigahertz toward higher gain at 7 Gigahertz. The Conv. AVA curve increases gradually from near 0 at about 1 Gigahertz to near 9 to 10 at about 7 Gigahertz. The k equals 2.5 curve rises from near 0 at about 1 Gigahertz, increases more steeply through about 2 to 4 Gigahertz and approaches near 9 to 10 by about 7 Gigahertz. The k equals 2.8 curve rises from near 0 at about 1 Gigahertz, increases through about 2 to 5 Gigahertz and approaches near 9 to 10 by about 7 Gigahertz. The k equals 2.65 curve rises from near 0 at about 1 Gigahertz, increases through about 2 to 5 Gigahertz and approaches near 9 to 10 by about 7 Gigahertz.
Finally, it can be concluded from Figure 4(a) that the designed comb-like radiation fins could expand the low-frequency bandwidth by 900 MHz, and raise the relative bandwidth from 175% to 183%.
In addition to increasing the equivalent electrical length, it is found that the comb-like radiation fins could also improve the gain of the antenna slightly, especially at low frequencies. The above phenomenon is analyzed based on surface current distribution, and the following explanation is proposed: a longer current path could attenuate more surface current, preventing it from flowing back at the end of radiation fins, thereby reducing reverse current and enhancing the gain. Figure 2(a) and (b) also show the comparison of reverse current between conventional AVA and the AVA with the comb-like radiation fins. It can be seen that the reverse current is reduced with the usage of comb-like radiation fins, which is consistent with the above theory. It is well known that low-frequency currents decay more slowly, making it easier to generate reverse currents. Therefore, comb-like radiation fins improve the low-frequency gain more obviously. According to Figure 5(b), the designed comb-like radiation fins could improve the gain by about 2.0 dBi from 2.2 to 7.0 GHz.
Technique for further gain enhancement based on a clover-shaped director
To further enhance the main lobe gain and reduce the side lobes of proposed antenna, a clover-shaped director composed of three elliptical parasitic patches is introduced along the radiation direction. The detailed geometry of the clover-shaped director is shown in Figure 1(d).
Figure 2(b) and (c) shows the comparison of surface current distribution between AVA with and without the clover-shaped director. It can be seen that the director could turn the surface current at the end of the radiation fins toward the center, and reduce the current flowing in the other direction, therefore enhancing the main lobe gain and reducing the side lobes. There is a large angle between a director composed of a single patch and the inner curve of the radiation fins, which results in weak coupling to current. Therefore, it is only effective in some frequency bands, and the gain improvement is not significant. The clover-shaped director achieves better coupling to the current by introducing two additional symmetrical patches along the inner curve direction of the radiating fins, achieving a more significant gain enhancement, as shown in Figure 7(a). It is widely known that AVAs commonly suffer from the problem of main lobe splitting when operating at high frequencies; therefore, the gain improvement by the clover-shaped director is particularly significant at high frequencies.
Compared the simulated results of AVAs with different parasitic structures. (a) Gain (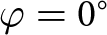 ${{\varphi }} = 0^\circ $,
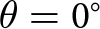 ${{\theta }} = 0^\circ $). (b) Radiation pattern at 35 GHz.

Figure 7 Long description
The first plot shows gain versus frequency for different antenna configurations. The x-axis is labeled ′Frequency (GHz)′ ranging from 2 to 48. The y-axis is labeled ′Gain (dBi)′ ranging from -5 to 15. Configurations include conventional AVA, comb-like radiation fins, single patch director and clover-shaped director. The clover-shaped director shows the highest peak gain around 38 GHz. The second plot shows gain versus theta. The x-axis is labeled ′Theta (degree)′ ranging from -180 to 180. The y-axis is labeled ′Gain (dBi)′ ranging from -20 to 20. The clover-shaped director configuration shows a broader main lobe and reduced side lobes compared to others.
The angle between the center patch and the side patches (α) has an impact on the gain, as shown in Figure 8(a). If α is too large, it will lead to an increase in side lobe gain and a decrease in the effect of improving the main lobe gain. If α is too small, it will reduce the coupling between the patches and the radiation fins, which also results in a decrease in gain improvement. In addition, the specific size of each patch has a slight impact on the gain, as shown in Figure 8(b) and (e). By parameter optimetric in HFSS, the curvature and location of three ellipse patches have been adjusted to achieve the best gain enhancement.
Parameter analysis of the influence of the clover-shaped director’s shape and size on gain. (a) α. (b) L 1. (c) L 2. (d) W 1. (e) W 2.

Figure 8 Long description
The image A showing a line graph with the y-axis labeled Gain (dBi) and the x-axis labeled Frequency (GHz). The x-axis shows 2, 10, 20, 30, 40, 48. The y-axis shows 2, 4, 6, 8, 10, 12, 14. Three curves are shown with legend entries alpha equals 10.0 degree, alpha equals 9.0 degree and alpha equals 9.5 degree. All three curves rise from about 2 dBi near 2 GHz to about 12 to 13 dBi around 10 to 20 GHz, then fluctuate around about 10 to 13 dBi through about 30 GHz and then trend downward with fluctuations toward about 8 to 10 dBi by about 48 GHz. The image B showing a line graph with the y-axis labeled Gain (dBi) and the x-axis labeled Frequency (GHz). The x-axis shows 2, 10, 20, 30, 40, 48. The y-axis shows 2, 4, 6, 8, 10, 12, 14. Three curves are shown with legend entries L1 equals 18 millimeter, L1 equals 19 millimeter and L1 equals 20 millimeter. The curves rise from about 2 dBi near 2 GHz to about 12 to 13 dBi around 10 to 20 GHz, then fluctuate around about 10 to 13 dBi through about 30 GHz and then decrease with fluctuations toward about 8 to 10 dBi by about 48 GHz. The image C showing a line graph with the y-axis labeled Gain (dBi) and the x-axis labeled Frequency (GHz). The x-axis shows 2, 10, 20, 30, 40, 48. The y-axis shows 2, 4, 6, 8, 10, 12, 14. Three curves are shown with legend entries L2 equals 14 millimeter, L2 equals 16 millimeter and L2 equals 15 millimeter. The curves rise from about 2 dBi near 2 GHz to about 12 to 13 dBi around 10 to 20 GHz, then fluctuate around about 10 to 13 dBi through about 30 GHz and then decrease with fluctuations toward about 8 to 10 dBi by about 48 GHz. The image D showing a line graph with the y-axis labeled Gain (dBi) and the x-axis labeled Frequency (GHz). The x-axis shows 2, 10, 20, 30, 40, 48. The y-axis shows 2, 4, 6, 8, 10, 12, 14. Three curves are shown with legend entries W1 equals 1.2, W1 equals 1.3 and W1 equals 1.4. The curves rise from about 2 dBi near 2 GHz to about 12 to 13 dBi around 10 to 20 GHz, then fluctuate around about 10 to 13 dBi through about 30 GHz and then decrease with fluctuations toward about 8 to 10 dBi by about 48 GHz. The image E showing a line graph with the y-axis labeled Gain (dBi) and the x-axis labeled Frequency (GHz). The x-axis shows 2, 10, 20, 30, 40, 48. The y-axis shows 2, 4, 6, 8, 10, 12, 14. Three curves are shown with legend entries W2 equals 1.0 millimeter, W2 equals 1.4 millimeter and W2 equals 1.2 millimeter. The curves rise from about 2 dBi near 2 GHz to about 12 to 13 dBi around 10 to 20 GHz, then fluctuate around about 10 to 13 dBi through about 30 GHz and then decrease with fluctuations toward about 8 to 10 dBi by about 48 GHz.
Figure 7(a) indicates that the designed clover-shaped director could enhance the main lobe gain by about 5 dBi from 23 to 48 GHz. In addition, the director could concentrate energy, thereby improving the directionality of the designed AVA, as shown in Figure 7(b).
Experiment verification
To verify the performance of the AVA designed in this paper, a prototype as shown in Figure 9(a) and (b) is fabricated and measured. Its overall dimension is 102 mm × 52 mm × 1 mm. The antenna adopts side feeding and is fixed with sponge during testing in the microwave anechoic chamber, as shown in Figure 9(c).
Prototype of the proposed antenna. (a) Top view. (b) Bottom view. (c) Antenna performance measurement environment.

Figure 10 shows the comparison of S parameters, gain, and radiation efficiency between simulation and measurement results. It can be observed that the fabricated prototype achieves a bandwidth from 2.2 to 48 GHz, which agrees well with the simulation results. However, the measured S parameter is slightly worse than the simulated results in some frequency bands, but still below −10 dB in most of the operating bandwidth, as shown in Figure 10(a). This is mainly due to poor calibration caused by interface wear of the vector network analyzer. Moreover, Figure 10(b) indicates that the measured gain is basically consistent with the simulated results, which is 3.4–11.0 dBi from 2.2 to 10 GHz, higher than 11.0 dBi from 10 to 25 GHz, and higher than 8.0 dBi from 25 to 48 GHz. The peak gain reaches 14.3 dBi at 12 GHz, and the average gain is over 10.5 dBi. The error between measurement and simulation results mainly comes from the unstable transmission loss of the horn antennas used for testing. Figure 10(c) shows the radiation efficiency of the proposed antenna, which indicates that the simulated and measured results fit well, and the average radiation efficiency is over 93%. According to Figure 11, the measured radiation patterns of the proposed antenna achieve good agreement with simulated results, but there is still a main lobe depression at high frequencies in the fabricated prototype. This is mainly due to the residual metal on the substrate caused by the plastic metallization process. The above results demonstrate high gain, high directionality, and UWB for the proposed AVA.
Comparison of simulation and measurement results of the proposed antenna. (a) Reflection coefficient (|S 11|). (b) Gain (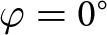 ${{\varphi }} = 0^\circ $,
 ${{\theta }} = 0^\circ $). (c) Radiation efficiency.

Figure 10 Long description
The image A showing a line graph with two curves labeled “mea.” and “sim.”. The x-axis is labeled “Frequency (GHz)”, ranging from 0 to 48. The y-axis is labeled “|S| (dB)”, ranging from minus 40 to 0. A dashed horizontal line is drawn at minus 10. The “mea.” curve starts near minus 10 at 0, drops with many narrow dips between about 2 and 30, then rises toward about minus 10 by 48. The “sim.” curve stays mostly between about minus 10 and minus 20 with smaller dips and rises toward about minus 10 by 48. The image B showing a line graph with two curves labeled “mea.” and “sim.”. The x-axis is labeled “Frequency(GHz)”, ranging from 0 to 48. The y-axis is labeled “Gain(dBi)”, ranging from 0 to 15. The “mea.” curve rises from near 0 at 0 to around 12 near the marked value “12” close to 10, then fluctuates around roughly 10 to 13 through about 30 and trends downward toward about 8 by 48. The “sim.” curve rises from near 0 at 0 to around 12 near 10, then stays near about 11 to 13 through about 30 and ends near the marked value “14.3” close to 48. The image C showing a line graph with two curves labeled “mea.” and “sim.”. The x-axis is labeled “Frequency (GHz)”, ranging from 0 to 48. The y-axis is labeled “Radiation Efficiency”, ranging from 0.0 to 1.0. Both curves rise steeply from near 0.0 at 0 to about 0.9 by around 5 to 10, then remain near about 0.9 to 1.0 up to 48 with small fluctuations.
Comparison of simulated and measured 2D radiation patterns of the proposed antenna ( ${{\varphi }} = 0^\circ $). (a) 5 GHz. (b) 15 GHz. (c) 25 GHz. (d) 35 GHz.

Figure 11 Long description
The plots compare measured and simulated 2D radiation patterns of an antenna at different frequencies: 5 GHz, 15 GHz, 25 GHz and 35 GHz. Each plot is a polar graph with the radial axis labeled Gain in decibels and the angular axis labeled Angle in degrees. The legend indicates ′mea.′ for measured and ′sim.′ for simulated data. In each plot, the main lobe is centered near 0 degrees, with varying sidelobe patterns. At 5 GHz, the main lobe shows a peak gain around 8 to 10 decibels, with sidelobes ranging from minus 10 to minus 20 decibels. The measured and simulated patterns closely match in the main lobe but show slight deviations in the sidelobes. At 15 GHz, the main lobe remains similar, but the sidelobes are more pronounced, with some discrepancies between measured and simulated data. At 25 GHz, the main lobe is narrower, with measured data showing more variation in sidelobes compared to simulated results. At 35 GHz, the patterns show the most significant differences, with the main lobe slightly depressed in the measured data, likely due to experimental conditions. Overall, the plots demonstrate good agreement in main lobes across frequencies, with some variation in sidelobe levels.
Table 2 compares the parameters and performance of the proposed AVA with recent AVA designs. The following conclusions can be drawn from the comparison table: References [Reference Hossain, Pancrazio, Kelley and Pham7] and [Reference Das, Clavin, Debbarma, Sharma, Lambert and Hobart18] achieve similar relative bandwidth and higher gain as the proposed work, but these structures include double-layer metasurface or 3D-printed shaped dielectric lens, resulting in a significant expansion of their profile and an increase in the complexity of processing and assembling. References [Reference Nie, Shen, Zhang and Liu9] and [Reference Loconsole, Portosi, Francione, Anelli, Annunziato, Falconi and Prudenzano15] also achieved a high average gain in a broadband. However, they have a larger width and a smaller frequency ratio. Reference [Reference Wang, Xu, Sun, Wang and Wang14] obtained excellent stopband characteristics, but it has a relatively narrow bandwidth and a large electrical size.
Comparison of the proposed AVA with other works

Table 2 Long description
The table compares six antenna designs by operating bandwidth and relative bandwidth, measured peak and average gain, electrical size referenced to the lowest operating frequency, whether filtering is integrated, layer counts, and low profile status. The proposed design spans 2.2 to 48 gigahertz with 182 percent relative bandwidth, 14.3 dBi peak gain and 10.9 dBi average gain, and it is low profile with a compact electrical size of 0.75 by 0.30 by 0.007. Only reference 7 matches the 182 percent relative bandwidth, but it is not low profile and uses more layers, with higher peak and average gain at 17.0 and 15.37 dBi. Reference 18 covers the highest top frequency at 60 gigahertz and has 176 percent relative bandwidth, but it is not low profile and is much thicker electrically, with a lower average gain of 8.5 dBi. Reference 14 is the only filtering antenna, but it has the narrowest bandwidth at 45 percent and the largest electrical footprint. Among low profile designs, the proposed work offers the broadest bandwidth and one of the smallest thickness values, with gains higher than references 9 and 15 but lower than reference 7. Electrical size values depend on the lowest operating frequency used for normalization, so cross paper size comparisons should be interpreted cautiously.
Note: λ L is the wavelength at the lowest operating frequency.
In conclusion, the presented structures achieve a good balance between size, bandwidth, and gain in comparison to the literature, resulting in better overall performance. The AVA proposed in this paper features a compact structure, UWB, and high gain, making it a good candidate for UWB applications requiring high integration.
Conclusion
This paper presents a miniaturized AVA with UWB and high gain. It has a compact size of 52 mm × 102 mm × 1 mm and offers an operating bandwidth of 2.2–48 GHz, which covers most of the UWB usage requirements. By applying comb-like radiation fins, the antenna achieves a broader bandwidth and higher gain without increasing size. Moreover, a clover-shaped director is introduced to further improve the gain. The measured peak gain reaches 14.3 dBi at 12 GHz, and the average gain within the entire operating frequency band is over 10.9 dBi. Due to its characteristics of UWB, high gain, and compact, the proposed antenna has enormous potential for application in UWB systems requiring high gain and integration.
Funding statement
This work was supported in part by the National Natural Science Foundation of China under Grant No. 52207214.
Competing interests
The author(s) declare none.

Meiling Li obtained a B.S. in electronic information engineering from Anhui University, Hefei, China, in 2010, and a Ph.D. in electronic science and technology from the University of Science and Technology of China, Hefei, China, in 2016. She was a postdoctoral researcher with the Department of Electronic Engineering and Information Science, University of Science and Technology of China. She is currently a lecturer with the School of Communication and Information Engineering, Shanghai University. Her research interests include antennas, frequency-selected surfaces, absorbing materials and structures, and wireless power transfer.

Tianyu Zhang obtained a B.S. in information and engineering science from Shanghai University, Shanghai, China, in 2024. He is currently pursuing an M.S. at Shanghai University, Shanghai, China. His current research interests include UWB antennas and wireless power transmission.

Zhewei He received his Diploma in 1993 from Xidian University and his Master’s at Nanjing University of Science & Technology in 1996. He worked as general manager at Suzhou BOXUN Communication Ltd, which focuses on plastic antenna manufacture.

Zixuan Yi obtained a B.S. in electronic engineering and information science from the University of Science and Technology of China, Hefei, China, in 2014, and a Ph.D. in electronic science and technology from the University of Science and Technology of China, Hefei, China, in 2016. He is currently a lecturer with the School of Communication and Information Engineering, Shanghai University. His research interests include antenna arrays, high-power microwave wireless power transfer, and microwave circuits.



