1. INTRODUCTION
Presently, construction of new accelerators producing intense relativistic heavy ion pulses, like the FAIR facility at GSI, has renewed interest in heating matter with heavy ion beams and also in heavy ion beam inertial fusion (Sharkov, Reference Sharkov2007; Sharkov & Varentsov, Reference Sharkov and Varentsov2013). Also the proton beams of the CERN PS facility, carrying large bunch energies, have been considered for experiments on high energy density in matter (Tahir et al., Reference Tahir, Kain, Schmidt, Shutov, Lomonosov, Gryaznov, Piriz, Temporal, Hoffmann and Fortov2005). New target concepts for heavy ion beam fusion have been developed, envisioning cylindrical configurations adequate for ion beam irradiation along the axis (Henestroza & Logan, Reference Henestroza and Logan2012). These schemes require large accelerator systems, a point recently addressed by Helsley and Burke (Reference Helsley and Burke2013).
Here we explore some basic conditions for thermonuclear fusion in cylindrical target configurations pre-compressed by a heavy liner. It is schematically shown in Figure 1. It is assumed that cryogenic DT-fuel has already been compressed to 100 g/cm3 corresponding to radial convergence by a factor 20. This important and difficult step of radial implosion is not simulated here explicitly. Ways to drive this implosion by a heavy ion beam, wobbling the beam around the axis such that it deposits energy only into the metal shell surrounding the fuel, have been investigated by Piriz et al. (Reference Piriz, Portugues, Tahir and Hoffmann2002) and also by Basko et al. (Reference Basko, Churazov and Aksenov2002).
(Color online) Schematic drawing of a steady burn wave propagating in a cylinder of compressed DT-fuel with velocity v bw to the right. Relevant mechanisms transporting energy from the burn region radially into the surrounding high-Z tamper and along the axis into non-ignited fuel are indicated by arrows.

The goal of the present investigation is then to study ignition and burn numerically. Simulations are performed, using the code MULTI-2D. It describes radiation hydrodynamics in two spatial dimensions. The published version of MULTI-2D (Ramis et al., Reference Ramis, Meyer-ter-Vehn and Ramírez2009) is restricted to a single matter temperature (T e = T i) and includes electron heat conduction and radiation transport in a one-frequency-group approximation, solving the transport equation with angular resolution along rays. This feature is important to account for the specifics of cylindrical geometry and target materials of very different opacity. An extension of the code to include DT fusion reactions and α-particle transport has been described by Ramis and Ramírez (Reference Ramis and Ramírez2004). Motivated by the present work, the code has been further extended to account for separate ion and electron temperatures as well as neutron energy deposition. This latest version of MULTI-2D is available at the MULTI web site (server.faia.upm.es/multi/). In part, these extensions are based on simplifying assumptions to be discussed in more detail below. It is for this reason that we cannot claim high accuracy for the simulations presented below. Nevertheless, we think that qualitative conclusions can be drawn.
A major focus of the present investigation is to explore the conditions for steady burn wave propagation and how it depends on density ρ and density-radius product ρR of the pre-compressed fuel. This is discussed in Section 2. In Section 3, the relative importance of the various transport processes in radial and axial directions is checked, discussing also model assumptions in more detail. In Section 4, ignition by a heavy ion beam pulse is studied, varying pulse duration and deposited total energy to find the ignition threshold. In the concluding section, we compare with previous work on this topic by Avrorin et al. (Reference Avrorin, Bunatyan, Gadzhiev, Mustafin, Nurbakov, Pisarev, Feoktistov, Frolov and Shibarshov1984) as well as Vatulin et al. (2002) and Basko et al. (Reference Basko, Churazov and Aksenov2002).
2. BURN WAVE PROPAGATION
As soon as the target configuration sketched in Figure 1 has been ignited at one end, a burn wave may develop running along the cylinder. Such a wave is seen in Figures 2 and 3. The focus of this section is on steady burn wave propagation and how it depends on the fuel parameters. It should be understood that the details of ignition are not important for this steady propagation phase. We can therefore initialize the wave simply by means of a “spark plug,” i.e, setting part of the fuel cylinder to a sufficiently high temperature (e.g., 20 keV) initially.
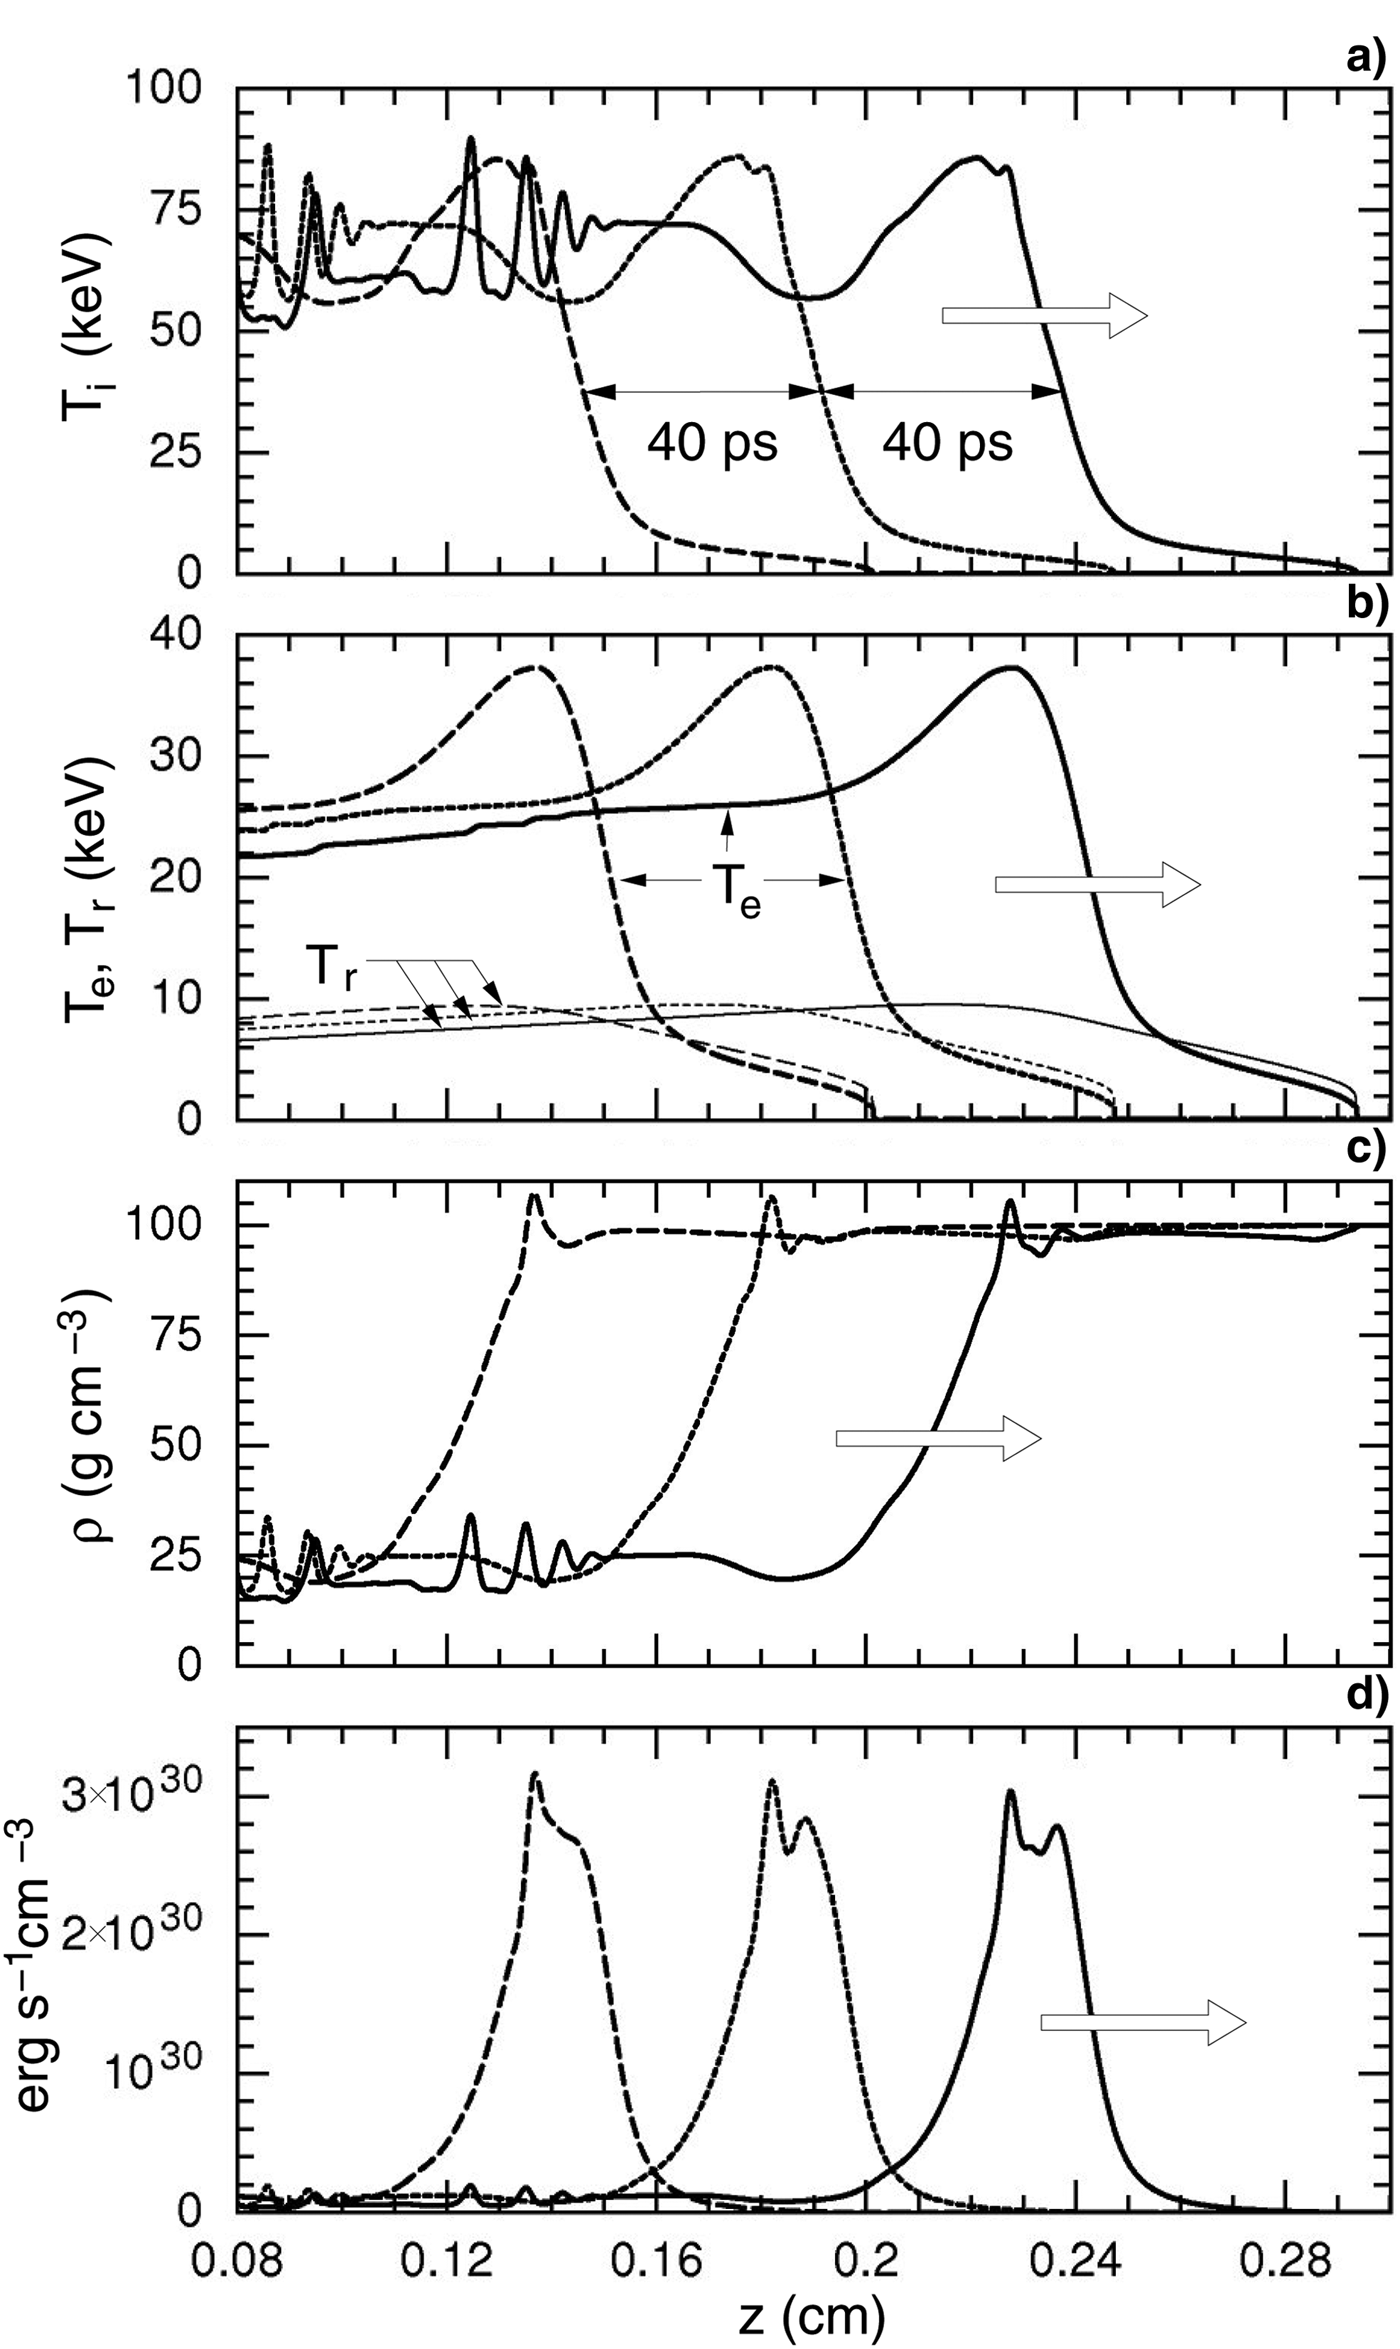
Snapshots (40 ps time intervals) of propagating burn wave for the reference case, plotted as on-axis profiles of (a) ion temperature, (b) electron and radiation temperature, (c) density, and (d) fusion power released per unit of volume. The arrows indicate the direction in which the wave propagates at a velocity of 1.26 cm/ns.
(Color online) Distributions of (a) ion, (b) electron, (c) radiation temperature, as well as (d) density and (e) fusion power density released, presented as contour plots in r,z plane for the reference case.
2.1. The Reference Case
We start with a reference case that is close to the one considered also by Vatulin and Vinokurov (Reference Vatulin and Vinokurov2002) and by Basko et al. (Reference Basko, Churazov and Aksenov2002). The fuel cylinder contains equimolar DT of density ρDT = 100 g/cm3 and density-radius product (ρR)DT = 0.6g/cm2. The fuel is surrounded by a gold tamper with density ρAu = 400 g/cm3 and thickness d = 100 μm. Applying a spark plug at the left end of the fuel cylinder, a self-sustained burn wave develops and is running to the right along the tube. It is displayed in Figures 2a–2d after 2 mm of propagation, showing on-axis snapshots of ion, electron, and radiation temperature as well as density and fusion power density released. Apparently, a wave with an almost invariant shape is propagating to the right at the constant speed of 1.26 cm/ns. Corresponding r,z contour plots are shown in Figure 3. The burn wave is best characterized by the fusion energy release depicted in Figure 2d. The burn region extends over 200 µm, and the peak ion temperature is 90 keV, while electron temperature peaks at 38 keV and radiation temperature at about 10 keV. The radiation temperature is obtained as T r = (cU rad/(4σB))1/4, where U rad is the local radiation energy density, c the velocity of light and σB the Stefan-Boltzmann constant.
In the optically thin fuel region, thermal radiation propagates along straight lines and is absorbed at the wall of the gold tamper. In Figure 3, one observes an ablative heat wave running radially into the wall. It is optically thick and highly collisional so that ion, electron, and radiation temperature become equal. A fraction of the wall energy is re-emitted and heats the DT fuel to the right of the burn region. This process of radiative heating along a cylindrical hohlraum has been investigated in laser experiments by Stöckl and Tsakiris (Reference Stöckl and Tsakiris1991;Reference Stöckl and Tsakiris1993) and also by theoretical modeling (Tsakiris, Reference Tsakiris1992). Under present conditions, radiative fuel preheating, assisted by neutron energy deposition, is so strong that is actually ignites the fuel and drives the burn wave. The wave front is located, where the preheat temperature reaches 6–8 keV. This burn wave represents a kind of supersonic heat wave, having almost no density modulation at the wave front. This is clearly seen in the density plots of Figures 2c and 3d.
There are additional details to be noticed in Figures 2 and 3. Downstream from the burn region, fuel rarefaction and also strong recompression are observed. In Figure 2a, radial shock convergence to the axis is responsible for the spikes in ion temperature; they are also seen as density spikes in Figure 2c. In the electron temperature profiles of Figure 2b, the spikes are smoothed by electron heat conduction. Radial fuel compression is also observed in the preheated fuel ahead of the burn front (see Figure 3d), where it helps ignition. Other shock structures develop in the tamper, where the 400 g/cm3 gold is further compressed up to 625 g/cm3, and ablating gold plasma stagnates on the fuel and sends shocks to the center. Though radiation transport appears as the dominant agent, it should be emphasized that the other transport mechanisms also contribute and interact with each other in a complex way. Their relative importance is addressed in Section 3.
2.2. Threshold for Burn Propagation and (ρR)DT Scaling
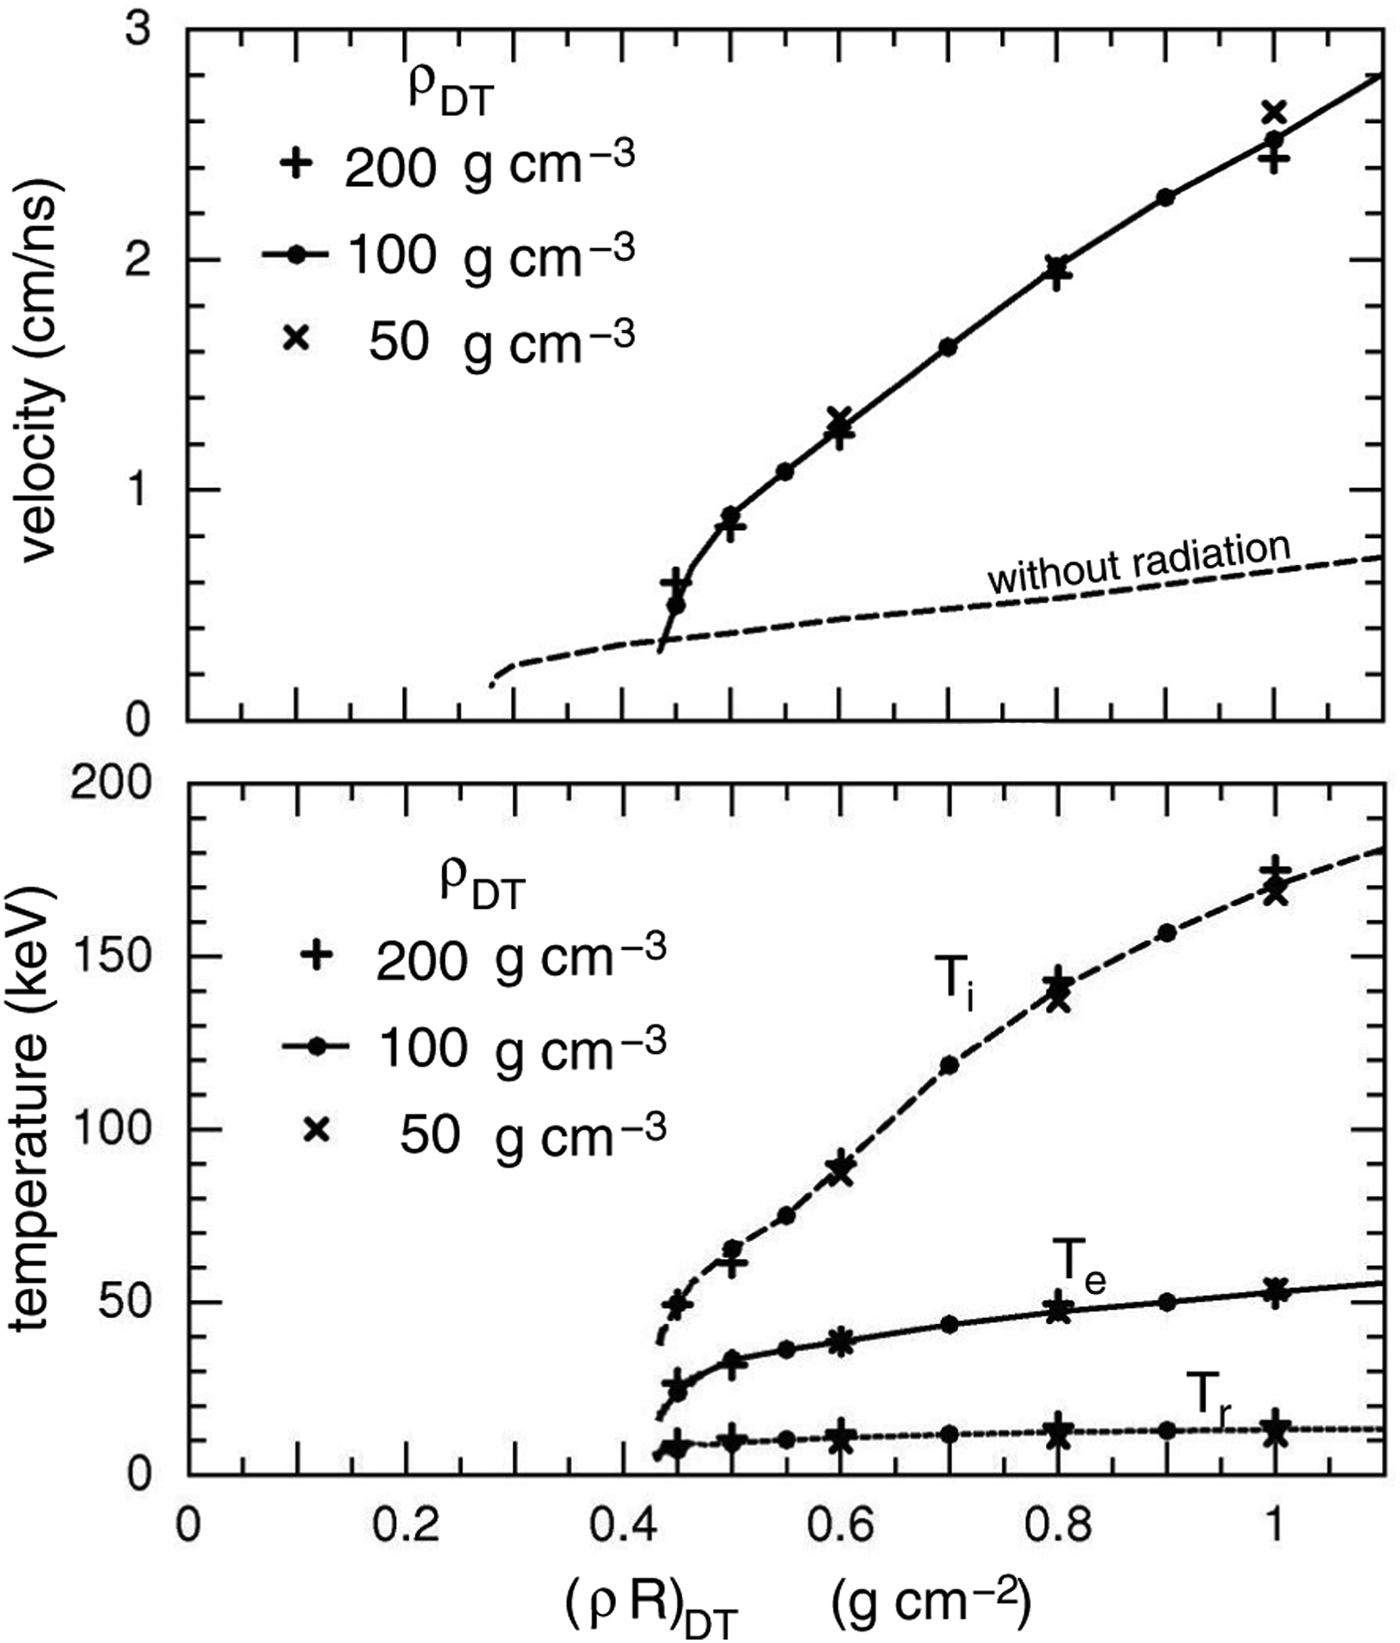
Here we check steady burn wave propagation as it depends on density and radius of the fuel cylinder. Results are plotted in Figure 4 as a function of (ρR)DT in form of burn wave velocity and temperatures of ions, electrons, and radiation for three initial values of ρDT (we set ρAu = 4 × ρDT). Apparently, the results depend only on the density-radius product (ρR)DT, and steady burn propagation is found for (ρR)DT > 0.45 g/cm2. For smaller values the spark plug kindles local burn, but does not propagate. For later reference, we also show, in Figure 4a, simulation results in which transport by thermal radiation had been switched off. In this case, burn propagation sets in at (ρR)DT ≈ 0.3 g/cm2 at a velocity of about 0.3 cm/ns.
Burn velocity and temperatures T i, T e, and T r plotted versus (ρR)DT. Results are shown for the different fuel densities indicated. Burn velocity is also depicted for the case without radiation transport (for ρDT = 100 g cm−3).
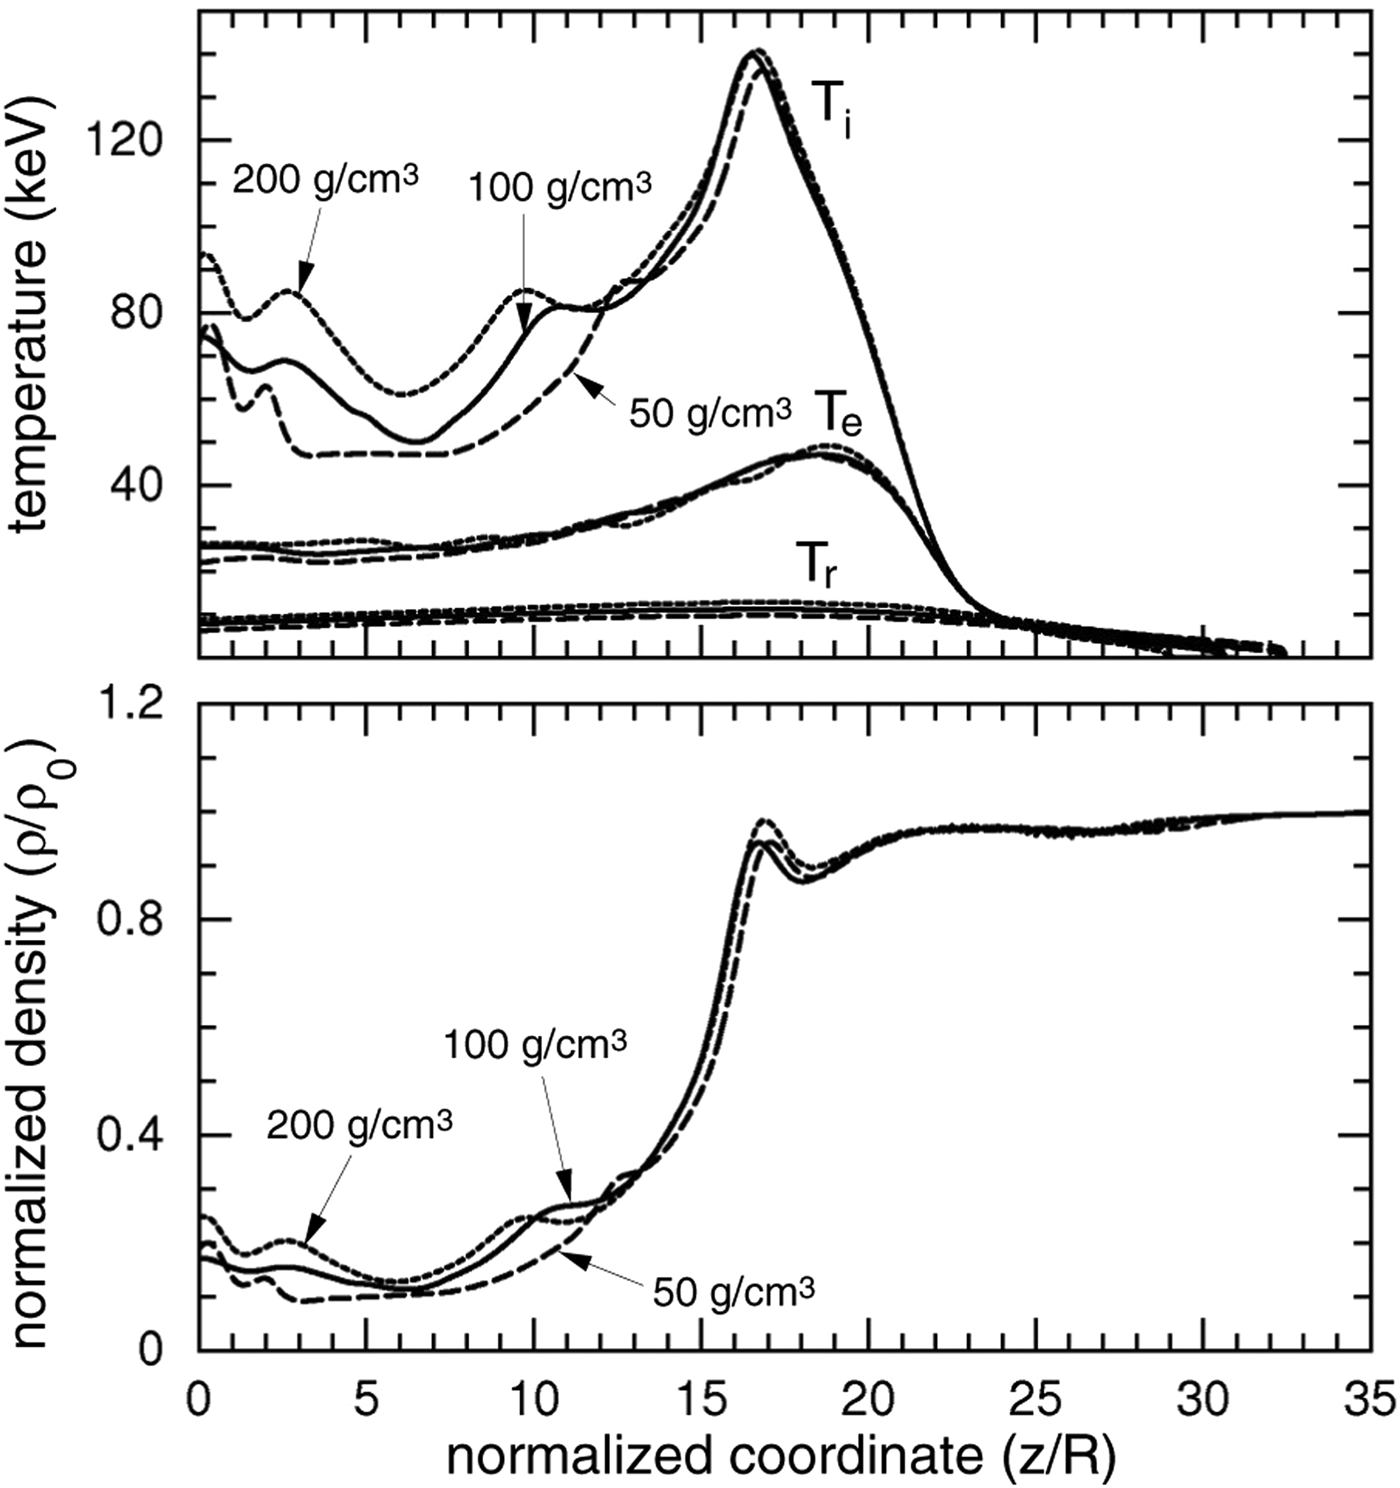
The scaling of burn propagation is further demonstrated in Figure 5 by plotting, on top of each other, scaled profiles of temperatures and fuel density that were obtained for different initial densities of 50, 100, and 200 g/cm3, but same (ρR)DT = 0.8 g/cm2; this value is sufficiently far from threshold to have stable propagation conditions. Apparently, the scaled profiles almost coincide, in particular close to the burn front. One expects the (ρR)DT scaling to be slightly broken, e.g. by transport coefficients depending on electron-ion collisions. These effects appear to be small for the cases studied here.
Scaled profiles of ion temperature and fuel density along the central axis plotted together for the given initial fuel densities, having same (ρR)DT = 0.8 g/cm2.
3. THE RELATIVE IMPORTANCE OF DIFFERENT TRANSPORT MECHANISMS
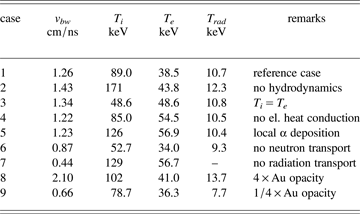
Here we explore how burn propagation depends on the different transport mechanisms involved. It should be understood that each transport mechanism alone, including the case of hydrodynamics only, could sustain propagation of a steady burn wave. In order to check their relative importance, we have chosen the reference case and switch off a given transport mechanism in the simulation, ad hoc and one at a time. Corresponding changes in burn wave velocity and peak temperatures are listed in Table 1. As it turns out, transport by thermal radiation is the most important mechanism driving the burn wave.
Dependence of burn wave velocity as well as maximum ion, electron, and radiation temperature in the steady phase on the various transport mechanisms modeled in MULTI-2D. In order to check the relative importance of a given transport mechanism, it is deliberately switched off, one at a time. The target configuration is that of the reference case with initially ρDT = 100 g/cm3, (ρR)DT = 0.6 g/cm2, ρAu = 400 g/cm3, d = 100 μm, (ρd)Au = 4 g/cm2.
3.1. Hydrodynamics, One- and Two-Temperature Model, Electron Heat Conduction and α-Particle Transport
Switching off all hydrodynamic motion (case 2) leads to a static configuration in which the burn wave propagates as a pure temperature wave. This leads to somewhat larger velocity than in the reference case 1. The most significant change, however, concerns the ion temperature which jumps by almost a factor 2 to 171 keV, from 89 keV for case 1. Switching on hydrodynamics in case 3, but enforcing T i = T e, causes minor changes. The same is found for the influence of electronic heat conduction (case 4) and α-particle transport (case 5), choosing local α-particle energy deposition rather than the MULTI-2D option for α-particle transport along rays.
3.2. Energy Deposition by Neutrons
For estimating neutron energy deposition into the fuel, one has to consider the range of 14.1 MeV neutrons, which is ρDTl n ≈ 4.7 g/cm2 (Atzeni & Meyer-ter-Vehn, Reference Atzeni and Meyer-ter-Vehn2004,) (414–415), corresponding to a mean free path of ln ≈ 470 µm in DT of 100 g/cm3. On the average, the neutrons loose a fraction 2A/(A + 1)2 of their energy when colliding with a nucleus of mass number A. This amounts to 40% for DT fuel with A = 2.5. Modeling neutron energy deposition in MULTI-2D, some simplifying assumptions were made. Only the first collision in the DT fuel is taken into account, and scattered neutrons as well as those reaching the gold tamper without collision are assumed to escape from the target volume without further energy deposition. Due to the large mass difference, collisions in Au are mainly elastic, and neutron energy deposition into the tamper is small. Another simplifying assumption is that energy deposition along rays occurs instantaneously. This would correct for infinite neutron velocity, but may be questioned in view of the actual velocity of 3.7 cm/ns of a 14.1 MeV neutron when compared with the burn wave velocity in the order of 1 cm/ns.
This approximate way to treat neutrons may overestimate the preheating due to neutrons. When switching it off in case 6, i.e., all fusion neutrons escape freely from the target, we find a sizeable reduction (30–40%) in burn temperature and burn velocity.
3.3. Energy Transport by Thermal Radiation
Calculating radiative energy transfer is straightforward for the DT fuel. Since it can be taken as fully ionized and optically thin, the analytic expression of the Planck mean opacity is used, which is given by Zel'dovich and Raizer (Reference Zel'dovich and Raizer1967) and is quoted by Atzeni and Meyer-ter-Vehn (Reference Atzeni and Meyer-ter-Vehn2004). Radiative transport in the optically thick gold layer, however, introduces a considerable uncertainty in the present simulations. This is because we have no reliable values for the opacities of compressed gold at temperatures of 1–10 keV and photon energies in the range up to 100 keV. As an estimate of the one-group Rosseland mean opacity, we use the expression κR ≈ κ0 × (T/keV)-β with the parameters κ0 ≈ 264 cm2/g and β ≈ 1.46. They have been extrapolated from the values κR ≈ 7400 cm2/g at a temperature of T = 100 eV and κR ≈ 869 cm2/g at T = 500 eV, both applying to gold plasma at a density of ρAu = 10 g/cm3 and quoted by Rickert et al. (Reference Rickert, Eidmann, Meyer-ter-Vehn, Serduke and Iglesias1995) as well as by Atzeni and Meyer-ter-Vehn (Reference Atzeni and Meyer-ter-Vehn2004). These values have been calculated by Bar-Shalom and Oreg (Reference Bar-Shalom and Oreg1996) on the basis of the super transition array approach and may be regarded as the most reliable values published so far. There is also some density dependence not taken into account here which tends to increase opacity for higher densities. On the other hand, we can not exclude that the gold tamper, even for the areal density of 4 g/cm2, becomes transparent for high energy X-rays in the range of hv > 100 keV. This would lead to additional energy losses.
Treating opacity as described above, the gold tamper remains optically thick in the present simulation. Even downstream from the burn region, where a gold temperature of 10 keV is observed in Figure 2, the optical thickness amounts to κRρAud = 36.4. So we expect the gold tamper to almost fully contain the radiation which is then strongly preheating and actually igniting the DT fuel. Switching off radiation transport (case 7), the burn front velocity falls dramatically to 0.44 cm/ns, which is almost one-third of the reference value. The sensitivity of burn propagation to the gold opacity is further shown by cases 8 and 9, for which we have scaled the opacity strength κ0 deliberately to κ0 × 4 and κ0/4, respectively. Increasing the opacity, reduces energy losses into the wall, enhances fuel preheating and therefore speeds up the burn front. Decreasing the opacity slows down the front velocity.
4. IGNITION BY A HEAVY-ION BEAM
In this section, we explore DT ignition by a heavy ion beam pulse and the onset of burn wave propagation. For simplicity, we stick to the relativistic beam scenario outlined by Koshkarev (Reference Koshkarev2002), which formed also the starting point for Vatulin et al. (2002) and Basko et al. (Reference Basko, Churazov and Aksenov2002). It is assumed that an ion beam pulse is axially penetrating the DT fuel cylinder and has a stopping range of about 6 g/cm2. Such a range corresponds, e.g., to Bi ions of about 100 GeV energy. The deposition profile dE/dR along the propagation axis is shown in Figure 6. The radial beam profile is box-shaped with radius equal to R DT and is constant in time. We vary beam duration and total pulse energy to find the threshold for ignition and burn propagation. All other target parameters are those of the reference case (case 1 in Table 1).
(Color online) Heavy ion deposition profile versus stopping range in DT fuel at 2 keV electron temperature.
In Figure 7, we show a simulation in which the beam deposits 700 kJ of beam energy in 200 ps. This is well above the threshold for ignition. Snapshots of density, deposited beam power density, and electron temperature are presented for three times. At 5 ps, hydrodynamic motion is just setting in, and temperature is highest at the end of the range due to the Bragg peak. After 100 ps, it is noticed that the beam can penetrate more deeply into the fuel cylinder due to rarefaction near the tamper wall. This leads to some kind of conical implosion in front of the temperature peak, forming a clot on the axis with peak fuel density of 300 g/cm3. Beam deposition into this clot helps ignition, and onset of the burn wave starts from this high-density region, as it is seen in the plots for 200 ps at the end of the pulse. At this time, the ion beam has overtaken the ignition region and preheats fuel ahead of the wave front, assisting onset of propagation.
(Color online) Ion beam ignition for a 700 kJ, 200 ns pulse, shown in terms of density, beam deposition power, and temperature in the r, z plane for times 5, 100, and 200 ps.
Figure 8 summarizes a number of simulations for beam parameters indicated by filled and open triangles, showing regions of ignition (shaded) and no-ignition. For the reference target and a pulse duration of 200 ps, the pulse energy should exceed 540 kJ to ignite the cylindrical DT fuel. It corresponds to a beam power of 2.7 PW.
(Color online). Region (shaded) of DT ignition and burn propagation in the plane of ion beam pulse energy and duration. Triangles define beam parameters of the simulations performed. Dashed lines give the required beam power.
5. SUMMARY AND COMPARISON WITH PREVIOUS WORK
Ion beam inertial confinement fusion has been investigated numerically, using an extended version of the code MULTI-2D. In the simulations, pre-compressed cylindrical target configurations of DT fuel enclosed in a gold tamper were considered. Conditions for one-sided ignition by an axial heavy ion beam pulse have been studied, and particular attention was paid to the phase of steady burn wave propagation along the cylinder. The wave can be characterized by the peak ion temperature in the burn region and the velocity of the wave front. Results are found to scale approximately with the density-radius product (ρR)DT. Steady burn propagation was found for (ρR)DT ≥ 0.45 g/cm2. We have checked how these results depend on the various transport mechanisms modeled in MULTI-2D. Thermal radiation transport is found to play the dominant role, while electronic heat conduction and energy transport by fusion particles are of minor importance.
The physical picture, arising from the present study, is that the gold layer is not only tamping fuel expansion, but it is also acting as a hohlraum confining the radiation emerging from the burning plasma. This radiation is absorbed and partially re-emitted by the gold wall. It preheats the optically thin fuel ahead of the burn front. This front then coincides with the front at which the fuel temperature reaches 5–10 keV. In the phase of steady propagation, we can view the burn wave as a supersonic heat wave with almost no density modulation close to the front.
It is interesting to compare the present findings with those of previous publications. A paper on ignition and burn propagation along a pre-compressed cylindrical DT configuration was published by Avrorin et al. (Reference Avrorin, Bunatyan, Gadzhiev, Mustafin, Nurbakov, Pisarev, Feoktistov, Frolov and Shibarshov1984). The work was based on the two-dimensional code ZARYA in a T e = T i version, taking into account transport by α-particles and neutrons as well as heat conduction. However, transport by thermal radiation was not discussed at all. This makes it difficult to compare in a quantitative way. Propagation of steady burn wave is reported for (ρR)DT = 0.5 g/cm2 with a maximum temperature of 30 keV and a front velocity of 0.3 cm/ns. These values are markedly lower than those found in the present study. We notice, however, that we obtain similar results when radiation transport is switched off. We have included such results in Figure 4a. In particular, the threshold for burn propagation at (ρR)DT ≈ 0.3 g/cm2 coincides with the value reported by Avrorin et al. (Reference Avrorin, Bunatyan, Gadzhiev, Mustafin, Nurbakov, Pisarev, Feoktistov, Frolov and Shibarshov1984).
The papers of Vatulin et al. (2002) and Basko et al. (Reference Basko, Churazov and Aksenov2002) deal with ignition by a heavy ion beam. Results are based on the 2D code MIMOZA-ND accounting for two-temperature gas dynamics, radiation energy transfer and α-particle transport within a multi-group diffusion approximation as well as electron thermal conductivity. No information is given on neutron transport. Results are reported for target and beam parameters almost identical to those chosen here, except that only 400 kJ of beam energy were deposited into the fuel rather than the 700 kJ taken in Section 3. This low drive energy and also the value of (ρR)DT = 0.5 g/cm2 chosen by Vatulin and Basko are very close to ignition threshold, and this may explain some of the differences observed.
Vatulin et al. (2002) give density and temperature profiles on target axis for times during beam deposition and shortly after. At the end of beam irradiation, the fuel temperature is still at 20 keV, and ignition develops only afterwards with peak ion temperature then rising to 100 keV. A prominent feature is a sharp density spike at the burn front, which is interpreted as detonation front. In the present work, we also find a pronounced density peak on axis, but for a different reason. The two-dimensional density pattern displayed in Figure 7 reveals that the beam deposition front develops a conical shape, and the on-axis density peak arises from conical implosion. It almost disappears in the later phase of steady burn propagation.
In conclusion, the present paper has clarified some basic physics related to ignition and burn propagation in a cylindrical configuration, compressed by a high-Z liner that confines the DT fuel, both inertially and radiatively. These configurations may become of interest in the future for advanced schemes of heavy ion beam fusion.
ACKNOWLEDGEMENTS
We want to dedicate this work to Rudolf Bock, the pioneer of heavy ion beam fusion in Germany, and to Ray Kidder, who showed continuous interest in using direct-drive cylindrical implosion for ion beam inertial fusion. We thank Boris Sharkov, who in a sense triggered this work, and Michail Basko, who helped us significantly with critical comments. The work was supported by CICYT of Spain project ENE 2006 - 06339, and by EURATOM/CIEMAT as well as the EURATOM/Max-Planck-Institut für Plasmaphysik associations in the framework of the ‘IFE Keep-in-Touch Activities’.