


1. Introduction
It is so hard to live here. Everyday something happens. Who do we blame if there is a storm? There is nothing to do but find another home. How long can we go on living like this? (Interview with a village elder from Bangladesh – Kartiki, Reference Kartiki2011)
Over the last 20 years, Bangladesh has experienced significant socioeconomic improvements (General Economics Division, 2009) but it is still categorized among the UN-designated Least Developed Countries (LDCs), ranked 146 on the Human Development Index (United Nations Development Programme, 2011), with around 40 per cent of the population reported to be living in poverty, and almost half of the residents with no education (Bangladesh Bureau of Statistics, 2005).
Located at the top of the Bay of Bengal, between 20–26° North and 88–92° East, Bangladesh has been called a ‘country made for disasters’, due to its specific geographical characteristics and its current and anticipated vulnerabilities to climate risks (Poncelet et al., Reference Poncelet, Gemenne, Martiniello, Bousetta, Afifi and Jager2010). Almost 80 per cent of the country is floodplains and on average 20 per cent of its area is flooded every year (Monirul Qader Mirza, Reference Monirul Qader Mirza2002; Agrawala et al., Reference Agrawala, Ota, Ahmed, Smith and van Aalst2003).
There is a consensus in climate model outputs that Bangladesh will experience increases in temperature in the coming decades. Most of the climate models also predict that precipitation will increase, although seasonal differences are expected (Agrawala et al., Reference Agrawala, Ota, Ahmed, Smith and van Aalst2003) which can have severe consequences for a country where around 60 per cent of its citizens are directly and indirectly dependent on agricultural employment and production. The German Advisory Council on Global Change (2007), among others, believes that glacial retreats, annual monsoon variations, sea-level rise and cyclones could be sources of social crises and instability in India, Pakistan and Bangladesh. The vulnerability of Bangladesh to sea level rise, whether directly or through storms and cyclones, has also been acknowledged by many authors (e.g., Ali, Reference Ali1996; Dasgupta et al., Reference Dasgupta, Laplante, Meisner, Wheeler and Yan2009, Reference Dasgupta, Laplante, Murray and Wheeler2011).
Considering the environmental and socioeconomic challenges that Bangladesh faces, numerous studies have shown that migration, whether voluntary or forced, temporary or permanent and internal or external, has been one of the main features of life in the region since the 18th century (Siddiqui, Reference Siddiqui2003; Joarder and Hasanuzzaman, Reference Joarder and Hasanuzzaman2008).
The Bangladesh Bureau of Statistics provides data showing how the number of net out-migrants increased dramatically from 212,000 in 1970 to 1,033,000 in 1990 and to 2,908,000 in 2010, with significant differences in patterns across genders. The net out-migration (emigrants/1,000 population) rose in both rural (1.5 to 4) and urban (1.2 to 16.4) areas between 1984 and 1998 (Bangladesh Bureau of Statistics, 2000, 2001, 2011). As can be seen in figure 1, the most recent data (Bangladesh Bureau of Statistics, 2009) shows that the levels have varied between 2003 and 2009, but on average they are considerably higher than the last couple of decades of the 20th century.
Decomposition of Bangladesh migration flows Source: Bangladesh Bureau of Statistics (2009).

Various reasons have been proffered for the internal migration dynamics in Bangladesh, such as: (1) the high rate of urbanization, especially after the liberation of Bangladesh from Pakistan, which affected the sex ratio around the country as the males were more likely to migrate individually to the big cities; (2) lack of full-year employment and unoccupied arable land in rural areas; (3) environmental and climatic variations; and (4) higher wages at the destinations, which have led to multi-locational households and increasing levels of dependency on remittances (Jansen, Reference Jansen1987; Toufique, Reference Toufique, Toufique and Turton2002; Afsar, Reference Afsar2003; Hossain et al., Reference Hossain, Khan and Seeley2003).
In this paper, we have used an agent-based model (ABM) with Bangladesh district-level data, to explore the possible migration dynamics across the country based on projected climate change scenarios. To our knowledge, it is one of the first times that an ABM has been applied for this purpose at this scale and level of disaggregation. Using an ABM provides an opportunity for constructing an integrated migration model that is sensitive to social, economic and environmental factors, capable of considering heterogeneity among migrants and in migration dynamics, and capturing some of the complexity involved in the emergence of migration patterns.
Prior to this study, Silveira et al. (Reference Silveira, Espíndola and Penna2006) applied a computational model to explore the urban–rural dynamics in developing countries. Kniveton et al. (Reference Kniveton, Smith and Wood2011) later developed an ABM to study the link between climatic change (in the form of rainfall), socioeconomic and political factors and migration, under different scenarios in Burkina Faso. They concluded that climate change is likely to play a significant role in shaping migration patterns in the coming decades.
In section 2 we briefly review the literature on the climate–migration link and provide details on the micro-level migration decision-making process in Bangladesh. In section 3 the model is introduced. The results are presented in section 4 and the conclusions in section 5.
2. Climate, migration and Bangladesh
The literature on climate-change induced migration has reached mixed conclusions (Myers, Reference Myers2002; Kniveton et al., Reference Kniveton, Schmidt-Verkerk, Smith and Black2008). Some authors believe that sudden or gradual impacts of climate change, such as a higher frequency and intensity of droughts, is likely to lead to mass-migration around the world, while others reject this claim or doubt the predicted scales, referring to people's adaptability and some international evidence on the relationship between past climate events and migration.
Warner and her colleagues believe that, as an alternative to adaptation or to accepting a lower living standard, migration is an important option for residents of the affected areas. In their perspective, the migration decision itself is affected by different socioeconomic and even political conditions (Warner et al., Reference Warner, Hamza, Oliver-Smith, Renaud and Julca2010). Reuveny (Reference Reuveny2007) provides theoretical arguments and case studies on how climatic and environmental factors can lead to migration. He predicts that migration would be more likely in countries with lower levels of development, even causing conflict between the migrant and the receiving communities. Black et al. (Reference Black, Kniveton and Schmidt-Verkerk2011) applied an integrated assessment approach to show how the current migration flows may vary in future due to changes in climate.
Conversely, some studies argue that climate variations, even in poor or developing countries such as Burkina Faso and Brazil, are not associated with increases in migration or at least show mixed responses (Henry et al., Reference Henry, Schoumaker and Beauchemin2004; Barbieri et al., Reference Barbieri, Domingues, Queiroz, Ruiz, Rigotti, Carvalho and Resende2010). Naudé (Reference Naudé2010) found no significant associations between natural disasters and resource scarcity, and international migration, for 45 sub-Saharan countries.
Raleigh and Urdal (Reference Raleigh and Urdal2007) attempted to decompose the climate-induced migration patterns in developing countries, based on the differences in factors (e.g., gradual and sudden) and types of migration (internal, external, temporary and permanent) and concluded that no mass-migration would be likely to happen if human reactions and adaptations are considered, although between 0 and 30 per cent of temporary migrants are expected not to return to their places of origin.
Some authors believe that the environmental and socioeconomic factors behind migration cannot be separated (Lonergan, Reference Lonergan1998; Kartiki, Reference Kartiki2011). Others warn against the rhetorical use of terms such as ‘climate refugee’ (Hartmann, Reference Hartmann2010). Brown (Reference Brown2007) contends that, although climate has affected human movements over history, migration is not the first response.
The climate–migration link seems to be more robust in Bangladesh where it was reported that in the mid-1980s close to two-thirds of households were displaced at least once in their lifetimes (Zaman, Reference Zaman1991). The majority of studies have predicted significant movements of people in Bangladesh, which has often been described as a hotspot case study by different authors, citing its low adaptation capacities and likely severe climate change impacts (Agrawala et al., Reference Agrawala, Ota, Ahmed, Smith and van Aalst2003; Hunter, Reference Hunter2005; Brown, Reference Brown2007; Kniveton et al., Reference Kniveton, Schmidt-Verkerk, Smith and Black2008; Perch-Nielsen et al., Reference Perch-Nielsen, Bättig and Imboden2008).
Alam (Reference Alam2003) reports that land and water scarcity in rural areas has caused inequality in employment opportunities and income, motivating internal and international migration among Bangladeshis. Internal migration, moreover, is more likely to be undertaken by poorer households who are not able to pay to cross the border (Mendola, Reference Mendola2008).
Swain (Reference Swain1996) argued that floods and sea level rise would be the key drivers of migration in Bangladesh, and Hunter (Reference Hunter2005) emphasized the role of floods and cyclones, noting that, although they may only cause temporary migration, even such temporary migration could contribute to civil disorder. Kartiki (Reference Kartiki2011) also describes migration as a resilience strategy against climate change in Bangladesh.
Sharma and Hugo (Reference Sharma and Hugo2009) review multiple studies and show how environmental factors have gained importance (as high as 40 per cent) in the internal migration decision process in Bangladesh. In their review, physical factors ‘included, but were not limited to, storms, salinity, river erosion, land degradation, loss of land due to flooding and other environmental hazards’. They also predict that higher sea levels, increasing temperature and coastal damages and salinity and changes in the precipitation and flooding would bring further migration responses in the country.
Besides those mentioned above and some other studies that are introduced in the next section confirming the climate–migration link in Bangladesh, it should be mentioned that at least one paper, Paul (Reference Paul2005), discussed a 2004 tornado in north-central Bangladesh which destroyed 3,400 homes across 38 villages, killing more than 100 people. The tornado apparently did not cause migration, in part because of the role of proper emergency responses.
3. Data and model
In order to explore the possible climate-induced migration patterns in Bangladesh, we have implemented an ABM which is based on data from Bangladesh at the district level.
The decision to use an ABM is based on the fact that the migration literature has always struggled with the complexity of the issue. Initially the focus was primarily on the socioeconomic aspects, but increasingly attention has turned to the ecological and climatic dimensions as well (Hunter, Reference Hunter2005; Brown, Reference Brown2007; Warner et al., Reference Warner, Hamza, Oliver-Smith, Renaud and Julca2010). Researchers in a variety of fields have sought new approaches to model complex adaptive systems (Boccara, Reference Boccara2004; Rosser, Reference Rosser2009; Xepapadeas, Reference Xepapadeas2010) and ABMs have emerged as a promising research stream (Epstein, Reference Epstein, Tesfatsion and Judd2006; Tesfatsion, Reference Tesfatsion, Tesfatsion and Judd2006). patterns in Bangladesh are significantly heterogeneous across the country (Kuhn, Reference Kuhn2002) and are influenced by multiple causal pathways – factors that play to the strengths of an agent-based approach.
Bangladesh is divided into seven major administrative regions called divisions. Each division is divided into several districts (zilas), with 64 districts in total, with areas ranging from 716 km2 (Meherpur) to 6,116 km2 (Rangamati), which then are partitioned into 500 upazilas. In this paper, we have used the district-level data, as more disaggregated data at the upazila level were not available for many variables. Each district is represented in the model by one main agent who manages the interactions within the district and reports the results. The districts are connected together as a network with nodes representing the centroids of the districts and links representing possible migration paths between districts. All districts are connected to the network, but they are only directly connected to those neighbouring districts with which they share a common boundary. Bangladesh's districts and the associated district network are shown in figure 2, following Angus et al. (Reference Angus, Parris and Hassani-M2009).
Bangladesh districts and district network structure (after Angus et al. Reference Angus, Parris and Hassani-M2009)

The list of micro-level data items, their format and their sources are presented in table 1. The data for each district was downloaded separately from the Bangladesh Bureau of Statistics websiteFootnote 1 and the selected items extracted.
Data titles and sources

Source: Bangladesh Bureau of Statistics (BBS).
3.1. Migration decision
In common with most of the literature, the migration decision function is associated with three groups of factors in this model, including: (1) push factors – climate change scenarios and their possible impacts, and the socioeconomic conditions of each district such as poverty level, local government development expenditures and unemployment rate; (2) pull factors – socioeconomic conditions of the potential destinations; and (3) intervening factors – land or house ownership and employment conditions.
Table 2 provides a list of the heuristic rules that have been inferred from different micro-level studies on the factors affecting migration decision in Bangladesh. The rules are usually provided by authors based on local surveys.
Observed migration decision rules

3.2. Overview, design and details
In order to represent the model details, we have used the Overview, Design and Details protocol (ODD) which recently has been widely used for describing ABMs (Grimm, Reference Grimm2006; Grimm et al., Reference Grimm, Berger, DeAngelis, Polhill, Giske and Railsback2010).
Purpose
The purpose of the model is to study the possible population migration dynamics in Bangladesh due to extreme climatic and environmental shocks.
State variables and scales
The main entities of the model include the Time, District Agent (District), the representative Individual Agent (Agent), and Scenarios. The smallest temporal unit is one tick, representing one month, and the model is run for 50 years. Each of the 64 District Agents represents one district. District Agents store the district's features such as its socioeconomic development level and also update some variables such population and its density.
Each Individual Agent represents 10,000 people and the model initiates with 12,317 agents distributed across the 64 districts, representing the total estimated 2001 population of 123,170,000 people. This level of abstraction has been chosen to ensure that all the attributes which characterize more than 1 per cent of the population have at least one member to represent them in the simulated environment. Since the lowest agent population in any district is 29 when the model starts, it means that one agent is representing at most 3 per cent of a district's population. On average, each agent represents 0.7 per cent of a district's population.
Population growth in Bangladesh, as with any other country, is affected both by natural factors such as birth rate, death rate and family size and by inward- and outward-migration flows. Since we want to reproduce the combined effect of these two sets of factors which together produce the population growth rate, we avoided simply using the observed growth numbers. Instead, as the birth and death rates are not available, the household size is used to determine natural population growth across the districts. Every 12 ticks (at the end of every year), each district's population increases by a multiple of that district's household size. For instance, if a district has 100 agents (representing 1,000,000 people) and its average household size is 5.6, its population increases by (5.6 – β1) × β2, where β1 and β2 determine the population growth scenario and can be calibrated to provide different population trends. In the simulations presented, β1 is set to 1 and β2 is set to 0.03 to provide a ‘fertility remains constant’ scenario. So for this sample district, at the end of that year the district's population increases by 14 agents, rounding (100 × (5.6 − 1) × 0.03). The values of these variables and the scale of representation are selected in such a way as to ensure that at least one agent is added to the district every year. The model endogenously generates the migration component. This has been done to avoid applying the population growth rate directly to the model, and instead using a proxy which can represent the population growth rate differences between the districts.
The agents do not die since net population growth has been used in the model. Each agent has a migration threshold which is used to represent its resilience against the push factors. The concept of threshold has been widely used in the migration literature before (Hunter, Reference Hunter2005), and we believe it provides a better insight into the complex migration behaviour of agents than neoclassical migration models that are based simply on cost-benefit analyses.
Each climate scenario is a time series with 600 data points (50 years × 12 months), each a number between 0 and 1, produced by a Poisson distribution given by:
 $$climate_{it} = random-poisson \lpar 1 + time / 600\rpar \times env_{i}$$
where climate it represents the intensity of the climatic shock for district i at time t and (time/600) provides an increasing trend for shock occurrence probability; env i guarantees that the scenarios are localized, based on historical climatic data for each district to produce separate scenarios across the country. The variable env i is a continuous variable with values between 0 and 1, which takes into account the combined impacts of droughts, floods, cyclones and sea level rise and is distributed across the 64 districts as shown in figure 3. If the env i is equal to 0, it means that specific district i is not vulnerable to any kind of climatic event, while if it is 1 it means that the district has the highest level of exposure among all 64 districts. As can be seen in figure 3, while the value can be between 0 and 1, it is mainly distributed under 0.35, confirming that districts have heterogeneous level of vulnerability.
Distribution of enviover 64 districts. enviwhich is between 0 and 1 represents each district's vulnerability to different climatic events. Districts with higher envivalues are expected to be more affected by climate change consequences

According to the Poisson distribution, if λ is the expected number of events in a given time interval, then the probability that there will be exactly x occurrences is equal to:
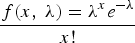 $$f\lpar x\comma \; \lambda\rpar = \displaystyle{\lambda^x e^{-\lambda}} \over {x!}$$
When the model starts, at time = 1, λ is very close to 1 and so the probability of a climatic event for different values of x will be very low when compared to agents' thresholds where λ is 3. Over the course of the simulation, as time increases incrementally, the random-Poisson function produces greater values, leading to an increase in the probability of a climatic shock.
The Poisson distribution and associated λ values were selected to avoid frequent severe climatic shocks. The final impact scenario is the average of all three threads and is called Impact (I) where each item is a value between 0 and 1 and shows the intensity of incidence. Over time both the intensity and frequency of the climatic shocks increase as λ increases to 2.
Process overview and scheduling
A sample process for an agent is shown in figure 4. During every tick, each agent considers the push and intervening factors and makes a decision on its migration. If it decides that migration could be beneficial, it measures the pull factors for all the districts in its 100-km radiusFootnote 2 and then moves to the closest district with the best socioeconomic conditions which is chosen in accordance with equation (4), described below. As temporary migration usually only occurs within a short range from the original location (Zaman, Reference Zaman1991; Joarder and Hasanuzzaman, Reference Joarder and Hasanuzzaman2008), agents do not leave their current districts and so they are ignored in this model.
Process overview for a sample agent

Design concepts
The main sources of emergence in the model are the preferences and interactions at the individual level which lead to the migration flows between the districts. The agents' adaptation decisions are based on their individual parameters and their perceptions about their social networks, trying to decrease their vulnerability and improve their socioeconomic conditions as their objective. Agents learn by considering their stay/migration decision outcomes in the past and using them as inputs through a feedback loop for their future decisions. As a result, when migration improves an agent's socioeconomic status, on the one hand the agent will be more inclined to migrate in future, which works as a positive feedback. But on the other hand, an improvement in the agent's attributes, such as employment or land ownership, may make migration less likely. The effects on the intervening factors in such a case function as a negative feedback, dampening any increased inclination to migrate. Also, a negative feedback exists at the macro level: when more agents migrate to a specific district, that can decrease the destination's favourability for future migrations, since population density increases and less land and jobs are available.
The main external factors that agents sense include the changes in the climate, the changes in the socioeconomic conditions in the current position and destination, and their social network performance which provides the individual-level interactions. The main recorded outcomes for the model include the most favoured movement paths and also the final distribution of population around Bangladesh.
Mathematical skeleton
The intervening factor (inter) is a random variable distributed uniformly between 0 and 1, associated with house and land ownership and employment. Since there is no study measuring migration decision sensitivities to house and land ownership and employment status, we have used a module which is constructed using three uniformly randomly distributed values, as equation (3).
 $$inter_{i} = random \, H_{ij} + random \, L_{ij} + random \, E_{ij}$$
where inter i is the intervening factor for agenti, H ij represents his house ownership, L ij is for land ownership and E ij is employment. The j subscript can be either 1 if the agent owns any land, owns a house or is employed and 0 if he does not; the random function returns a random float value between 0 and its input value, a sample of which is presented in table 3. Agents who have a house, land, job or a combination of these have higher values of the intervening factor.
Sample intervening factor values

If migrate is greater than the agent's migration threshold, then it will migrate to the neighbouring district with the highest pull factor. The pull factor is a weighted function of socioeconomic and environmental conditions at the possible destination districts.
 $$\eqalign{pull_{ij} &= \alpha_{1j} \, EC_{i} + \alpha_{2j}\, ED_{i} + \alpha_{3j} EN_{i} + \alpha_{4j} ET_{i} + \alpha_{5j} \, IF_{i} \cr &\quad + \alpha_{6j} HE_{i} + \alpha_{7j} \lpar 1/DI_{ij}\rpar}$$
The pull factor of district i for agent j is a function of EC which represents economic variables, ED for education, EN for environmental, ET for ethnic composition, IF for infrastructure, HE for health and DI for mutual distance, where α1 + α2 + α3 + α4 + α5 + α6 + α7 = 1. To create the alphas each agent first produces seven random numbers between 0 and 99 (r i) and then αi = r 1/Σj=17r j.
4. Implementation and results
The model was implemented in NetLogo 4.1 (Wilensky, Reference Wilensky1999), run on Monash University's Sun Grid High Performance Computing cluster, and the results were analysed using R (R Development Core Team, 2011). NetLogo uses a pseudo-random system, which means that, while the random numbers are ‘random’, their generation process is deterministic, based on an initial ‘seed’ number which is fed to the random number-generating algorithm. So, by choosing the same seed in different simulations, the final produced output of numbers will be the same, but selecting different seeds leads to generating different sets of initial conditions and therefore different results. All the experiments were run 20 times (seeds 1–20) to avoid possible dependencies on initial or run-time conditions and to provide Monte Carlo data.
The Monte Carlo simulation provides different distribution setups in every model run. For instance, if in one district with 1,000 agents where 90 per cent of the population is Muslim and 65 per cent are land-owners, then in this specific district all Muslim agents may own their land, so we would have 650 Muslim land-owners, 250 Muslims without land and 100 non-Muslims without land. On the other hand, it could be 100 non-Muslim land owners, 550 Muslims with land and 350 Muslims without land. As individual-level data is not available to find out exactly how the attributes should be distributed, the random seeds in the Monte Carlo simulation generate different initial conditions and the final average results are not dependent on a specific distribution.
We first ran the model for 10 years (2001–2010), 20 times (seeds 1–20), and validated the population projection with the recently published primary results of the Bangladesh 2011 Population and Housing Census (Bangladesh Bureau of Statistics, 2011). Figure 5 shows the estimated and real populations for 32 districts.Footnote 3
Model population at 2011 vs. observed 2011 population for 32 districts

As can be seen, in many cases our predictions are close to the observed values, although for a few districts such as Ganjipur, which has experienced the highest population growth over the past 10 years in Bangladesh (60 per cent in a decade), the model performance is poorer. In the final model, the average difference between the observed and the simulated district populations for 2011 is 2.42 per cent of the observed populations. The only variables adjusted are the intervening factor components, E ij, L ij and H ij, whose final values are presented in table 3.
4.1. Simulation outputs
Figure 6 shows the expected changes in population density in Bangladesh over the next 40 years based on the simulation outputs. The model's population for 2050 is around 295 million which is in line with the official Bangladesh population projections of 294.38 million, based on ‘fertility remains constant’ scenario (Bangladesh Bureau of Statistics, 2006).
Projected changes in each district's population (left) and population density (right) for 2050. The darker circles show higher values. The black circle in the left map shows Dhaka

According to the model outputs, it is projected that most Bangladeshis would live in the central and eastern parts of the country, namely Sylhet, Dhaka and Chittagong divisions, partly driven by the droughts in the western areas and the continual flooding in the southern districts. The model predicts between 3 and 10 million migrants over the next 40 years, depending on the scenario.
The model predicts that migrants would gravitate not only to the already populated urban areas, but also to Jhenaidah in the west and Comilla in the east and Gaibandha in the north, at least for temporary residence. These three districts are likely to be attractive due to their weaker sensitivity to adverse climate impacts, since they are in areas less vulnerable to sea level rise, or they are less likely to be affected by future droughts or floods.
5. Conclusion
Due to its geographic and economic characteristics, Bangladesh is among the countries most vulnerable to climate change impacts. In this paper, we used an ABM, implemented using real-world data, to explore the possible migration patterns in Bangladesh due to climatic shocks such as droughts, floods and cyclones.
The results show that climate change would be likely to affect migration within Bangladesh, by increasing movements towards the east and north-east districts, which are less affected by droughts and floods. The model also suggests that the current urban areas will continue to absorb migrants, and the environmentally vulnerable cities such as Dhaka will need to provide more non-agricultural jobs, such as manufacturing and commerce, in order to be able to accommodate the coming migrants.
Difficult adaptation funding choices may need to be made in future between either local-level climate adaptation initiatives, such as flood control in vulnerable districts, or providing affordable housing, land and services, and fostering employment for migrants moving from areas judged by residents to be too hazardous to remain in. The authors believe that further empirically grounded research along the lines presented in this paper can be used to suggest the districts most likely to witness an influx of internal migrants. Such projections may assist the national and district governments in Bangladesh to manage and prepare for future migration flows, thereby improving the country's adaptation to climate change.



