INTRODUCTION
Study of ionization dynamics and hydrodynamics of laser generated plasmas is fundamental for development of kinetic models describing plasmas under conditions that are out of local thermodynamic equilibrium (LTE). Predicting plasma parameters, such as electron temperature, density, and ionization stage distribution is critical for understanding laser absorption and radiation transport in high temperature plasma. Sophisticated modeling is required to calculate the charge distribution for high Z elements in non-LTE plasmas, as reported in a recent non-LTE kinetics code comparison workshop (Rubiano et al., Reference Rubiano, Florido, Bowen, Lee and Ralchenko2007). Over many years X-ray spectroscopy was proven to be a powerful diagnostic tool for determining the parameters of laser produced plasmas (Zigler et al., Reference Zigler, Givon, Yarkoni, Kishinevsky, Goldberg, Arad and Klapish1987; Winhart et al., Reference Winhart, Eidmann, Iglesias, Bar-Shalom, Minguez, Rickert and Rose1995; Shepherd et al., Reference Shepherd, Audebert, Chenais-Popovics, Geindre, Fajardo, Iglesias, Moon, Rogers, Gauthier and Springer2001; Welser et al., Reference Welser, Mancini, Koch, Izumi, Dalhed, Scott, Barbee, Lee, Golovkin, Marshall, Delettrez and Klein2003; Renaudin et al., Reference Renaudin, Blancard, Bruneau, Faussurier, Fuchs and Gary2006; Foord et al., Reference Foord, Glenzer, Thoe, Wong, Fournier, Albritton, Wilson and Springer2000; Fajardo et al., Reference Fajardo, Audebert, Yashiro, Gauthier, Chenais-Popovics, Renaudin, Peyrusse, Fortin and Shepherd2001; Labate et al., Reference Labate, Galimberti, Giulietti, Gizzi, Mumico and Salvetti2001, Reference Labate, Galimberti, Giulietti, Giulietti, Gizzi and Mumico2002; Yu et al., Reference Yu, Zhang, Li, Zhang, Jin, Lu, Li, Yu, Jiang, Li and Liu2005; Limpouch et al., Reference Limpouch, Renner, Krousky, Uschmann, Forster, Kalashnikov and Nickles2002; Abdallah et al., Reference Abdallah, Batani, Desai, Lucchini, Faenov, Pikuz, Magunov and Narayanan2007). Particular emission lines and features in a recorded spectrum are identified as belonging to particular charge state. The plasma parameters may be inferred by comparing modeled emission spectra for a range of ions to measured spectrum. Moreover, the plasma temperature and density may be estimated by comparing the experimental charge distribution with predictions based on collisional-radiative equilibrium (CRE) model (Renaudin et al., Reference Renaudin, Blancard, Bruneau, Faussurier, Fuchs and Gary2006; Foord et al., Reference Foord, Glenzer, Thoe, Wong, Fournier, Albritton, Wilson and Springer2000). Diagnosing the plasma by spectroscopic methods is especially appropriate for cases when experiments are influenced by two-dimensional effects, resulting from small focal spot compared to the expansion size, or non-uniform irradiation profile.
The use of X-rays line ratios of H-like, He-like, and Li-like in low Z plasmas, such as aluminum is common (Zigler et al., Reference Zigler, Zmora and Komet1977a, Reference Zigler, Zmora, Paiss and Schwob1977b; Aglitskii et al., Reference Aglitskii, Boiko, Vinogradov and Yukov1974; Gabriel, Reference Gabriel1972; Fajardo et al., Reference Fajardo, Audebert, Yashiro, Gauthier, Chenais-Popovics, Renaudin, Peyrusse, Fortin and Shepherd2001; Labate et al., Reference Labate, Galimberti, Giulietti, Gizzi, Mumico and Salvetti2001, Reference Labate, Galimberti, Giulietti, Giulietti, Gizzi and Mumico2002). For medium Z target, one can use line ratios of Ne-like or Na-like (Abdallah et al., Reference Abdallah, Batani, Desai, Lucchini, Faenov, Pikuz, Magunov and Narayanan2007) ions. The use of such a diagnostic tool for high Z plasmas is complicated and is rarely used (Mandelbaum et al., Reference Mandelbaum, Seely, Feldman, Brown, Kania, Goldstein, Kauffman, Langer and Bar-Shalom1992; Wyart et al., Reference Wyart, Bauche-Arnoult, Gauthier, Geindre, Monier, Klapisch, Bar-Shalom and Cohn1986). We present here the possibility of a diagnostic tool for the plasma parameters using Ni-like ion lines ratios of samarium spectra, and calculation of the fractional abundance of different ionization states.
In the present paper, spatially resolved X-ray spectra of expanding laser produced plasma of samarium are reported. Spectral lines emitted by Mn-like (Sm37+, ground 3d7) to Zn-like (Sm32+, ground 3d104s2) were identified (Louzon et al., Reference Louzon, Henis, Levi, Hurvitz, Ehrlich, Fraenkel, Maman and Mandelbaum2009). The ionization state and the fractional abundances of the dominant ions are calculated using a CRE model. Experimental line ratios of Ni-like samarium are compared with the prediction of a CRE model for this ion based on the Hebrew University Lawrence Livermore Atomic Code (HULLAC) computer package (Bar-Shalom et al., Reference Bar-Shalom, Klapisch and Oreg2001). The electron densities inferred from this analysis are in agreement with the results of hydrodynamic simulation of the samarium laser produced plasma.
SPATIALLY RESOLVED SPECTRA
Experimental Setup
The laser system used to produce the samarium plasmas included a Nd:YAG oscillator operating at 1.064 µm or 0.532 µm wavelength, followed by two Nd:YAG preamplifiers and three Nd:glass amplifiers. The laser pulse duration was in the range 1.5–2 ns. Pulses with energy of about 10–12 J were focused, at nearly normal incidence on the target by a 5 cm diameter lens, creating a spot size of about 40 to 60 µm. This results in laser intensity of about 6 × 10¹⁴ W/cm2 (with small variation between the different shots). The X-rays emitted by the laser generated plasma were separated from the visible light using two B10 foils, each consisting of 2 µm thickness polycarbonate film coated with 2000 Å of aluminum. The X-rays were dispersed by a rubidium acid phthalate (RbAP) crystal coupled to X-ray back-illuminated charge-coupled device (CCD) Andor camera (DX-434-BN). The spectral resolution is λ/Δλ ≈ 700, which is dominated by the source size (taking into account the Bragg angle of the crystal, the distance from the target L = 25 cm and the CCD pixel size δ = 13 µm). Spectra in the (7–10) Å wavelength range were collected in different shots, where the size of the CCD and the distance from the source allowed a spectral region of 1.5 Å to be investigated in each shot.
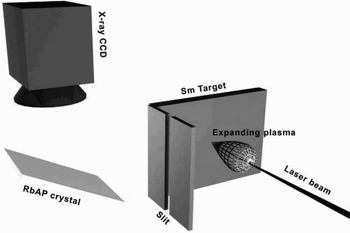
Wavelength calibration was obtained using known 1s-np transition lines of H and He-like ions of aluminum, sodium, and magnesium, resulting in wavelength accuracy of about 0.003 Å. Line intensities were corrected for the B10 transmission and the Andor camera spectral response. Spatial resolution was achieved by a small slit (about 30–20 µm) between the laser target and the X-ray detector. The slit was set perpendicular to the plasma expansion. In such a manner, one gets space resolution in the direction z perpendicular to the target plane. The experimental setup is shown in Figure 1. The recorded spectrum allows measuring the emitted line intensity as a function of the distance from the target. From geometrical considerations, the ratio of the detector-slit distance to the slit-target distance gives the relative spatial dispersion magnification.
Experimental setup used to measure spatial resolved spectra of samarium laser produced plasma.

Spectral Lines Identification
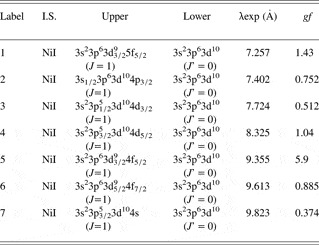
The X-ray spectrum is characterized by the prominent pattern of the transitions belonging to the Ni-like ions. Detailed analysis of samarium X-ray spectrum, based on ab-initio relativistic calculations using the HULLAC code is given by Bar-Shalom et al. (Reference Bar-Shalom, Klapisch and Oreg2001). In previous work, the 3d-nf (n = 4 to 7), 3p-4d, 3d-4p, and 3p-4s transitions emitted by Ni-like and neighboring samarium ions, from Mn-like to Zn-like ions, were identified (Louzon et al., Reference Louzon, Henis, Levi, Hurvitz, Ehrlich, Fraenkel, Maman and Mandelbaum2009). Many of the observed spectral features are unresolved transitions arrays (Bauche-Arnoult et al., Reference Bauche-Arnoult, Bauche and Klapish1979). Table 1 gives the identification of the spectral features of the Ni-like ion lines considered in this work. Due to the Ni-like closed shell 3p63d10 (J = 0) ground configuration, the characteristic spectrum of Ni-like ion includes well resolved lines that are well distinguished from other lines, leading to reliable lines ratios. The Ni-like 3d-4f resonance transition has the highest gf value (gf = 5.90, labeled ‘5’ in Table 1). The two next strongest gf value belongs to the 3d-5f (gf = 1.43, labeled ‘1’) and 3p-4d (gf = 1.04, labeled ‘4’) transitions. The ratio between these two lines can give a lower bound to the electron temperatures, as will be shown farther in this paper.
Identification of transitions in Ni-like ion in the spectrum of laser-produced samarium plasma in the range of (7–10)Å wavelength (Louzon et al., Reference Louzon, Henis, Levi, Hurvitz, Ehrlich, Fraenkel, Maman and Mandelbaum2009). The third and fourth columns give the upper and lower configuration of the transition. The measured wavelength of the transition is given in the next column

Sm34+ Ni-like Experimental Line Intensity Ratios
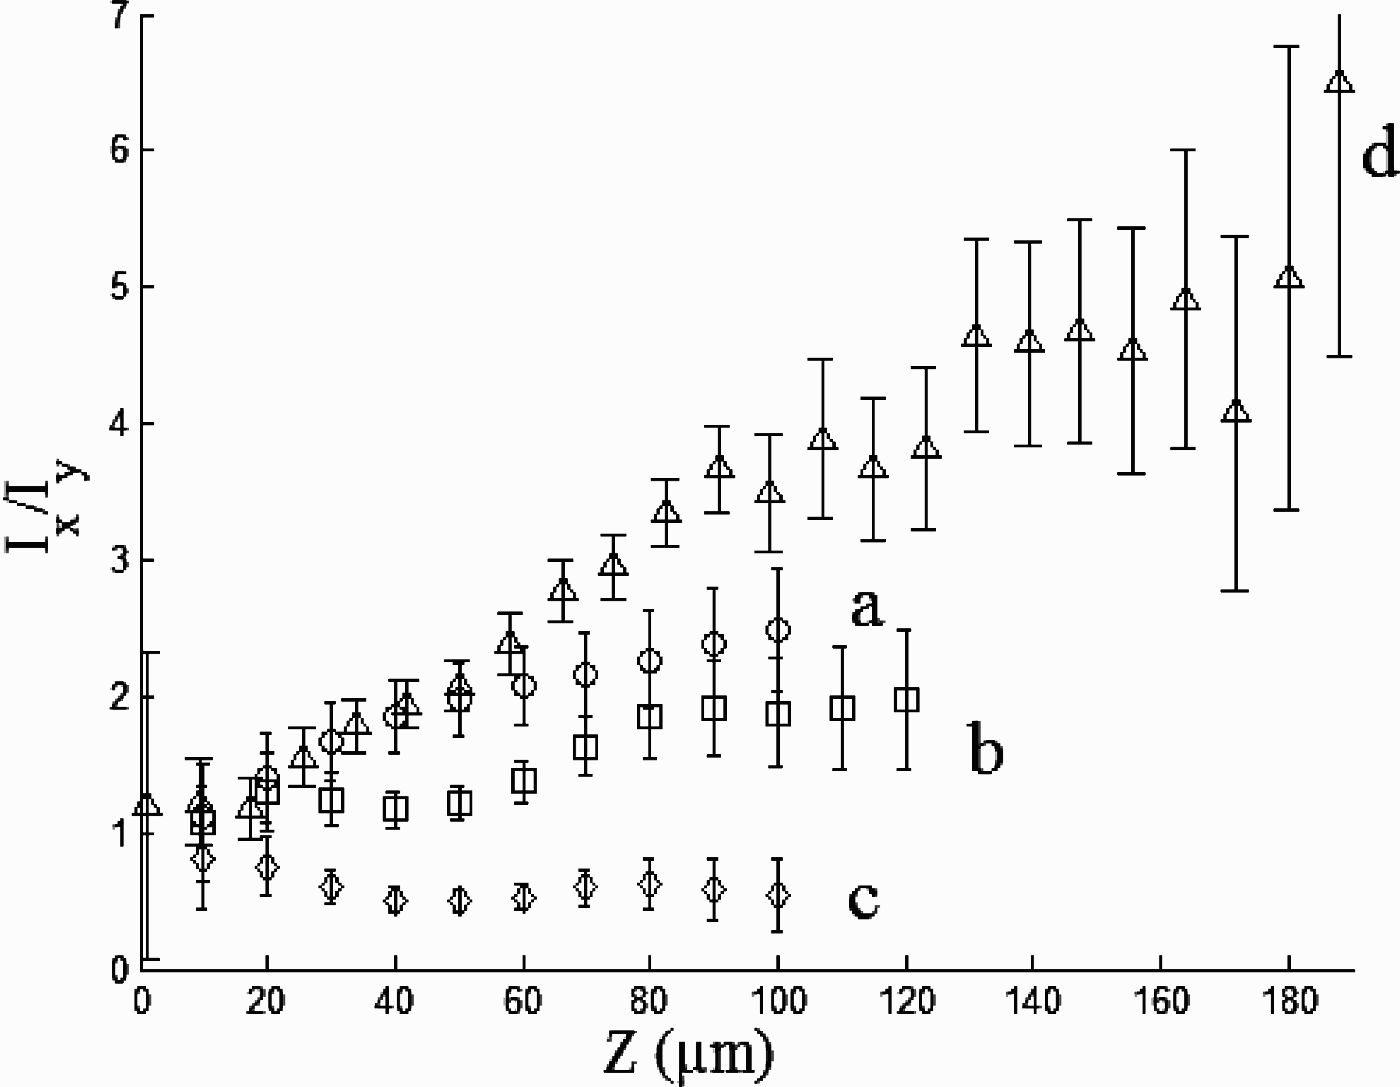
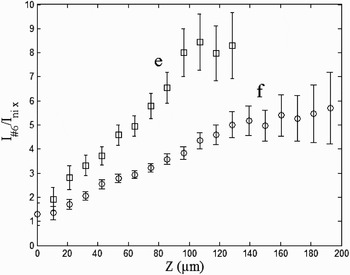
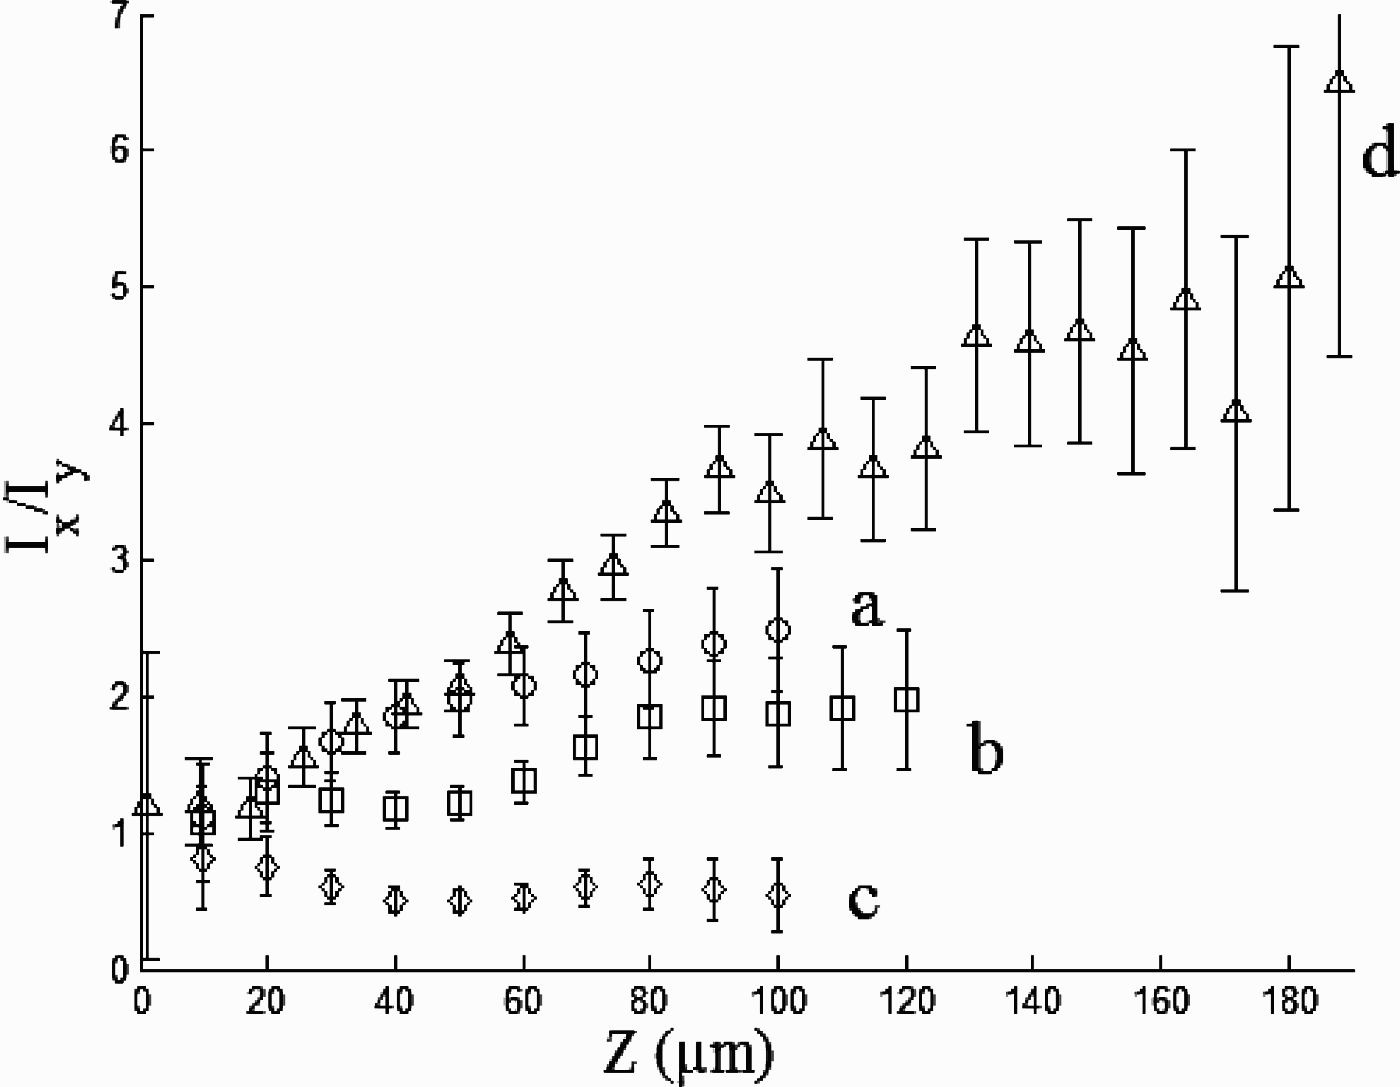
Consider line intensity ratios for the Ni-like Sm34+ ion. Figures 2 and 3 display several experimental line intensity ratios for this ion as a function of the distance from the original target position (in µm) for three different shots with incident laser intensity of 5.8 × 10¹⁴ W/cm2, 6.3 × 10¹⁴ W/cm2, and 6 × 10¹⁴ W/cm2. These results have been shown to be reproducible within 10% from shot to shot. The error bar in Figures 2 and 3 includes only the noise level error in each experiment. The Ni-like lines selected are mostly well separated from other lines in the resolved spectra.
Line intensity ratios of Ni-like (Sm34+) as a function of the target distance (30 µm slit, laser wavelength 0.532 µm). Lines “a” I 4/I 3, “b” I 4/I 1, and “c” I 2/I 1 (intensity of 6.3 × 10¹⁴ W/cm2) and line “d” I 5/I 4 (intensity of 5.8 × 10¹⁴ W/cm2).
Line intensity ratios of Ni-like (Sm34+) as a function of the target distance (20 µm slit, laser wavelength of 1.064 µm). Lines “e” I 5/I 7, “f” I 5/I 6 (intensity of 6 × 10¹⁴ W/cm2).

Figure 2 displays four Sm34+ line intensity ratios as a function of the distance from the target: “a” - I 4/I 3, “b” - I 4/I 1, “c” - I 2/I 1 and “d” - I 5/I 4 (the subscripts represent the line labels given in Table 1). The lines used for these ratios are well resolved lines arising from the 3d-5f, 3p-4d, 3p-4s, and 3s-4p Ni-like transitions. The incident laser intensity was 6.3 × 10¹⁴ W/cm2 for graphs “a”, “b”, and “c”, and 5.8 × 10¹⁴ W/cm2 for “d”, the laser wavelength 0.532 µm and the pulse duration 1.5 ns. One can observe that the “a” and “b” ratios increase monotonically from an initial value of about 1 at distances less than 20 µm to a value of 2.5 for line “a” and 1.9 for line “b” at distance of 100 µm. The ratio “c” slightly decreases from an initial value of 0.8 and decreases to almost constant value around 0.5. The line ratio “d” has an initial constant value of about one. At distance of about 15 µm from the target this line ratio begins to increase as a function of the distance from the target to a value of about 6.5 at 190 µm.
Figure 3 displays the line ratios “e” - I 5/I 7 and “f” - I 5/I 6 obtained at 6 × 10¹⁴ W/cm2 laser intensity, 1.064 µm wavelength and 2 ns pulse duration. These two ratios increase from a value of 2 (“e”) and 1.3 (“f”) to 8.5 (at 120 µm) for “e” and to 5.7 at 200 µm for “f”.
COMPARISON WITH AB-INITIO COMPUTATIONS
Theoretical Model for Ni-like Sm34+
A model of the Ni-like ion has been developed using the HULLAC atomic physics computer package (Bar-Shalom et al., Reference Bar-Shalom, Klapisch and Oreg2001). The atomic structure is calculated using the relativistic multi-configuration parametric potential method. The model included 397 levels from the following configurations: 3s23p63d10, 3s3p63d10nl, 3s23p53d10nl, 3s23p63d9nl (where n = 4–7, and l = s, p, d, f). All E1, E2, M1, and M2 radiative decay coefficients between the levels were included. The electron-impact excitation cross sections and rate coefficients are calculated in the distorted wave approximation implemented efficiently using the factorization-interpolation method. Self absorption of the lines has been taken into account using a simple escape factor treatment (Goldstein et al., Reference Goldstein, Oreg, Zigler, Bar-Shalom and Klapisch1988) this involves a correction to the Einstein coefficients appearing in the equations for the populations of the excited states of the Ni-like ion by

The “escape factor” ɛij is given by

Where the optical depth at the line center for the transition j → i is

The Doppler width at the ion temperature Ti is ΔD(T i), fij is the oscillator strength of the transition, n i is the population density of the absorbing state, and L is the half width of the plasma column. The coupled quantities n i and ɛij were determined by iteratively solving the rate equations until the level population converged. This is an approximation of the effects of self absorption which ignores the effects of density, temperature and velocity gradients in the plasma.
The ranges of electron temperatures and densities relevant to the experiments considered here were calculated using a one-dimensional code that solves Lagrangian hydrodynamics together with multi-group radiation diffusion. This code was used in combination with an atomic physics code, based on a steady-state screened hydrogenic ion model, which generates non-LTE average ionization and opacity tables for the hydrocode. Simulation of the samarium laser produced plasma indicates that Ni-like samarium dominates the plasma ions stages at temperatures in the range of 500–850 eV. The plasma electron densities consistent to the distances from the original position of the target measured in the experiments were in the range of 1020–1022 cm−3.
Comparison of Measured and Computed Line Intensity Ratios
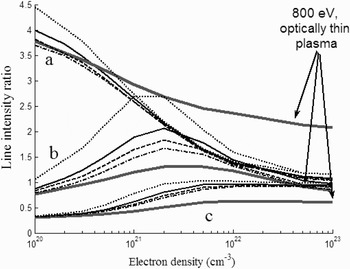
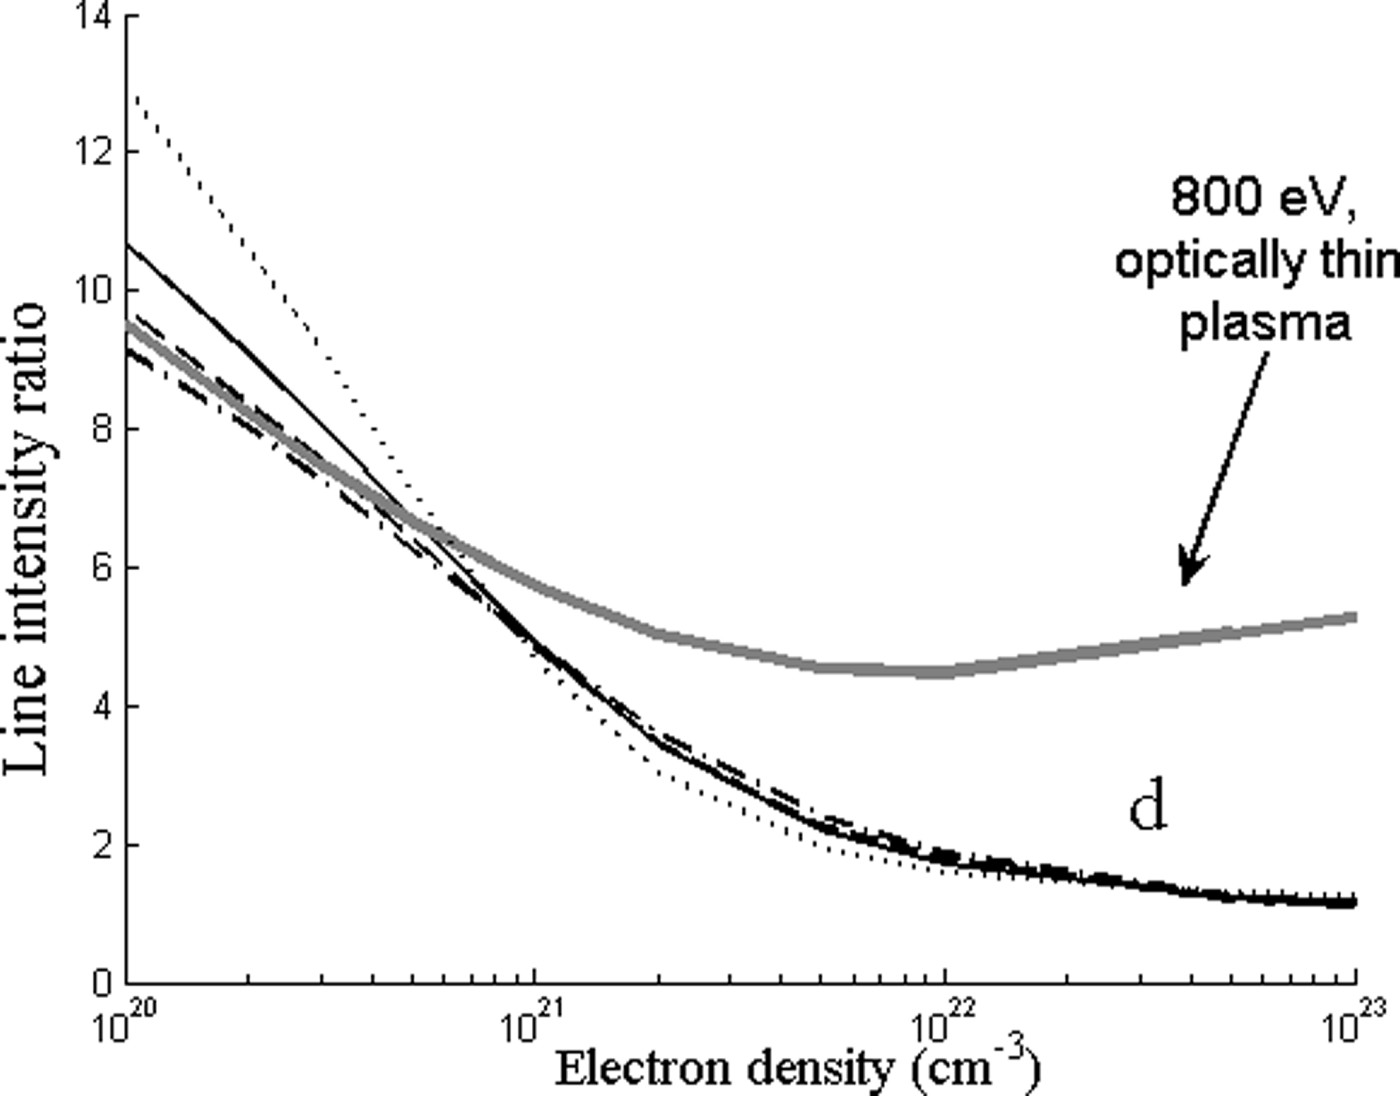
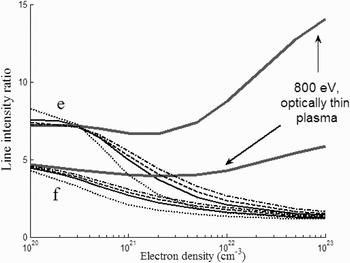
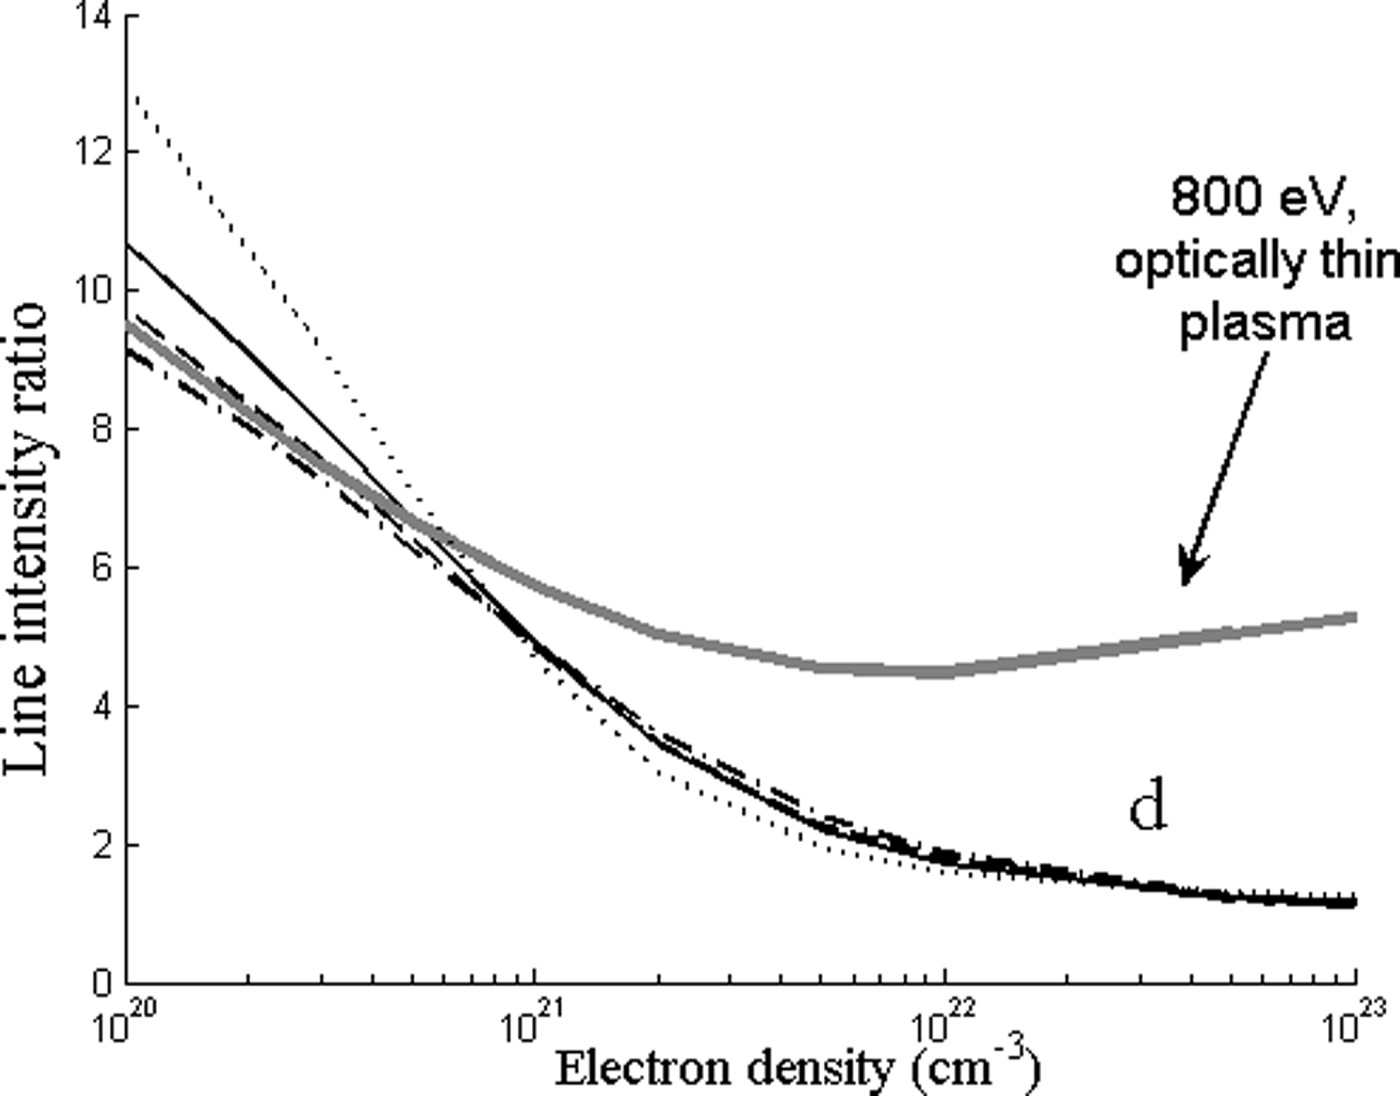
Figures 4 to 6 displays the results of the computed Ni-like Sm34+ line intensity ratios as a function of the plasma density. Calculations were done for optically thin plasma and including absorption. In the calculation of absorption, it was assumed that the ion temperature is equal to the electron temperature. Several values were used for the plasma length: 30 µm (the focal spot diameter), 100 µm, 200 µm, and 300 µm (the maximum measured plasma expansion). The abundance of the absorbing ions was taken to be 0.3, close to the fractional abundance of the Ni-like ions. In Figures 4 to 6, the gray solid lines display results assuming optically thin plasma at an electron temperature of 800 eV, while the other graphs are calculated including line absorption for the following values of electron temperatures: 400 eV (dot line), 600 eV (solid), 800 eV (dash line), 1000 eV (dash-dot line).
Modeling results of the line intensity ratios for different temperatures, 400 eV (black dot line), 600 eV (black solid line), 1000 eV (black dash-dot line), taking into account self-absorption, for plasma dimension L = 200 µm. The groups of lines stand for “a” I 4/I 3 or “b” I 4/I 1 or “c” I 2/I 1. The gray solid line corresponds to optically thin plasma at 800 eV.

Modeling results of the line intensity ratio for “d” I 5/I 4, 400 eV (black dot line), 600 eV (black solid line), 1000 eV (black dash-dot line), taking into account self-absorption, for plasma dimension L = 200 µm. The gray solid line corresponds to optically thin plasma at 800 eV.
Modeling results of the line intensity ratios corresponding to “e” I 5/I 7 and “f” I 5/I 6, for different temperatures, 400eV (black dot line), 600 eV (black solid line), 1000 eV (black dash-dot line), taking into account self-absorption, for plasma dimension L = 200 µm. The gray solid line corresponds to optically thin plasma at 800 eV.

The “a” (I 4/I 3), “b” (I 4/I 1), and “c” (I 2/I 1) line intensity ratios are first considered (Fig. 4). The experimental line intensity ratio “a” increases monotonically from 1.5 at a distance of 20 µm from the target (see Fig. 2) to 2.5 at distance 100 µm. Comparison with the prediction of the theoretical model for Te = 800 eV yields electron density from 1021 to 1022 cm−3. The values of the experimental ratio “a” close to the focal region cannot be reproduced by the theoretical model, without considering absorption. It is seen that the line intensity ratio “a” is almost insensitive to the electron temperature between 400 < Te < 1000. For lower temperatures, such as Te = 150 eV, the ratio “a” increases to values higher than the experimental ratio, 1.8 at ne = 5 × 1022 cm−3 to 7 at ne = 1 ×1020 cm−3.
The experimental line intensity ratio “b” is almost constant at a value of one up to distance of about 40 µm from the target, then increases to about a value of 1.9 at 80 µm and become constant again. For optically thin plasma, the computed line intensity ratio “b” as a function of the electron density increases from 0.75 at 1020 cm−3 to a maximum of 1.25 at 5 × 1021cm−3 and decreases from this maximum to 0.79 at 1023cm−3. The maximum value of the calculated ratio including absorption for Te = 800 eV is two. Thus, calculation of this line ratio without taking into account self-absorption yields values lower by a factor of two than the experimental value. For electron temperature less than 500 eV, this intensity ratio is sensitive to the electron temperature and gives, a value higher than 1.3 in the relevant electron density range. The sensitivity of line “b” to lower electron temperatures was tested at a lower laser intensity (5 × 10¹³ W/cm2) using the time and space integrated results reported by Louzon et al. (Reference Louzon, Henis, Levi, Hurvitz, Ehrlich, Fraenkel, Maman and Mandelbaum2009). In this experiment, the line ratio “b” was 2.5, in agreement with prediction of the model presented here for temperatures lower than 400 eV.
The computed “c” line ratio as a function of the electron density, calculated without absorption, increases from 0.31 at 1020cm−3 to a maximum of 0.62 at 1 × 1022cm−3 and decreases to the value 0.59 at 1 × 1023cm−3. Calculation with absorption yields higher maximum values for this ratio. On the other hand, the experimental line ratio decreases from a value of 0.8 near the target to 0.52 at 100 µm. Comparison between the experimental and calculated ratios up to distance of about 100 µm from the target infers an electron density between 1021 to 1022cm−3. Since the dependence of the “c” intensity ratio on the electron density is relatively weak, the deduced electron density may have, in this case, quite large error bars and cannot be used for as diagnostic line ratio for the electron density.
Figure 5 displays the computed line ratio “d” (I 5/I 4). The computed line intensity ratio without absorption decreases from a value of 8.95 at an electron density of 1020cm−3 to a minimum value of 4.42 at 5 × 1021cm−3 and increases then to 5.15 at 1023cm−3 (for Te = 800 eV). The measured line ratio increases from a near target value around one to a maximum value of 6.5 at large distances from target. The near target intensity ratio cannot be reproduced by the thin plasma model. This discrepancy could not be solved by changing the electron temperature in the theoretical model in a wide range. The addition of absorption yields line intensity ratios close to the experimental ratios close to the target. The electron density corresponding to the highest value of this ratio may be about 6 × 1020cm−3. For densities above 5 × 1020cm−3 line ratio “d” is insensitive for the considered temperature range 400 < Te < 1000. For lower temperatures (not displayed in Fig. 5), the calculated ratio “d” including absorption cannot reproduce the experimental value. For densities lower then 5 × 1020cm−3, this line become more sensitive to the electron temperatures. In the experiment reported by Louzon et al. (Reference Louzon, Henis, Levi, Hurvitz, Ehrlich, Fraenkel, Maman and Mandelbaum2009), this line ratio was 18 at low laser intensity (5 × 10¹³ W/cm2). Analysis of the above lines ratios leads to a lower limit of 200 eV for the electron temperature.
Figure 6 displays the line ratio “e” (I 5/I 7) and “f” (I 5/I 6). Without absorption, the computed line ratio “e” is almost constant at a value of seven in the electron density range from 1020 to 2 × 1021 cm−3. For higher electron densities, this computed ratio increases to 14 at 1023cm−3. This increase with the electron density is opposite to the experimental ratio behavior, which decreases close to the target. Adding absorption, results in decrease of line intensity ratio “e” with increasing density. The graphs for different values of the electron temperature reach different values at high densities.
The computed line ratio without absorption “f” is almost constant at a value of 4.8 in electron density range from 1020 to 2 × 1021 cm−3. For higher electron densities, the computed ratio increases slightly to six at 1023cm−3. Similar to line “e”, the experimental ratio decreases closer to the target, i.e., at increasing densities. Here also, the measured line ratio cannot be reproduced by theoretical computations without absorption. The calculated line intensity ratio including absorption changes monotonically is similar to the shape of the experimental ratio and infers an electron density in the range 1022–1020 cm−3.
We note that lines ratios “e” and “f” where deduced from experiments conducted at different laser conditions (wavelength 1.064 µm, pulse duration 2 ns) than line ratios “a”–“d” (0.532 µm, 1.5 ns). Therefore, the plasma expansion may be different in the two sets of experiments. Moreover, the lines ratios “e” and “f” are less insensitive to electron temperature than lines ratios “a”–“d”. However, lines ratios “e” and “f” are considered here to show the strong self absorption effect of lines in the experiments reported here.
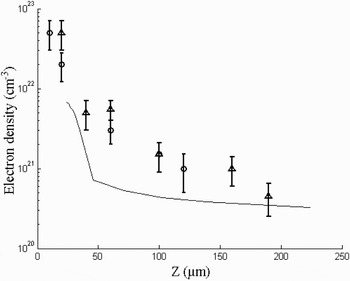
Using the above theoretical model for the measured line intensities ratios, one can plot the electron density as a function of distance from the original position of the target. Such a graph is displayed in Figure 7, based on the experimental ratios “a”, “b” (hollow circle), and “d” (hollow triangle), obtained in two different experiments with similar laser parameters and slit size. This figure shows also the electron density obtained at the end of the laser pulse from one-dimensional planar hydrodynamic simulation of the interaction of a laser pulse with intensity 1014 Wcm−2, wavelength 0.532 µm, pulse duration 1 ns with samarium (black solid line). The electron density obtained in the simulation is lower than the density deduced from the lines intensity ratios. Possible reasons for this discrepancy are the following: As suggested in Lebate et al. (2002), close to the target the electron density calculated using a one-dimensional planar simulation is lower than that obtained from two-dimensional or one-dimensional with spherical geometry simulation, which are more appropriate to model the experiment. Second, the spectra measured in the experiment are time integrated, while the electron density obtained is time resolved.
Electron density as a function of the distance from the target based on the experimental ratios “a”, “b” (hollow circle), and “d” (hollow triangle). Also shown is the electron density obtained from the simulation of one-dimensional hydro-code for pulse laser intensity 1014 W/cm2 (solid line).

SUMMARY
Measured line intensity ratios of transitions 3d-5f, 3p-4d, 3p-4s, and 3s-4p in Ni-like samarium are compared with calculations performed with a collisional radiative model based on HULLAC atomic physics code. This comparison indicates that certain line intensity ratios, such as for transitions 3p-4d, can be used for electron density diagnostic in the range 1020–1022 cm−3. The line intensity ratios are not very sensitive to the electron temperature in the range of 500eV < Te < 800eV. In this temperature range it is obtained, using a CRE model for all samarium ions, that Ni-like samarium is the dominant ionization stage. For lower temperatures, the experimental line intensity ratios cannot be reproduced using the CRE model for Ni-like ions. In addition, it is shown that self absorption effects are important, especially for the resonance line of the 3d-4f transition (line label 5, in Table 1).
ACKNOWLEDGMENT
We thank Dr. Yehuda Nafha for reading the manuscript and useful discussions.