I. INTRODUCTION
The effectiveness of high-performance fibers is measured with respect to their ability to absorb the energy locally and spreading out the absorbed energy fast before local conditions for failures are met. It is therefore seen that two properties of fibers are critical for resistance to high-energy impact (V50) applications (i.e., lightweight ballistic plates, bulletproof helmet and vest, shielding for armored vehicles, composite materials for aviation and space flights); the toughness of the fiber ( ${{{\rm{\sigma }}_{\max } {\rm{\varepsilon }}_{\max } } \over {2{\rm{\rho }}}}$) per unit mass and the strain wave velocity (
 $\sqrt {E/{\rm{\rho }}} $) through the fiber.Reference Jacobs and Dingenen1, Reference Grujicic, Glomski, He, Arakere, Bell and Cheeseman2 The cube root of the product of these two properties is defined as normalized velocity (
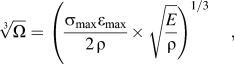
 $\root 3 \of \Omega $), a fiber property to gauge the performance of fibers in armor applications.Reference Phoenix and Porwal3 The normalized velocity is expressed as:
 $$\root 3 \of \Omega = \left( {\left. {{{{\rm{\sigma }}_{\max } {\rm{\varepsilon }}_{\max } } \over {2{\kern 1pt} {\rm{\rho }}}} \times \sqrt {{E \over {\rm{\rho }}}} } \right)^{1/3} ,} \right.$$
where σmax, εmax, E, and ρ are the ultimate tensile strength, failure strain, modulus, and density, respectively. It is evident from Eq. (1) that the magnitude of  $\root 3 \of \Omega $ will be very high for a material that exhibits high stiffness, high strength, high strain-at-failure, but low density. Increase in εmax increases the toughness of the fiber substantially. However, this increase in failure strain does not mean that the V50 will actually increase. For instance, if the failure strength (σmax) decreases, simultaneously, the V50 could decrease overall. Note that for decreasing fiber strength, the fiber modulus must decrease and so the strain wave velocity and
 $\root 3 \of \Omega $. On the other hand, increase in strength and modulus will reduce the failure strain, which will eventually have a detrimental effect on the fiber’s ability to absorb strain energy. Spectra and Dyneema, which is made from ultra high molecular weight polyethylene (UHMWPE), have the lowest density of all the fibers, which are currently used for armor applications. Compared to Kevlar or nylon, Dyneema have higher normalizing velocity (800–887 m/s range) and almost equal to that of Zylon AS. Zylon fibers have not been used for military applications because of their high strength degradation in elevated temperatures, moisture, and exposure to the ultraviolet and visible light.Reference Lane4 Fibers based on UHMWPE have higher V50than Kevlar fibers per equivalent weight. Because of their higher normalizing velocity, Spectra and Dyneema can provide a higher level of protection at the same thickness of Kevlar. However, normalizing velocity of these fibers is still low, therefore limiting their wholesale application without a secondary metallic or ceramic component. The idea in this investigation was to develop methodologies so that the normalizing velocity of UHMWPE-based fibers can be increased by substantial margin. This would allow manufacturing of an all-fabric system for armor applications.
Over the last several years, researchers have successfully dispersed carbon nanotubes into thermoplastic polymers demonstrating that strength and modulus have improved significantly. Tensile strength and modulus of low density polyethylene (LDPE) increased by 34% and 38%, respectively, with the infusion of 2 wt% of multiwalled carbon nanotubes (MWCNTs).Reference Mahfuz, Adnan, Rangari and Jeelani5 Strength and modulus of nylon 6, infused with 1 wt% of MWCNTs, increased by 220% and 164%, respectively.Reference Mahfuz, Adnan and Rangari6 However, in both cases, there was significant reduction in fracture strain, which eventually decreased the energy absorption capacity by 30–50% range. Observations were also made on the tensile properties enhancement of UHMWPE in the highly aligned composite fibers containing 5 wt% of MWCNTs. In comparison with the pure UHMWPE fiber at the same draw ratio, tensile strength increased by 18.8%.Reference Ruan, Gao and Yu7 Increase of 58% in elastic modulus was observed for pristine UHMWPE coating when reinforced with 0.2% of single-wall carbon nanotubes (SWCNTs). Increased thermal stability was also observed with increasing SWCNT content.Reference Samad and Sinha8 In another report, it was revealed that the modulus and ultimate tensile strength increased by about 100% with 2 wt% of carbon nanotubes (CNTs). However, elongation at break decreased. This decrease was relatively fast for low concentrations of SWCNTs and levels off above 1 wt%.Reference Mierczynska, Mayne-L’Hermite, Bioteux and Jeszka9 On the other hand, our previous work on LDPE has revealed the fact that dispersing a second polymer phase can be used to enhance the fracture strain and toughnessReference Khan, Mahfuz, Leventouri, Rangari and Kyriacou10 of the matrix polymer. A look at the properties of nylon and Dyneema fibers provided a meaningful insight. Strength and modulus of UHMWPE-based fibers are almost an order higher compared to that of nylon. The molecular chain of UHMWPE can consist of as many as 200,000 ethylene (–CH2–) repeat units forming a very strong linear structure with a molecular weight of 3–6 million g/mol.Reference Kurtz, Muratogiu, Evans and Edidin11 On the other hand, fracture strain of nylon fibers is one order higher than that of UHMWPE. Nylon is made from caprolactam, which is a cyclic amide with six carbon atoms. Nylons have relatively low crystallinity compared to UHMWPE. Their intercrystalline amorphous layers play a major role in the activation of plasticity in the material.Reference Miri, Persyn, Lefebvre and Seguela12 Preformed nylon particles were used to increase the fracture toughness of the epoxy–SWCNT composites. The epoxy–SWCNT–nylon composites exhibited simultaneously improved stiffness, strength, and toughness.Reference Sun, Warren, Davis and Sue13 Composite fibers fabricated from in situ polymerization of caprolactam with SWCNTs possessing amide group (CONH2) increase the composite flexibility and toughness.Reference Gao, Zhao, Itkis, Bekyarova, Hu, Kranak, Yu and Haddon14 Moreover, SWCNT with their exceptionally high strength and modulus (1.5 TPa) will certainly contribute to the strength and modulus of the fiber. SWCNT can also act as strong nucleation agent for thermoplastic polymers. Polyethylene can epitaxially crystallize on CNTs. High-energy polymeric structures exist near the interface because of the strong chemical, the dipole-induced, or the van der Waal interactions between macromolecules and the inorganic substrates.Reference McCarthy, Coleman, Curran, Dalton, Davey, Konya, Fonseca, Nagy and Blau15 The incorporation of SWCNTs accelerates the crystallization rate of nylon 6 due to its strong nucleation effect.Reference Naffakh, Marco and Gomez16 It is therefore possible that this dual reinforcement of nylon and SWCNT into the precursor fiber will increase the normalizing velocity of UHMWPE. From the quantum energy concept, this exchange of molecular features should be possible since both polymers transition from liquid to solid over a wide range of temperatures allowing an opportunity to exchange such features.
It has also been revealed that the ability of the polymer fibrils to undergo molecular orientation through strain hardening can greatly enhance the strength and stability of the craze structure.Reference Brown17, Reference Kinloch and Young18 Strain hardening in polymers is thought to be mainly due to the effects of orientation. Since UHMWPE has higher chain entanglement, it is likely that strain hardening effect will be more. It has been reported that inclusion of CNTs can further increase polymers hardening. As reported in Ref. Reference Zhao, Hu, Justice, Schaefer, Zhang, Yang and Han19, PA-6 composites reinforced with MWCNTs have exhibited more postyield hardening than neat PA-6. It was reported that MWCNTs acted as tie molecules to induce strain hardening effects.Reference Ruan, Gao and Yu7 It was also reported that strong shearing formed shish-kebab oriented structure in polyethylene. Shish-kebab structure enhanced in the presence of SWCNTs even in the low shearing.Reference Patil, Balzano, Portale and Rastogi20 Following this idea of strain hardening in a hybridized fiber, attempts were made to improve upon the normalized velocity of the UHMWPE filaments. In this investigation, we have reinforced UHMWPE with nylon 6 and SWCNT through a solution spinning process and developed fibers. The developed fibers were then strain hardened through consecutive loading–unloading cycles.
II. SYNTHESIS AND FABRICATION
Commercial grade UHMWPE powder, paraffin oil and antioxidant (2,6-di-t-butyl,4-methylcresol), and SWCNTs were procured from Sigma Aldrich (Milwaukee, WI ). The average density, melting point, and molecular weight of UHMWPE were 0.94 g/cm3, 138 °C, and 3 × 10⁶ g/mol, respectively. SWCNTs were 2–10 nm in diameter and were approximately 1–2 μm long. The density of SWCNTs was about 2.6 g/cm3. SWCNTs were not functionalized with any chemical group. Nylon 6 was procured from UBE Industries, Ltd. (Tokyo, Japan). Average density, melting point, and molecular weight of nylon 6 were 1.14 g/cm3, 220 °C, and 20 × 103g/mol, respectively. All categories of filaments were fabricated using a Laboratory Mixing Extruder (LME). The extrusion apparatus included a coaxial cylinder, a turning rotor heater, an outlet die, an orifice, a hexane bath, an oven, and a filament take-up system. Three types of filaments were produced (i) neat UHMWPE, (ii) UHMWPE with 2.0 wt% of SWCNT, and (iii) UHMWPE with 2.0 wt% of SWCNT and 20.0 wt % of nylon 6. To synthesize neat UHMWPE filaments (type-1), 95.0 wt% of paraffin oil was mixed with 5.0 wt% of UHMWPE using a VDI-25 homogenizer. After mixing for about 15 min, the admixture was fed into the LME hopper and passed through the annular zone between the cylinder and the turning rotor. The solution was simultaneously heated to 150 °C using the turning rotor. At this stage, the solution turned into a viscous gel, and as the rotation continued, it flowed into the outlet die and exited through a 3-mm orifice. After extrusion, filaments were rinsed through a hexane bath, passed through a heater (100 °C), and drawn into the take-up spindle (filament winder) with controlled stretching. Hexane was used to extract paraffin oil from the gelled filament as it came out of the extruder. After filaments were collected in the filament winder, they were cut into strands and subjected to a secondary heating at 60–70 °C in a separate oven for a prolonged period of time (∼48 h). The secondary heating was necessary to remove residual paraffin oil from the filament. For type-2 filaments, ratio of paraffin oil, UHMWPE, and SWCNTS was 95.0, 4.9, and 0.1 wt%, respectively. SWCNTs were first dispersed into paraffin oil using a VCX-500 ultrasonic processor for about an hour. After sonication, UHMWPE was mixed with the solution using the homogenizer. Filaments were then extruded using the previous procedures. In type-3, ratio of paraffin oil, UHMWPE, nylon 6, antioxidant, and SWCNTs was 94.5, 3.92, 0.98, 0.5, and 0.1 wt%, respectively, and filaments were produced using steps similar to type-2. Weight percentages mentioned above conform to 20.0 wt% of nylon 6 and 2.0 wt% of SWCNTs as required in respective categories after paraffin oil is removed.
III. EXPERIMENTAL
Once the filaments were produced, they were tested under tension using a Zwick-Roell material testing machine according to ASTM D3379-75. Diameters of the filaments were measured using a scanning electron microscope (SEM). Tests were run at a constant crosshead speed of 2 mm/min using a 20-N load cell. A gage length of 30 mm was generally used. About 10 individual filaments were tested in each category. To visualize the hysteresis effect of loading, samples were strain hardened through a series of loading–unloading cycles using the same material testing machine. Strain hardening tests were simple tension tests in which samples were first loaded up to a point slightly beyond the yield point and then unloaded to zero load level. This completed the first loop. In the next step, samples were loaded again to a higher point, incremented by both load and deflection followed by another unloading. This formed the second loop. A tensile residual strain remained after each loading–unloading cycle. Such loading and unloading continued until the fiber failed. During these loading–unloading cycles, diameter of the filament specimen changed continuously. To evaluate the true stress during the strain hardening process, the change in diameter of the filaments were calculated after each loading–unloading cycle using the following equation:
 $$d_f = d_{{\rm{in}}} (1 - v{\rm{\varepsilon }}),$$
where df is the actual diameter, d in is the initial diameter of the filament, ν is the poison’s ratio of the filament, and ε is the longitudinal strain in the filament after each loading–unloading cycles. Poisson’s ratios of individual filaments were evaluated experimentally. To calculate ν, change in the lateral dimensions was measured using the SEM. A set of hysteresis curves for each category of fibers was generated in this manner. True strain ( $\hskip2pt{\rm{{\hskip1pt\vskip-3pt\tilde}{\hskip-2pt\varepsilon}}}\hskip1pt$) was calculated using the relation,
 $\hskip2pt{\rm{{\hskip1pt\vskip-3pt\tilde}{\hskip-2pt\varepsilon}}} = \ln (1 + {\rm{\varepsilon }})$,Reference Dowling21 where ε is the measured engineering strain. Maximum true stress at each loading–unloading cycles and the corresponding true strain were plotted in logarithmic scale. The plot depicted σ = Kεn, where σ is the true stress, ε is true strain, n is strain hardening exponent, and K is the strength coefficient. Values of n and K were tabulated.
Differential scanning calorimetry (DSC), SEM, and Raman analysis were carried out to investigate morphology and deformation behavior. DSC ramp tests were carried out under inert atmosphere with a heating and cooling rate of 10 °C/min using a TA Q10 DSC apparatus. SEM analyses were performed in a D8303 Quanta 200 SEM. Raman spectra of individual filaments were obtained using a T64000 spectrometer with 514.5-nm line of argon ion laser and a highly sensitive charged couple device.
IV. RESULTS AND DISCUSSION
A. Tensile tests
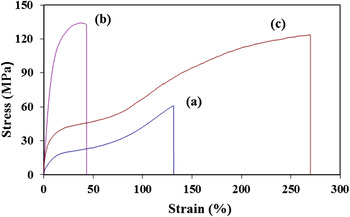
Representative stress–strain diagrams and the data from tensile tests are shown in Fig. 1 and Table I. It has been observed that with the infusion of SWCNTs, the Young’s modulus, yield strength (0.2% offset), and ultimate tensile strength increased by 458%, 450%, and 120%, respectively. Strain to fracture reduced by 68%. Normalized velocities were calculated using the property values from Table I. The densities of the composites were determined using the rule of mixture. As seen in Table I, normalized velocity was 277 m/s for neat filament. It has increased only by 16% with the inclusion of SWCNTs. Reduced fracture strain restricted the composite’s ability to absorb energy even though there was significant increase in strength and modulus. However, when nylon 6 was dispersed in the SWCNT reinforced matrix, normalizing velocity increased to 522 m/s, which is 88% increase from the control sample. Such improvement in normalizing velocity was mainly because of the increase in fracture strain of the composites. Failure strain increased by 107% due to the addition of the nylon phase. It is evident in Fig. 1 that three categories of filaments have distinctive pattern in their stress strain response. Figure 1(a) shows a single-stage plateau with moderate increase in strength level, while Fig. 1(b) demonstrates a spiky increase in strength without the presence of any plateau. Former category [Fig. 1(a)] is indicative of being plastic in nature, while the latter [Fig. 1(b)] is relatively brittle. On the other hand, curve [Fig. 1(c)] has two distinct plateaus. It suggests that the strength of the material continues to increase with increased deformation demonstrating strain hardening capability of the material.Reference Mahfuz, Khan, Leventouri and Liarokapis22 Accordingly, we see remarkable increase in strength level during the 2nd plateau in the three-phase system (UHMWPE–SWCNT–nylon 6).
Stress–strain curves of: (a) UHMWPE, Type-1, (b) UHMWPE–SWCNT, Type-2, and (c) UHMWPE–nylon 6–SWCNT, Type-3.

Tensile tests data.

B. Strain hardening
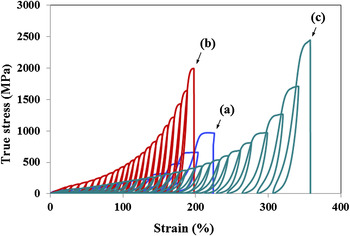
Figure 2 shows the representative true stress versus strain hysteresis curves for three categories of filaments. Elastic properties were evaluated at the last loading cycle just before the failure of the filament and are shown in the Table II. The strength level shows an increase for all kinds of samples after several hysteresis loops. The increase in strength is clearly higher in nanophased samples compared to neat as can be seen in Fig. 2. It is also seen that around 200% strain was possible for both neat and UHMWPE–SWCNT filaments through repeated loading–unloading cycles. At such large strain, both strength and modulus were also higher. Ultimate tensile strength and modulus of neat UHMWPE samples increased to nearly 1 and 4 GPa, respectively. On the other hand, failure strain reduced to 67% from 130%. The normalizing velocity calculated for neat UHMWPE after strain hardening was 883 m/s. This is an identical value with that of Dyneema. When filaments with SWCNTs (type-2) were strain hardened, ultimate tensile strength and modulus increased to roughly 2 and 14 GPa, respectively. However, in this case, enhancement in the normalizing velocity was very modest. Even though the improvement in strength and modulus was spectacular, at the same time, reduction in fracture strain was also higher. Fracture strain reduced to approximately 23%. When nylon 6 was added (type-3), strain hardening procedure allowed almost 360% of strain as observed in Fig. 2. The strength and modulus of filament was 2.5 and 9.5 GPa, respectively, after strain hardening. It is to be mentioned that strength of the three-phase system (UHMWPE–SWCNT–nylon 6) was higher than that of the two-phase system (UHMWPE–SWCNT) even though modulus decreased slightly. However, strain to failure increased significantly in the three-phase system (type-3). Normalizing velocity was calculated 1226 m/s for the three-phase system. If we compare with Spectra and Dyneema, the normalizing velocity of type-3 filament is about 58% and 38% higher, respectively.
Cyclic true stress–strain hysteresis curves of (a) UHMWPE, Type-1, (b) UHMWPE–SWCNT, Type-2, and (c) UHMWPE-nylon 6–SWCNT, Type-3.

Data after strain hardening tests.

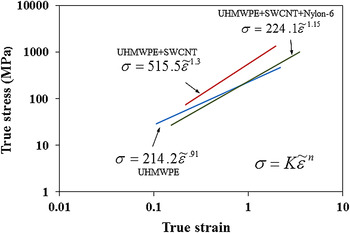
To assess the strain hardening behavior further, true stress versus true strain curves are shown in logarithmic scale in Fig. 3. Strain hardening exponent, n, and strength coefficient, K, for each categories of filaments are shown in Fig. 3. Exponent n is the indicator of increase in strength of a material due to plastic deformation. It is an important parameter reflecting material’s hardening ability and regarded as a measure of the rate of strain hardening. Higher value of n in UHMWPE–SWCNT samples suggests larger degrees of strengthening for a given strain. The strength coefficient, K, determines the magnitude of true stress in the large strain region. Value of K is almost doubled in SWCNT reinforced samples. It is therefore clear that SWCNT induces strain hardening capability in UHMWPE filaments. It has been also seen from Fig. 3 that n and K decrease in the hybridized filament (UHMWPE–SWCNT–nylon 6) if compared with UHMWPE–SWCNT filaments. However, n and K are slightly higher in the hybridized filament if compared with neat UHMWPE.
Log–log plot of true stress–true strain.

C. DSC analysis
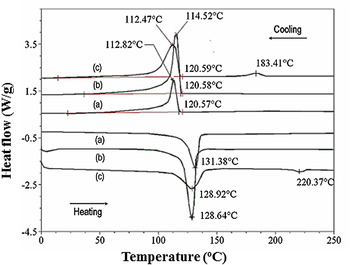
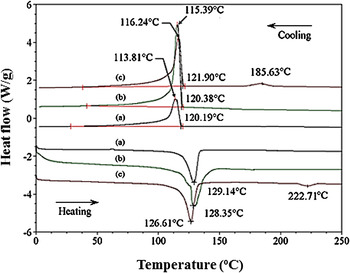
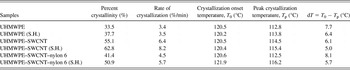
DSC heating and cooling curves are shown in Figs. 4 and 5 before and after strain hardening, respectively. Each figure shows two curves (heating and cooling) for each of the three categories of filaments: (a), (b), and (c). The crystallinity and rate of crystallization were determined from the cooling curves. The crystallinity was determined from the area under the cooling exotherms. The crystallization time was also recorded and the rate of crystallization was calculated. DSC test results are shown in Table III. It is observed in Table III that crystallinity increased by 22% with SWCNT inclusion but with the addition of nylon 6, the crystallinity decreased by 14%. However, after strain hardening, percent crystillinity increased in all categories of filament samples if compared with nonstrain-hardened samples as seen in the Table III. This increase was more in samples with SWCNT. Rate of crystallization also increased in each sample after strain hardening and showed a similar trend. Strain-induced crystallization is evident from the DSC results as percent crystallinity increased after strain hardening in each categories of samples. It is seen that strain-induced crystallization is more effective when SWCNTs are present in the matrix. Due to the loading–unloading cycles, molecular segments in the polymer tend to come closer to the nanotubes, and the higher nucleation activation energy level at the nanotubes surface will facilitate the crystallization process. It is also seen from Table III that for each category of samples, dT decreased after the strain hardening cycles when compared with that of the nonstrain-hardened samples. Decrease in dT is an indication of narrow lamellar size distribution inside the material. During the strain hardening process, due to the applied strain energy, the chains of UHMWPE from their lamellar structure partially unfold and breakup into small crystallites. These small crystallites can be connected to each other by noncrystalline tie molecules and can form oriented microfibrillar structures. Formation of oriented microfibrillar structure is also evident from the SEM picture (Fig. 6).
DSC curves of (a) neat UHMWPE, (b) UHMWPE–SWCNT, and (c) UHMWPE–SWCNT–nylon 6 before strain hardening.

DSC curves of (a) neat UHMWPE, (b) UHMWPE–SWCNT, and (c) UHMWPE–SWCNT–nylon 6 after strain hardening.

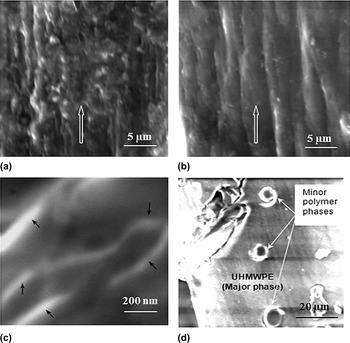
SEM micrographs of (a) UHMWPE, (b) strain-hardened UHMWPE, (c) UHMWPE–SWCNT, and (d) cross-sectional view of UHMWPE–SWCNT–nylon 6.

DSC test results.

S.H. for Strain Hardened.
D. SEM analysis
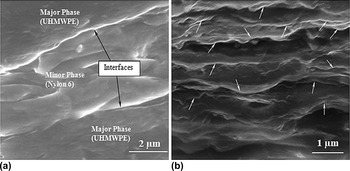
SEM studies were conducted for various categories of filaments before and after strain hardening. Figures 6(a) and 6(b) show SEM images of UHMWPE filaments illustrating a comparative view of the fibrils arrangement before and after strain hardening. The arrows in the figures indicate filament axis and loading direction during strain hardening tests. Some degree of polymer chain alignment is seen in Fig. 6(a). This partial alignment has happened during the extrusion and stretching phase. On the other hand, Fig. 6(b) shows much improved orientation that was achieved through strain hardening cycles. This suggests that molecular rearrangements have indeed taken place during loading–unloading operations. Anisotropic parallel structure was formed with orientation of the microfibrills along the arrow indicated draw direction. This molecular rearrangement is giving rise to the stress–strain response of the polymer after strain hardening. Figure 6(c) shows the SEM image of SWCNT-infused UHMWPE filament at high resolution. It is observed that tubes are coated with a thick polymer layer and marked by the arrows in Fig. 6(c). Since UHMWPE is crystalline in nature, this crystalline polymer will aggregate on a suitable nucleation site as it precipitates from the solution. As nucleation can occur at multiple sites of a nanotube, crystalline lamella closely packed at different sites. In this process, thick coatings of polymer layer generated on the tube’s surface, which reduced the van der Waal interactions between the CNTs and helped prevent the nanotubes agglomeration inside the polymer matrix. These polymer coatings played significant role in the interfacial load transfer mechanism and substantially increased the strength of the composites as seen in Table I. Figure 6(d) is the cross-sectional view of an undeformed UHMWPE–SWCNT–nylon 6 (type-3) filament. Evidence of minor phases as droplets in an extruded filament is shown in Fig. 6(d). Energy dispersive x-ray spectroscopy (EDS) analysis has also confirmed these minor phases as nylon. The droplets were around 4–7 μm in diameter and were distributed randomly. As-received nylon particles were 15–30 μm in diameter. It is therefore seen that a considerable amount of size reduction of the minor phase has taken place due to blending and extrusion. This reduction in size, however, is an indication of reduced interfacial tension between the major and minor phases.Reference Favis23Figure 7(a) shows a longitudinal view of a deformed UHMWPE–SWCNT–nylon 6 filament. This particular filament was stretched up to 160% strain. Elongated minor phase (nylon 6) in between the major phase is evident in the micrograph. The interface between the minor and major polymer phases is also evident in the micrograph. The ability of nylon to stretch allowed the composite to deform more. Minor phase seems to have elongated along the direction of the tensile load. Prolonged interfaces along the minor phase suggested sliding between the phases might have occurred. Moreover, this sliding is prolonged as nanotubes share the load and delay the final fracture of the filament. Figure 7(b) is a high-resolution SEM micrograph of UHMWPE–SWCNT–nylon 6 filament after strain hardening. It is seen in the figure that an array of nanotubes partially aligned in the loading direction during the strain hardening sequences. Higher values of strength and modulus as well as the normalizing velocity seen in strain-hardened samples are direct consequences of improved nanotubes alignment.
SEM micrographs of UHMWPE–SWCNT–nylon 6. (a) View of an deformed filament—showing minor and major polymer phases and interfaces along the extrusion direction. (b) View of the filament after strain hardening—showing an array of nanotubes are partially aligned along the loading direction.

E. Raman spectroscopy analysis
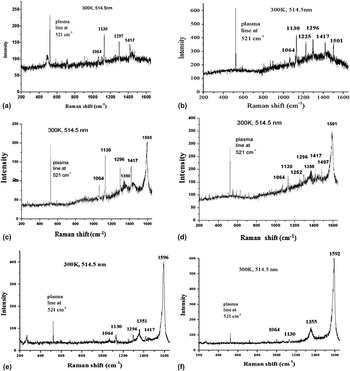
Raman spectroscopy is an effective technique to study the deformation of high-performance fibers at the molecular level. It provides an important insight into the response of the molecules. When polymers are deformed, the bonds in the molecules are strained, and some of the frequencies of Raman bands are shifted to lower or higher wave numbers depending on the tension or compression in the molecular bonds. Both the C–C asymmetric stretching mode (1064 cm−1) and symmetric stretching mode (1130 cm−1) for polyethylene have been observed in all the neat and composite filaments [Figs. 8(a)–8(f)]. The orthorhombic crystalline phase is represented by 1417 cm−1 band, whereas 1296 cm−1 indicates the CH2 wagging mode for polyethylene.Reference Wong and Young24–Reference Stuart30 With the addition of SWCNTs, two more bands at 1350 cm−1 and at 1593 cm−1 appeared. The strong Raman bands at 1593 cm−1 are the characteristic G band for SWCNTs. The band at 1350 cm−1 (D band) arises from the disorder-induced mode Ag1.Reference Nemanich and Solin31–Reference Dresselhous, Pimenta and Eklund33 When UHMWPE–SWCNT samples were strain hardened, D and G bands shift to 1358 and 1591 cm−1, respectively [Fig. 8(b)]. It is observed that there is a positive shift in D, while a negative shift occurred in G band. The positive shift in D band is an indication of lateral compression of nanotubes at the defect sites. Such lateral compression of nanotubes is very much likely during the strain hardening process, as they would tend to elongate. Elongation of nanotubes is also evident by further stretching of tangential C–C bonds as indicated by the negative shift in the G band [Fig. 8(d)]. The G peak moves to a lower wave number (1591 cm−1) after strain hardening. It indicates that the macroscopic stress on the composite stretched the SWCNTs. However, there was no significant change in the intensity ratio (ID/IG) of D and G bands before and after strain hardening as can be observed from Figs. 8(c) and 8(d). This suggested that no structural defect was generated in the SWCNTs due to loading–unloading cycles.
Raman spectrums of (a) neat UHMWPE, (b) UHMWPE after strain hardening, (c) UHMWPE–SWCNT, (d) UHMWPE–SWCNT after strain hardening, (e) UHMWPE–SWCNT–nylon 6, and (f) UHMWPE–SWCNT–nylon 6 after strain hardening.

Two additional bands at 1225 and 1501 cm−1 are also observed in UHMWPE when they are strain hardened [Fig. 8(b)]. Bands at 1225 and 1501 cm−1 are exhibiting CH2 twisting and bending Raman modes,Reference Wong and Young24, Reference Stuart30 respectively. In strain-hardened UHMWPE–SWCNT samples, we observe a positive shift of CH2 twisting band to 1252 cm-1 [Fig. 8(d)]. This positive shift suggests a less or restricted twisting of CH2 bonds due to the presence of SWCNTs. However, no stretching of polymer C–C bond is evident as there was no shift in the symmetric or asymmetric stretching mode. Figures 8(e) and 8(f) represent the spectral distribution of UHMWPE–SWCNT–nylon 6 filament before and after strain hardening, respectively. The deformation pattern of SWCNT is similar to what we have observed in UHMWPE–SWCNT. In the spectral distribution of UHMWPE–SWCNT–nylon 6, the orthorhombic crystalline phase for polyethylene (1417 cm−1) is not as prominent as it was in the case of UHMWPE–SWCNT. This is because of the increase in intercrystalline amorphous segment due to the inclusion of nylon 6, which is also consistent with the DSC results.
V. SUMMARY
(i) A methodology of producing hybrid UHMWPE–nylon 6–SWCNT nanocomposites fiber has been presented. This hybridization has been very effective in enhancing strength, modulus, and fracture strain. Improvement in these properties with respect to neat filament was 100%, 219%, and 107%, respectively.
(ii) A procedure for strain hardening of produced fibers is also introduced to investigate fiber properties at maximum possible strain. It has been observed that after strain hardening, strength and modulus increased by almost one order of magnitude.
(iii) As three basic properties, i.e., modulus, strength, and fracture strain increased, so did the normalized velocity of the fiber since the change in density was insignificant after reinforcement.
(iv) Studies were performed using DSC, SEM, and Raman Spectroscopy to identify the source of improvement in properties. DSC tests revealed that there is a substantial increase in crystallinity and rate of crystallization with reinforcement, and they increase further with strain hardening. Elongation of both major and minor phase polymer fibrils along the draw direction and nested around nanotubes were responsible for such change in crystalline structure.
(v). SEM examinations were able to image these polymer phases along with nanotubes. It was observed that the minor phases were formed as microdroplets. Interfaces between the major and minor phases were also observed. Nanotubes were also coated with the major phase. As nanotubes carried the load, they were stretched and compressed. Such compression of CNTs was evidenced by Raman spectroscopy. Positive shift in the D band suggested lateral compression of nanotubes, while a negative shift in G band indicated moderate stretching of C–C bond in the nanotubes.
ACKNOWLEDGMENTS
Authors would like to acknowledge support from National Science Foundation (NSF) for this work through Grant No. HRD-976871. Authors would also like to thank Dr. Efthymios Liarokapis and Dr. Mahmoud Madani for their assistance in Raman spectroscopy and SEM analysis.