Introduction
Montmorillonite is the main component of bentonite, a dioctahedral layered silicate mineral composed of two sheets of silicon-oxygen tetrahedra and one sheet of aluminum (hydrogen) oxygen octahedra (Magzoub et al. Reference Magzoub, Nasser, Hussein, Benamor, Onaizi, Sultan and Mahmoud2017; Sun et al. Reference Sun, Peng, Liu and Xian2015; Zhu et al. Reference Zhu, Zhou, Kabwe, Wu, Li and Zhang2019). Montmorillonite has a series of unique properties (such as swelling, dispersibility, adsorption, and adhesion) because of its layer charge (Q m ) and the existence of hydrated cations between the layers (Caglar et al. Reference Caglar, Topcu, Coldur, Sarp, Caglar, Tabak and Sahin2016). Bentonite applications have been studied extensively, therefore, e.g. as a sorbent of organics and metals (Jiang et al. Reference Jiang, Nie, Bian, Dong, Song, He, He, Zheng, Huo, Li, Belzile, Sun and Zou2019), for catalyst support (Liu et al. Reference Liu, Xu, Qin, Tao, Cao, Shen and Zhu2020), as the main material in zeolite synthesis (Rakhimova et al. Reference Rakhimova, Rakhimov, Morozov and Eskin2021), and as a binder for casting (Boylu, Reference Boylu2011; Gong et al. Reference Gong, Liao, Lv and Wang2016).
Bentonite is highly plastic, and has good demolding capacity, excellent air permeability, and its physical and chemical properties are stable in high-temperature environments when it is used as a molding-sand binder in the foundry industry; metal castings rarely have defects such as sand inclusions and sand holes (Geng and Liu Reference Geng and Liu2013; Jordan et al. Reference Jordan, Eulenkamp, Calzada, Schillinger, Hoelzel, Gigler, Stanjek and Schmahl2013). When bentonite is used as a binder for casting wet sand molds, however, the main component of bentonite (i.e. montmorillonite) can be damaged because of the heating (Żymankowska-Kumon et al. Reference Żymankowska-Kumon, Holtzer, Olejnik and Bobrowski2012). This causes some of the bentonite to lose its bonding property and to become “burnt-out bentonite,” further affecting the cycle times of the molding sand (Beňo et al. Reference Beňo, Vontorová, Matìjka and Gál2015). The thermal stability of bentonite is related mainly to the temperature at which montmorillonite loses an hydroxyl group (dehydroxylation). In high-temperature environments, the hydroxyl group is released from the octahedral sheet of the montmorillonite structure in the form of H2O, which causes a gradual decline in the cohesive properties of the bentonite (Schnetzer et al. Reference Schnetzer, Thissen, Giraudo and Emmerich2016). The temperature of montmorillonite dehydroxylation is generally 600–750°C (Bala et al. Reference Bala, Samantaray and Srivastava2012). The main factors affecting this temperature are as follows: the substitutions of cations for Al3+ and Si4+ in the octahedral and tetrahedral sites, and structural Fe3+ decreases significantly the dehydroxylation temperature (Kaufhold et al. Reference Kaufhold, Stucki, Finck, Steininger, Zimina, Dohrmann, Ufer, Pentrak and Pentrakova2017; Wu et al. Reference Wu, Wu and Li2005); lattice defects or cis- and trans-structures (Wolters and Emmerich Reference Wolters and Emmerich2007); and the particle size (Gauglitz and Schwiete Reference Gauglitz and Schwiete1964). Currently, however, few reports detail the influence of Q m on the thermal stability of montmorillonite.
In the crystal structure of montmorillonite, Si4+ in the tetrahedral sheet can be substituted by Al3+ and Fe3+, while Al3+ and Fe3+ in the octahedral sheet can be replaced by Mg2+ and Fe2+; thus, the layer becomes negatively charged (Finck et al. Reference Finck, Schlegel, Dardenne, Adam, Kraft, Bauer and Robert2019; Qiu et al. Reference Qiu, Zhang and Lv2007, Reference Qiu, Li, Liu, Jiang, Wang, Chen, Zhu, Yao, Liu and Lyu2019a, Reference Qiu, Li, Jiang, Liu, Chen and Wangb), i.e. Q m . To balance these negative charges, montmorillonite adsorbs cations from the surrounding environment, which complicates the chemical composition of montmorillonite (Yang et al. Reference Yang, Nair and Sun2019). The size of Q m varies with the cause and place of origin of montmorillonite. Q m is a very important crystal chemical property of montmorillonite, which exerts a critical influence over many other properties of the montmorillonite (Qiu et al. Reference Qiu, Zhang and Lv2007; Sans et al. Reference Sans, Guven, Esenli and Celik2017; Chen et al. Reference Chen, Yuan, Zhao, Rao and Song2018; Yang et al. Reference Yang, Nair and Sun2019; Koutsopoulou et al. Reference Koutsopoulou, Koutselas, Christidis, Papagiannopoulos and Marantos2020). For example, Q m can affect the hydration (Qiu et al. Reference Qiu, Li, Liu, Jiang, Wang, Chen, Zhu, Yao, Liu and Lyu2019a, Reference Qiu, Li, Jiang, Liu, Chen and Wangb), exfoliation (Chen et al. Reference Chen, Yuan, Zhao, Rao and Song2018), and adsorption properties (Qiu et al. Reference Qiu, Li, Liu, Jiang, Wang, Chen, Zhu, Yao, Liu and Lyu2019a, Reference Qiu, Li, Jiang, Liu, Chen and Wangb) of bentonite.
The objectives of the present study were to investigate the influence of Q m on the thermal stability of montmorillonite, using the O (11) method to calculate the Q m of each sample, and to determine the relationship between Q m and the reusability of bentonite.
Materials and Methods
Materials
The bentonite samples (<0.075 mm size fraction) used in the present study were collected from Wuhu, Anhui Province; Xinyang, Henan Province; and Santai, Sichuan Province, China. The main chemical components (Table 1) in the bentonite samples were SiO2 and Al2O3, with minor amounts of MgO, CaO, Na2O, Fe2O3, and K2O, etc. The SiO2 contents of sample XY and sample WH were relatively high, exceeding 70% in both, while that of sample ST was least at 59.52%. Anhydrous sodium pyrophosphate was supplied by Chengdu Kelong Co., Ltd., Chengdu, China, (AR).
Chemical composition (wt.%) of bentonite in the various samples examined

Experimental Investigation
Purification treatment.
20 g samples of WH, XY, and ST bentonites were weighed, and the solid:liquid ratio was 1:20 (m:v). Anhydrous sodium pyrophosphate (0.3%) was added and the solution was stirred with a high-speed homogeneous mixer (FJ300-SH, Shanghai specimen model factory, Shanghai, China) for 50 min. Then, the mixture was separated using a centrifuge (F-34–6-38, Eppendorf Centrifuge 5804 R, Eppendorf AG, Hamburg, Germany) operated at 2000 rpm (581.36 × g) for 2 min; the upper suspension was sonicated for 10 min, and was centrifuged again at 5000 rpm (3633.50 × g) for 3 min. The lower suspension was dried at 105°C, ground, and stored in bags. The samples were marked as WH-T, XY-T, and ST-T.
Layer-charge calculation.
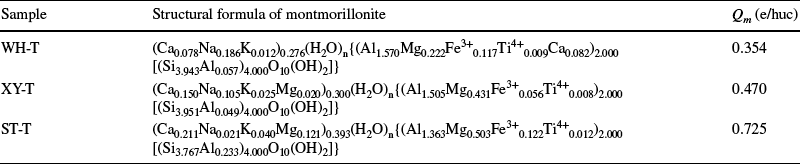
Semi-quantitative analysis was performed on samples WH-G, XY-G, and ST-G; then, the components were normalized to obtain the percentage of each component (Table 2) (Kaufhold et al. Reference Kaufhold, Dohrmann, Ufer and Meyer2003; Ufer et al. Reference Ufer, Stanjek, Roth, Dohrmann, Kleeberg and Kaufhold2008). The O (11) calculation method (Sun et al. Reference Sun, Peng and Liu2007) was used to calculate the structural formula of montmorillonite in the bentonite samples for each mining area. That is, according to the principle of balance of total negative and positive charges in the structural formula of montmorillonite: the mass percentage of each chemical component in the samples was converted to atomic number and the total valence of cations in the interlayer domain is the montmorillonite Q m . Then, the Q m value (e/huc) was calculated from the crystal-chemical formula of each montmorillonite (Table 3).
Chemical composition (wt.%) of bentonite in the various samples examined after purification and normalization

Structural formula and Q m of montmorillonite samples calculated by the O (11) method

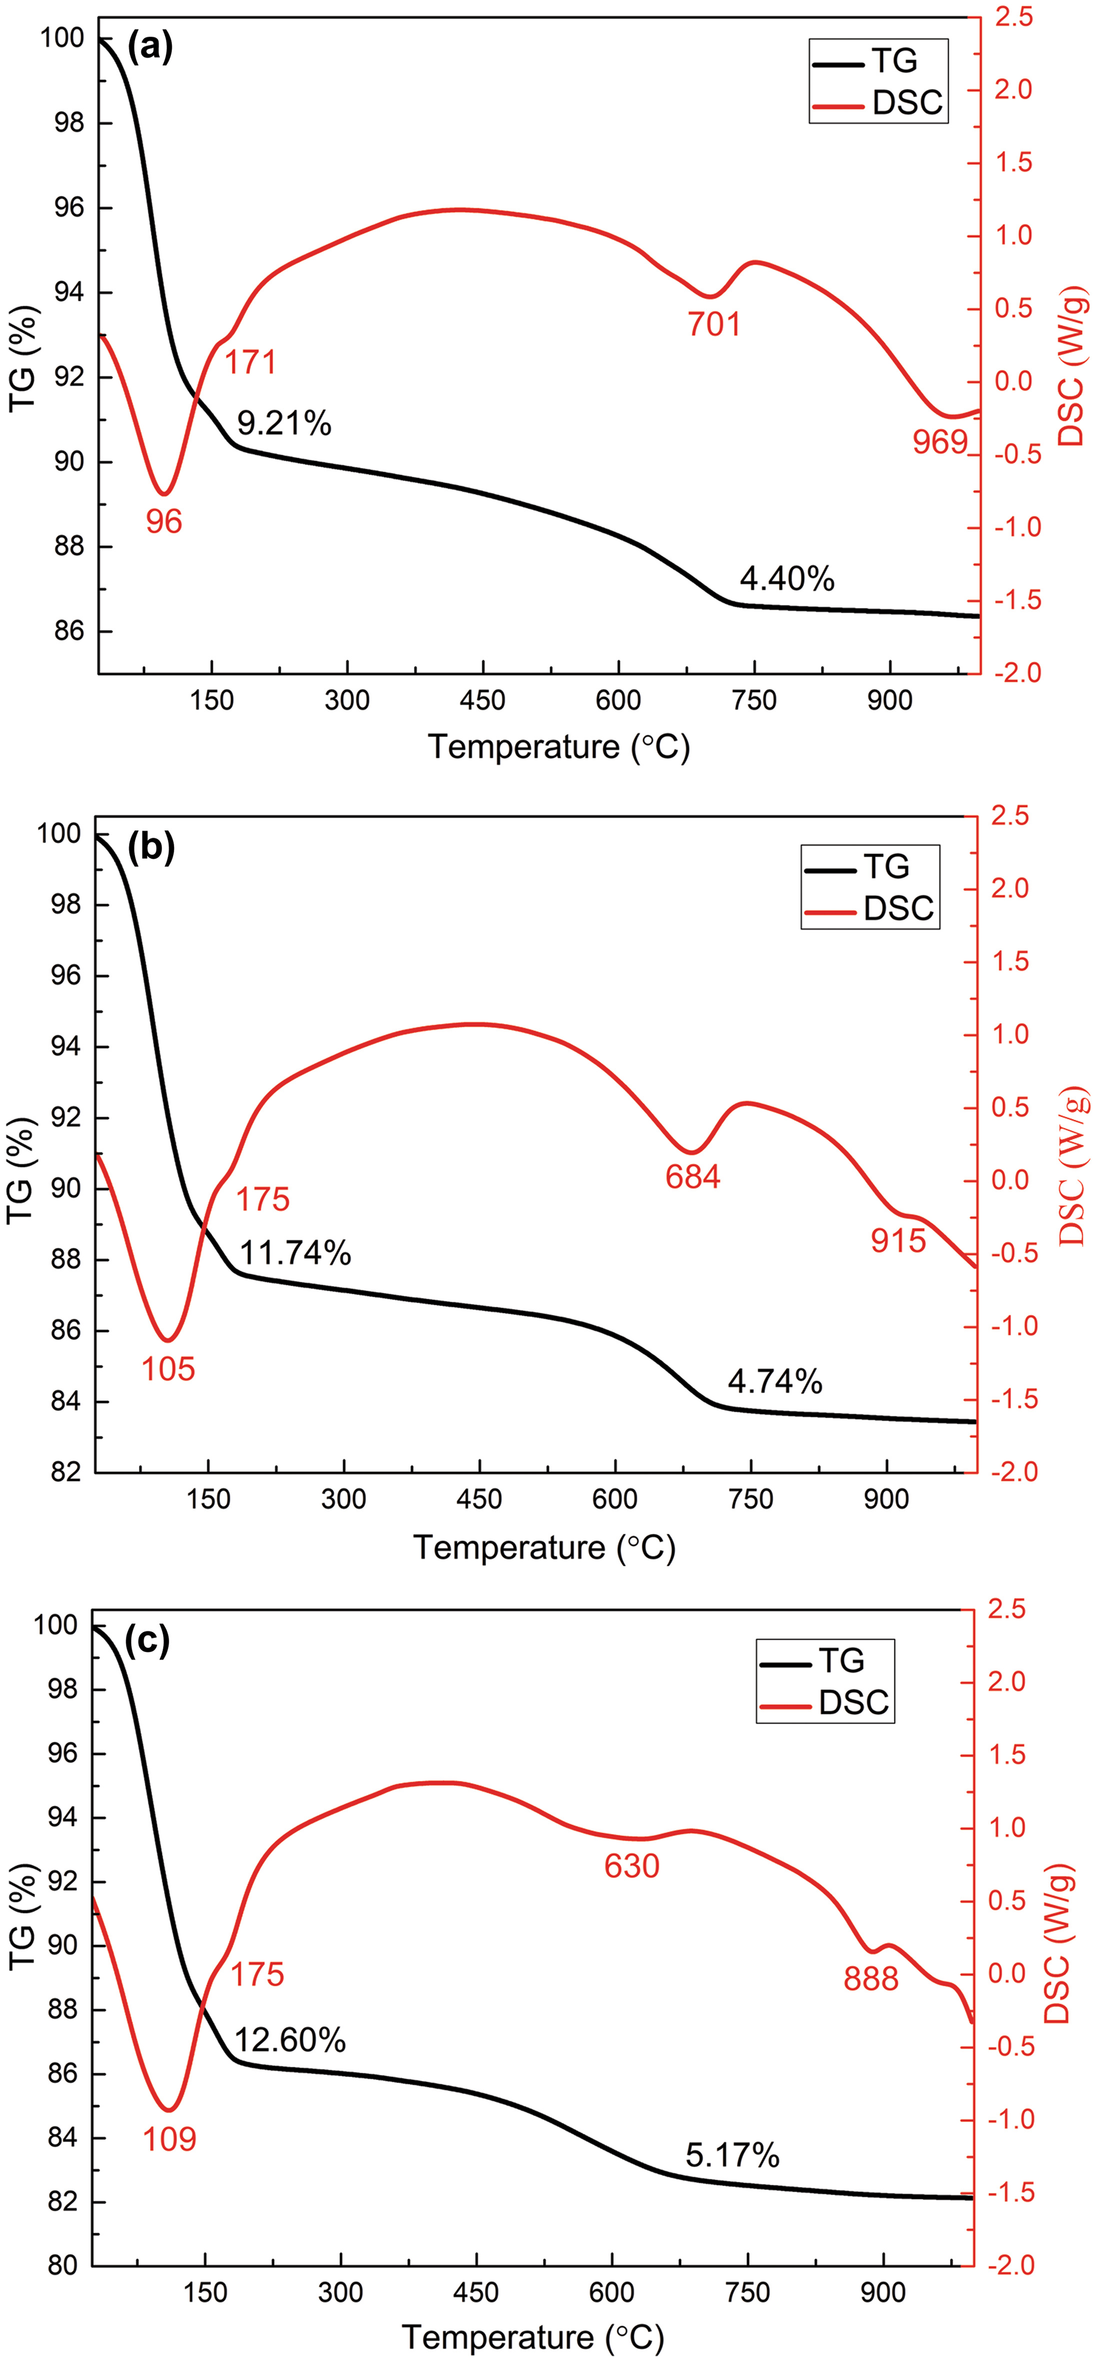
TG-DSC patterns of bentonite samples: a WH, b XY, and c ST

Analytical data for the dynamic thermal effects of bentonite samples

Calcination treatment.
A box-type furnace (KSD-6-1300, Mianyang Jinguan Technology Co., Ltd., Mianyang, China) was heated to 600°C and kept at this temperature for 60 min. Then, 5 g of each bentonite sample was placed in porcelain crucibles and placed in the pre-heated box-type furnace. Timing started when the furnace temperature reached the set temperature. Samples were then cooled to room temperature, ground, and stored in bags. Samples were marked as WH-600, XY-600, and ST-600.
Determination of methylene blue consumption.
The dried bentonite sample (0.2 g) was rewetted by adding it to a 250 mL conical flask with 50 mL of distilled water. Then, 20 mL of sodium pyrophosphate solution (1%) was added, the mixture was shaken and boiled on an electric stove for 5 min, followed by cooling to room temperature in air. A burette was used to drip methylene blue solution into the sample solution under constant shaking to achieve full reaction. Then, a drop of the test solution was dropped, using a glass rod, onto medium-speed, quantitative filter paper to check whether a pale blue halo appeared around the dark blue spot. If it did not appear, methylene blue solution was added dropwise until a light blue halo was observed on the filter paper, which marked the end point of the titration and the relevant titration volume. The methylene blue consumption of bentonite was calculated according to formula 1:

where the MB (g/100 g) represents the consumption of methylene blue; c (g/mL) represents the concentration of methylene blue solution; V (mL) represents the titer of methylene blue solution; m (g) represents the bentonite mass; and 100 is the coefficient of the amount of methylene blue consumption of 1 g of bentonite converted to 100 g of bentonite. The arithmetic mean of the parallel determination results was taken as the measurement result, and the relative deviation between the two parallel determinations did not exceed 2%.
Swelling value test.
A dried bentonite sample (3 g) was added to a measuring cylinder containing 50–60 mL of distilled water. The stopper was inserted tightly and the mixture was shaken until even dispersion was achieved. Then, 5 mL of ammonium chloride solution was added, and distilled water was added continually to the 100 mL graduation line. After shaking for 1 min, and allowing the mixture to settle for 24 h, the scale value of the precipitate interface was read. The arithmetic mean of parallel results was taken as the measurement result, and the absolute error of the two parallel determinations did not exceed 2 mL.
Reusability test.
The box-type furnace was again heated to 600°C and kept at this temperature for 60 min. Then 5 g bentonite samples in porcelain crucibles were placed in the pre-heated furnace. Timing started when the furnace temperature reached the pre-set temperature. After heating for 60 min, the samples were cooled to room temperature. Then, the methylene blue consumption of bentonite after calcination was measured according to the test method (above) for the determination of the amount of methylene blue consumption. The reusability of bentonite was calculated according to formula 2:

where F B (%) represents reusability; MB 1 (g/100 g) represents the methylene blue consumption of bentonite after calcination at 600°C; and MB (g/100 g) represents the amount of methylene blue consumed by bentonite before calcination at 600°C.
Characterizations of both composition and structure.
The chemical composition of the samples was assessed using a Panax Axios X-ray fluorescence spectrometer (XRF, PANalytical B.V., Eindhoven, The Netherlands) with a ceramic X-ray tube (Rh target), and a maximum power of 2.4 kW. The phase and structural characteristics of the samples were studied by X'Pert MPD Pro X-ray diffraction (XRD, PANalytical B.V., Eindhoven, The Netherlands) with Cu target at 40 kV and 40 mA, and a scanning range of 3–80°2θ. Changes in molecular vibrational spectra of the samples were characterized using FTIR on a Nicolet-5700 infrared spectrometer (Perkin Elmer, Waltham, Massachusetts, USA). The wavenumber range was 400–4000 cm−1, and the KBr pellet technique was used. Changes in the thermogravimetric and differential scanning calorimetry (DSC) of samples were measured using an SDT Q600 synchronous thermal analyzer (TG-DSC, TA Instruments, New Castle, Delaware, USA). The heating rate was 20°C/min, in air atmosphere, and the air-flow rate was 100 mL/min. The micromorphology of the samples was analyzed using a Carl Zeiss Sigma300 field emission scanning electron microscope (SEM, Carl Zeiss NTS GmbH, Oberkochen, Germany).
Performance characterization.
The methylene blue consumption, swelling value, and reusability of samples were measured according to the Chinese Industry standard JBT 9227–2013 ‘Bentonite for Foundry' (National Foundry Standardization Technical Committee 2013).
RESULTS AND DISCUSSION
Phase Composition of Bentonite Samples
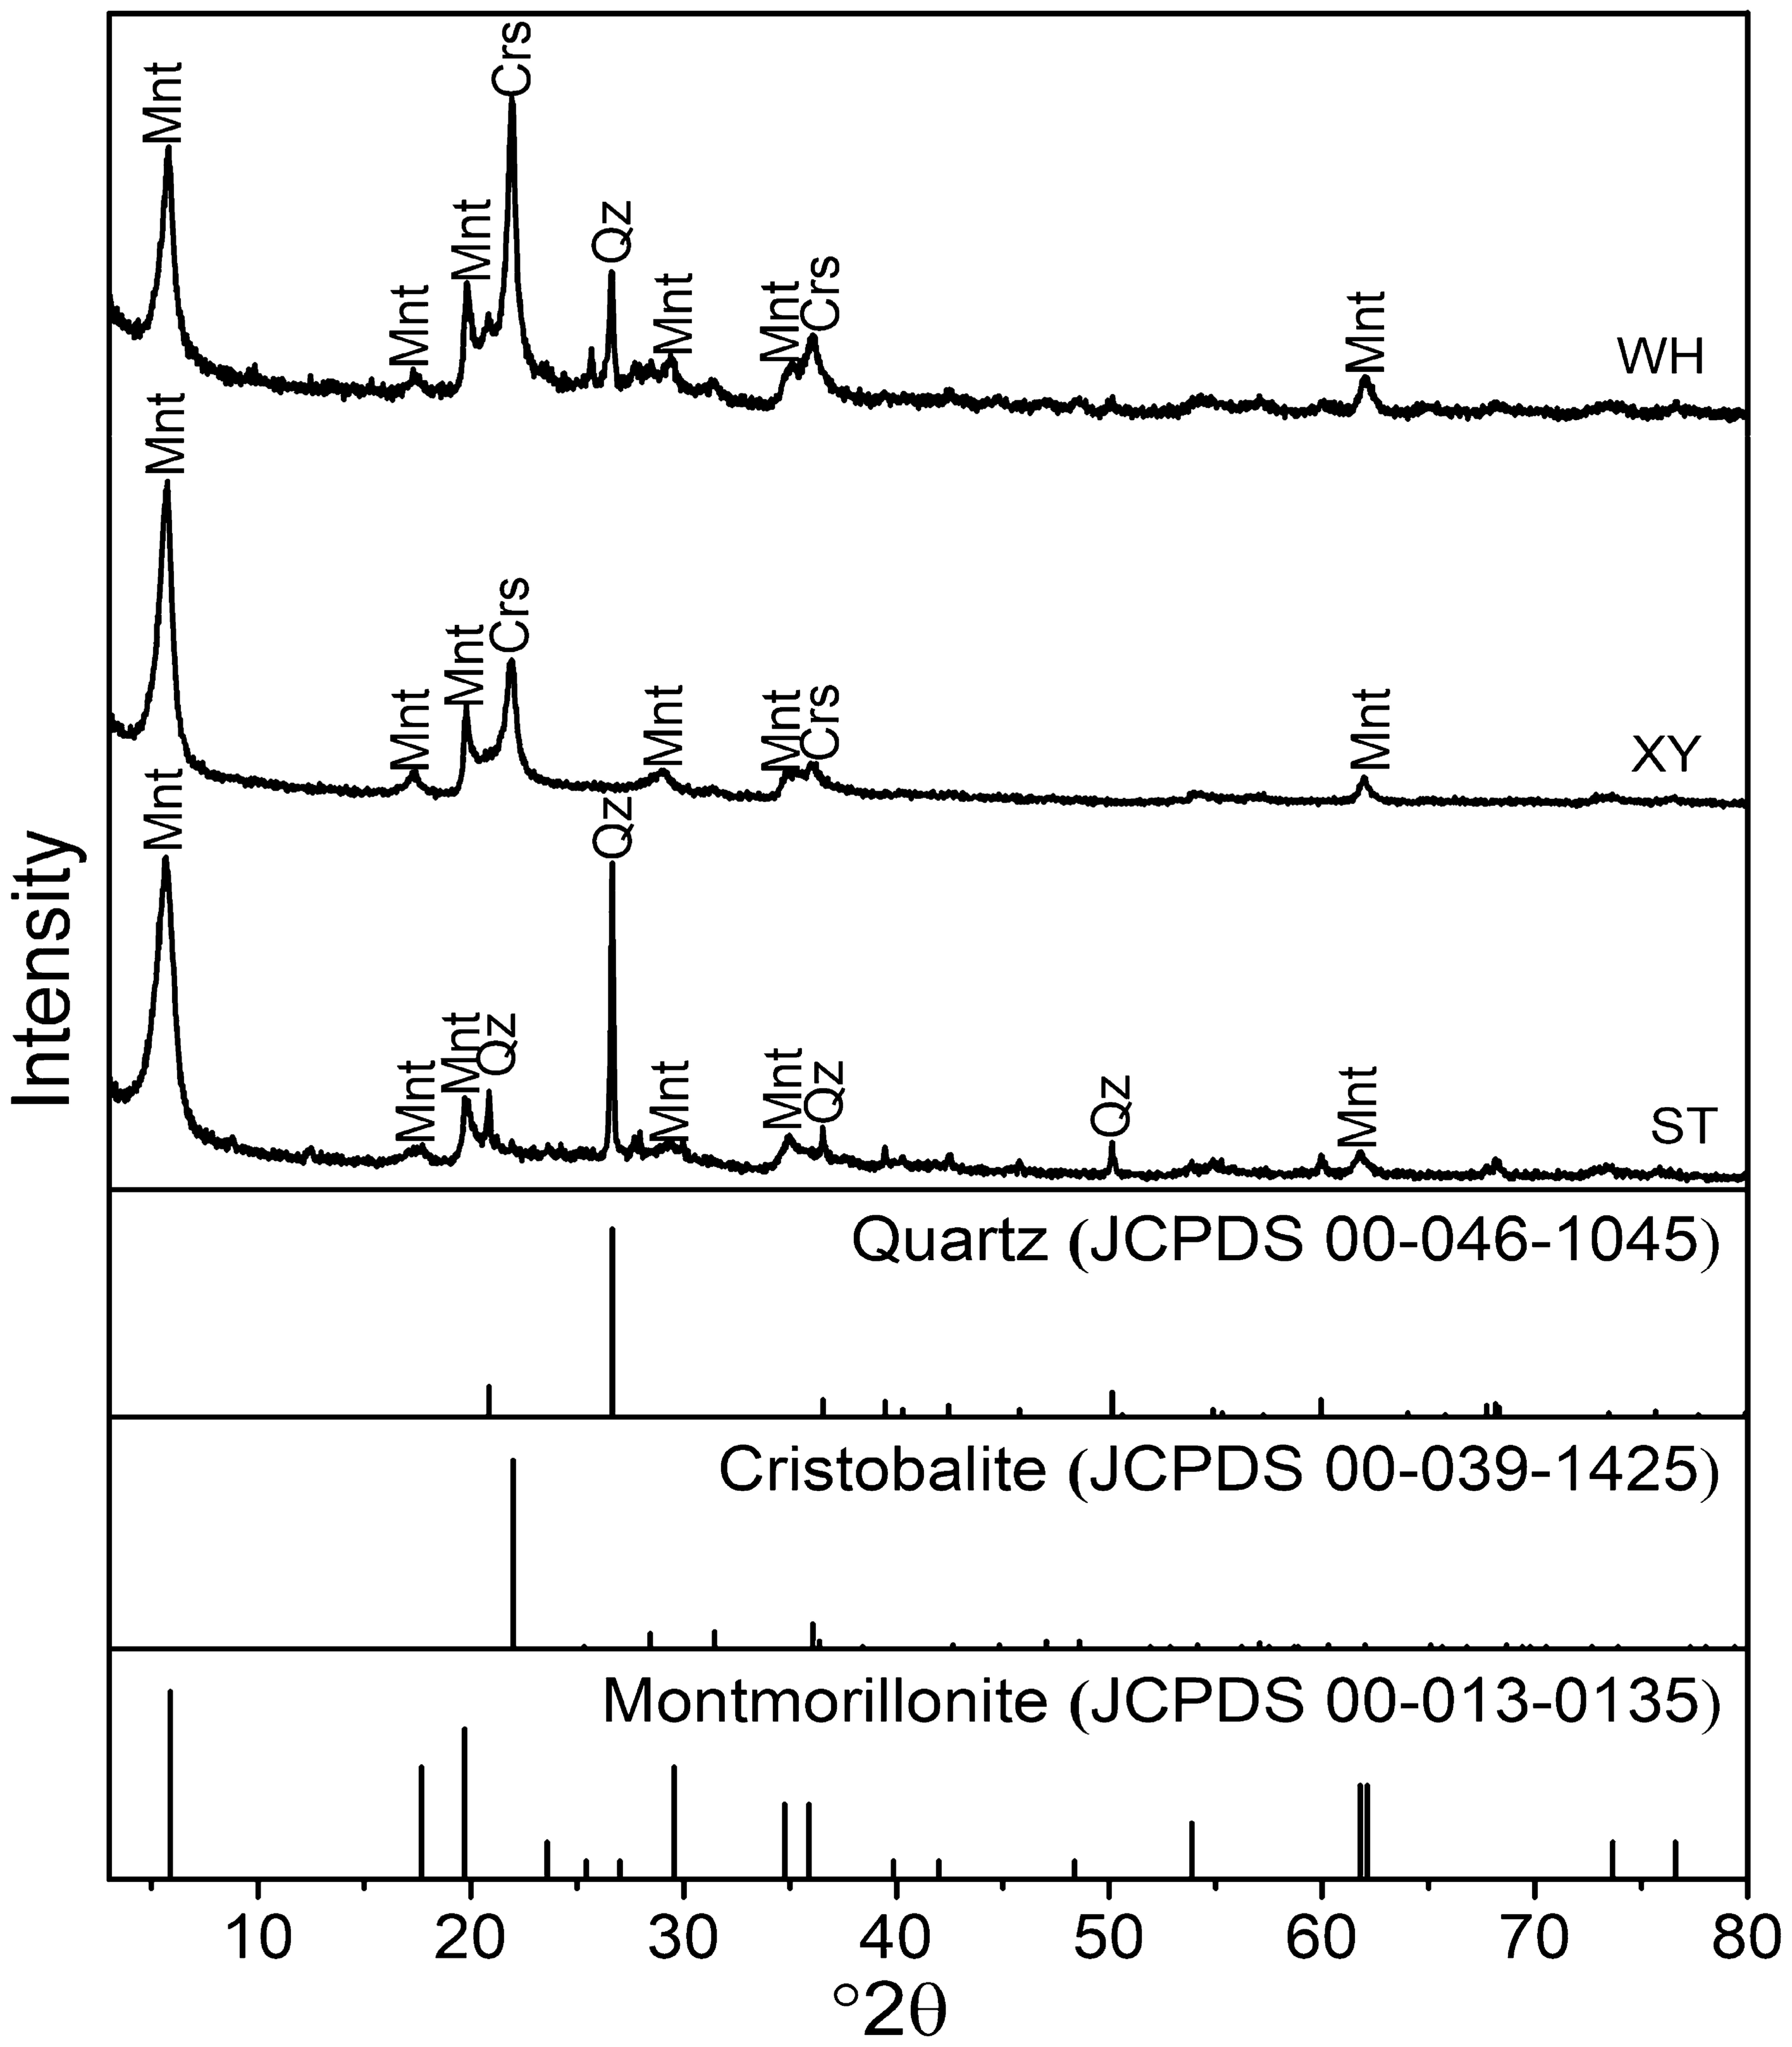
The characteristic reflections (001) of montmorillonite in the bentonite from the three mines all exceeded 1.50 nm (Fig. 1). The d 001 value of montmorillonite is related to the type of interlayer cation and the thickness of the adsorbed water layer. If Ca2+ is the interlayer cation, the water molecular layer consists of two layers with a basal spacing of 1.40–1.55 nm. If the interlayer cation is Na+, the water molecular layer consists of a single layer with a basal spacing of 1.20–1.25 nm. The d 001 values of montmorillonite in samples WH, XY, and ST were 1.5337 nm, 1.5180 nm, and 1.5196 nm, respectively, which meant that all three bentonite samples were Ca-bentonite. The impurities contained in sample WH were mainly cristobalite and quartz; the impurities contained in sample XY were mainly cristobalite; and the impurities contained in sample ST were mainly quartz. The cristobalite content was greatest in sample WH and the quartz content was greatest in sample ST.
XRD patterns of the bentonite samples

Dynamic Thermal Effect Changes
As shown by the TG-DSC curves of different bentonite samples (Fig. 2), all three samples had three endothermic effects on the DSC curves near the temperatures of 90–110, 630–701, and 888–969°C. These were caused by the endothermic processes of montmorillonite stripping off adsorbed and interlayer water (Grim and Rowland Reference Grim and Rowland1942; Boeva et al. Reference Boeva, Bocharnikova, Belousov and Zhigarev2016), as well as the decomposition and destruction of the layer structure (Alver and Gunal Reference Alver and Gunal2016). Two distinct weightless phases were visible on the TG curve, which correspond to the endothermic effect of the removal of interlayer and structural water on the DSC curve. The total weight losses of WH, XY, and ST samples were 13.61, 16.48, and 17.77%, respectively (Table 4). Because the quartz and cristobalite present in the samples did not lose weight during heating, the total weight loss represented the relative extent of the montmorillonite content in the samples. This indicated that the amount of impurities was greatest in sample WH, average in sample XY, and least in sample ST, consistent with the XRD results.
The three samples had weak adsorption peaks (at 171 and 175°C), toward the high-temperature end of the temperature range 95–175°C. This was related to the fact that the exchangeable cation in the interlayer domain of montmorillonite was mainly Ca2+. Because two water layers were present in the interlayer and the hydration energy of Ca2+ was large, the adsorbed water was lost first; then the water coordinated to Ca2+ was lost, thus accounting for peaks near 171 and 175°C. As the hydration energy of Na+ is smaller than for Ca2+, the dehydration temperature of the adsorption shoulder of sample WH was lower because of the relatively high Na2O content. The temperature of the endothermic valley generated by the dehydroxylation of montmorillonite and the decomposition of the structural layer are important indicators of the thermal stability of montmorillonite (Alver and Gunal, Reference Alver and Gunal2016; Wu et al. Reference Wu, Wu and Li2005). In other words, the greater the temperature of transitions in the DSC patterns, the better the thermal stability of montmorillonite. The temperatures of the endothermic valley of the three samples showed obvious regularity, i.e. these temperatures increased with decreasing Q m (Table 3). The Q m of sample ST was greatest at 0.725 e/huc, and the temperatures at which dehydroxylation and structural-layer decomposition occurred were least (630 and 888°C, respectively); the Q m of sample XY was in the middle at 0.470 e/huc, and the temperatures at which dehydroxylation and structural-layer decomposition occurred were greater (centered at 684 and 915°C, respectively); the Q m of sample WH was least at 0.354 e/huc, and the temperatures at which dehydroxylation and structural-layer decomposition occurred were greatest (centered at 701 and 969°C, respectively). The dynamic thermal stability of montmorillonite decreased with increasing Q m .
Changes in Samples after Static Heating
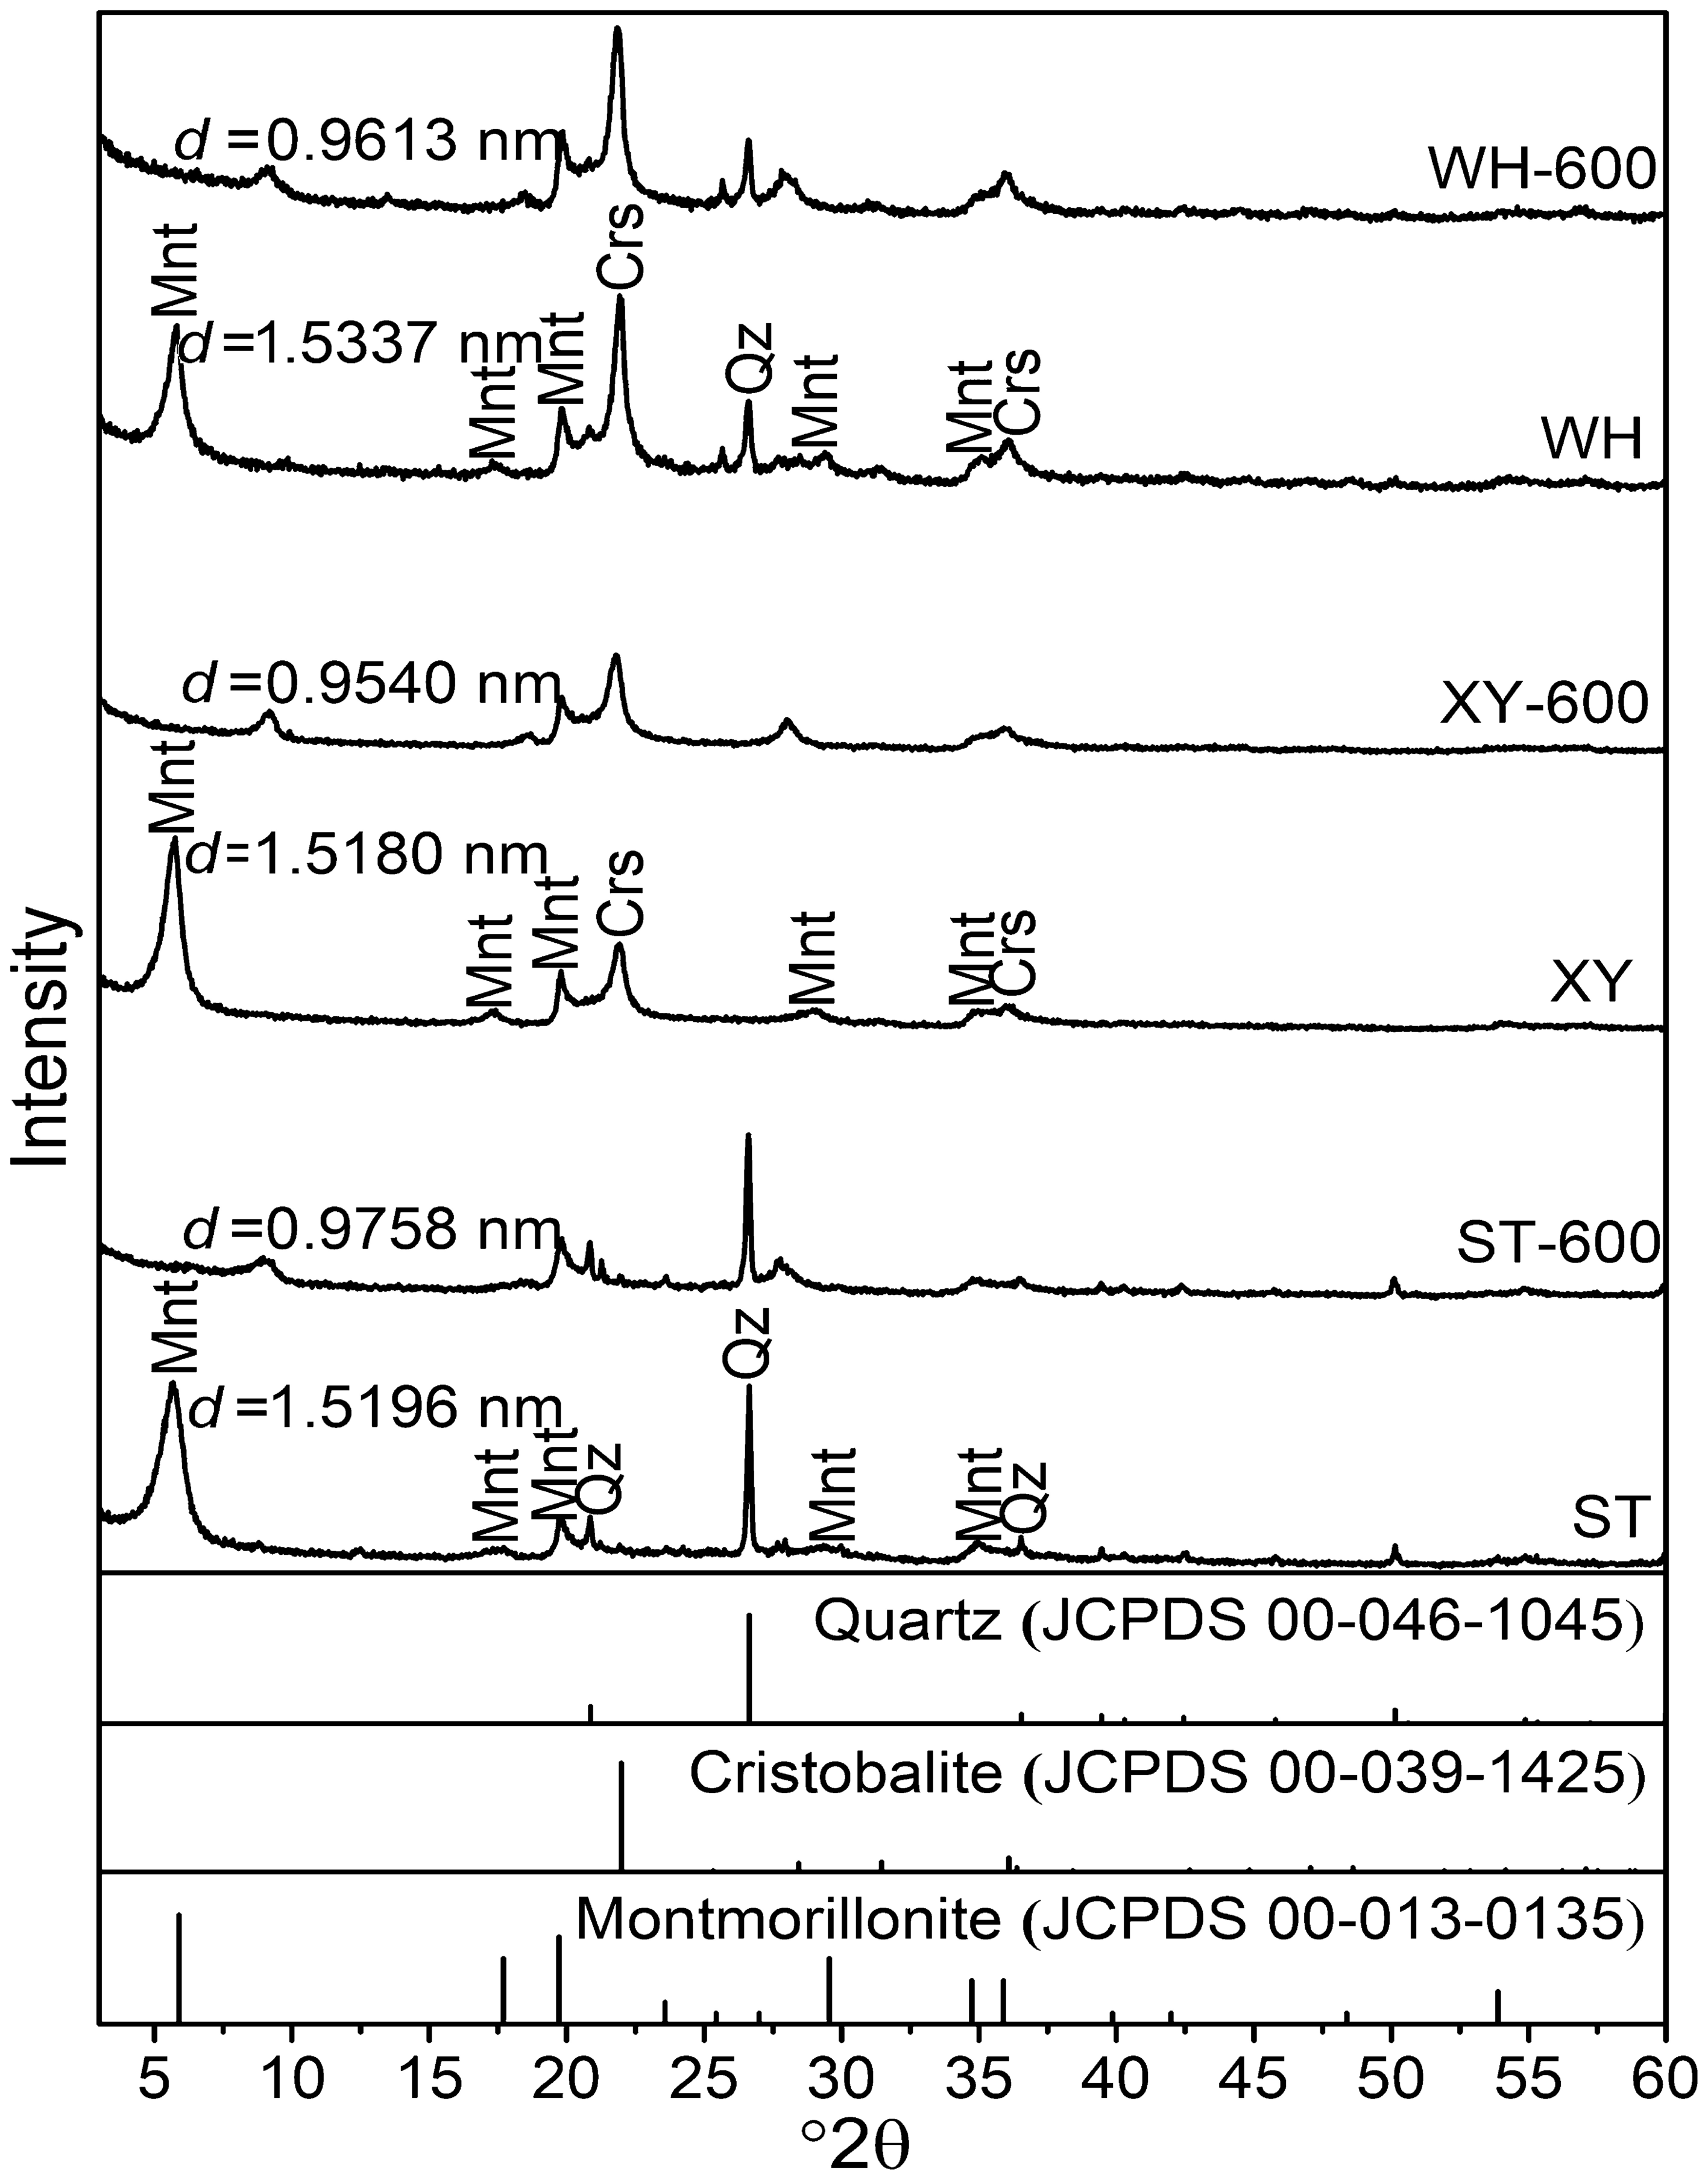
Compared with the original samples, the diffraction peaks of quartz and cristobalite in the samples calcined at 600°C for 60 min did not change significantly (Fig. 3). The characteristic peak (001) of montmorillonite disappeared, however, and a new, weak diffraction peak with d = 0.95–0.97 nm appeared. According to the thermal effect change of montmorillonite (Fig. 2), the interlayer water of montmorillonite in all samples was lost after calcination at 600°C, but the layered structure was retained. Because of the loss of water between the layers, the largest basal spacing decreased and became an illite-like structure. Because of the loss of interlayer water and the corresponding adjustment of structural layering, the disorder of layer stacking increased, while the peak intensity of the largest basal spacing decreased. The largest basal spacings of samples WH-600, XY-600, and ST-600 were 0.9613, 0.9540, and 0.9758 nm, respectively, which were related to the amounts of CaO and Na2O in the original samples. Because the Ca2+ hydrated radius exceeded that of Na+, sample ST-600 (with the greatest CaO content in the original sample) had the largest basal spacing, which was followed by sample WH-600, and then by sample XY-600 with the smallest value.
XRD patterns of the bentonite samples before and after calcination at 600°C

Changes in Vibrational Spectra
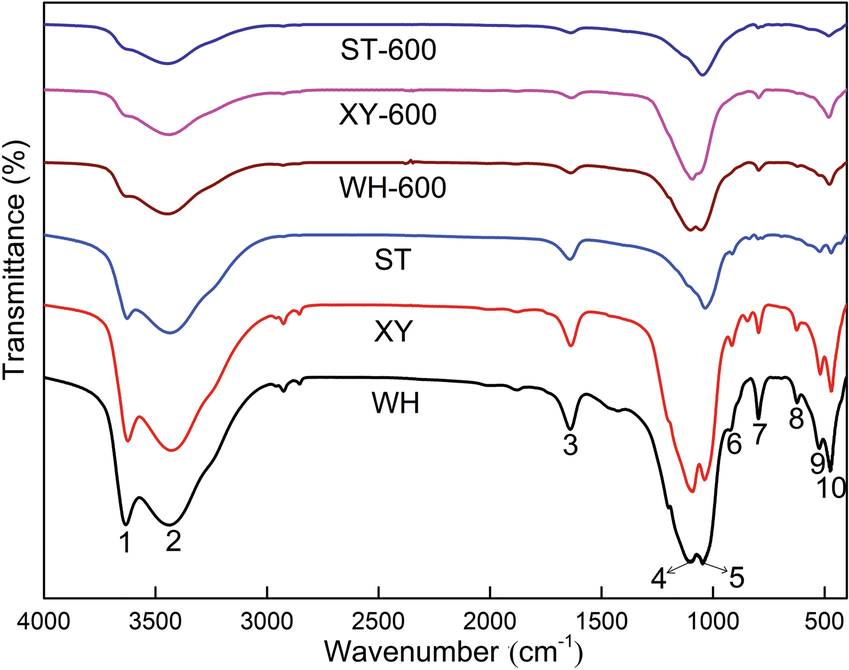
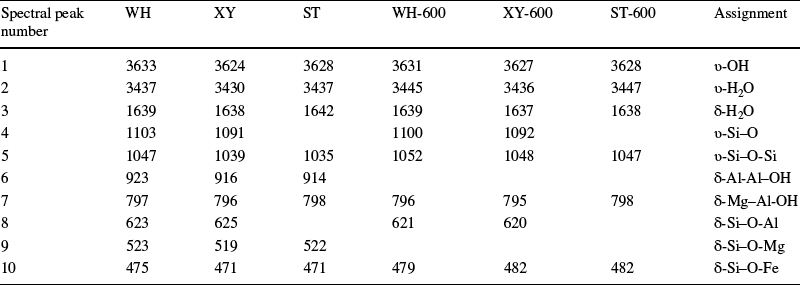
The characteristic bands of the FTIR spectra of different bentonite samples clearly identified montmorillonite in the samples (Fig. 4, Table 5) (Holtzer et al. Reference Holtzer, Bobrowski and Żymankowska-Kumon2011; Paluszkiewicz et al. Reference Paluszkiewicz, Holtzer and Bobrowski2008; Żymankowska-Kumon et al. Reference Żymankowska-Kumon, Holtzer, Olejnik and Bobrowski2012). The structural hydroxyl stretching band appeared at 3624–3633 cm−1, and the band at 1638–1642 cm−1 represented the bending band of adsorbed H2O (Hoang-Minh et al. Reference Hoang-Minh, Kasbohm, Nguyen-Thanh, Nga, Lai, Duong, Thanh, Thuyet, Anh, Pusch, Knutsson and Mahlmann2019; Sakizci et al. Reference Sakizci, Alver, Alver and Yörükoğullari2010). The bands in the three samples at 1035–1103 cm−1 were different. Samples WH and XY had two absorption bands, while sample ST had only one. The reason for this may be that when the amount of Ca2+ in the interlayer was large, the strong hydration of Ca2+ allowed the hydrogen atoms from the Ca2+-coordinated H2O to form a stronger hydrogen bond with basal oxygens, causing band #4 (Fig. 4) of Si-O to shift to a lower wavenumber and/or become infrared inactive (Wu et al. Reference Wu, Zhang, Wang, Guo and Zhao1999). Sample ST contained more Ca2+ than the other two samples (Table 1). After the samples were calcined at 600°C, no obvious changes were found in the absorption bands at 1035–1103 cm−1. The absorption bands of the three samples at 3624–3633, 1638–1642, 914–923, and 519–523 cm−1 all decreased significantly or even disappeared. Combined with the above analysis of the thermal effect on montmorillonite, the reason may be that montmorillonite started the dehydroxylation reaction under high temperature, which weakened the absorption band of hydroxyl groups. In addition, the dehydroxylation of montmorillonite caused the fracture of Al–Al–OH in the structure, which led to the disappearance of the characteristic absorption band (Holtzer et al. Reference Holtzer, Bobrowski and Żymankowska-Kumon2011; Paluszkiewicz et al. Reference Paluszkiewicz, Holtzer and Bobrowski2008). The weaker the absorption band, the worse the thermal stability of bentonite. The absorption bands at 3633 and 1639 cm−1 of sample ST with the highest Q m were weakened the most (Fig. 4), which also indicated that the montmorillonite in sample ST was damaged to the greatest extent.
FTIR patterns of the bentonite samples before and after calcination at 600°C (see Table 5 for assignments of the numbered bands)

Assignment of infrared absorption bands (cm−1) of bentonite samples before and after calcination at 600°C (see Fig. 4). υ = stretching mode, δ = bending mode

Microstructural Change
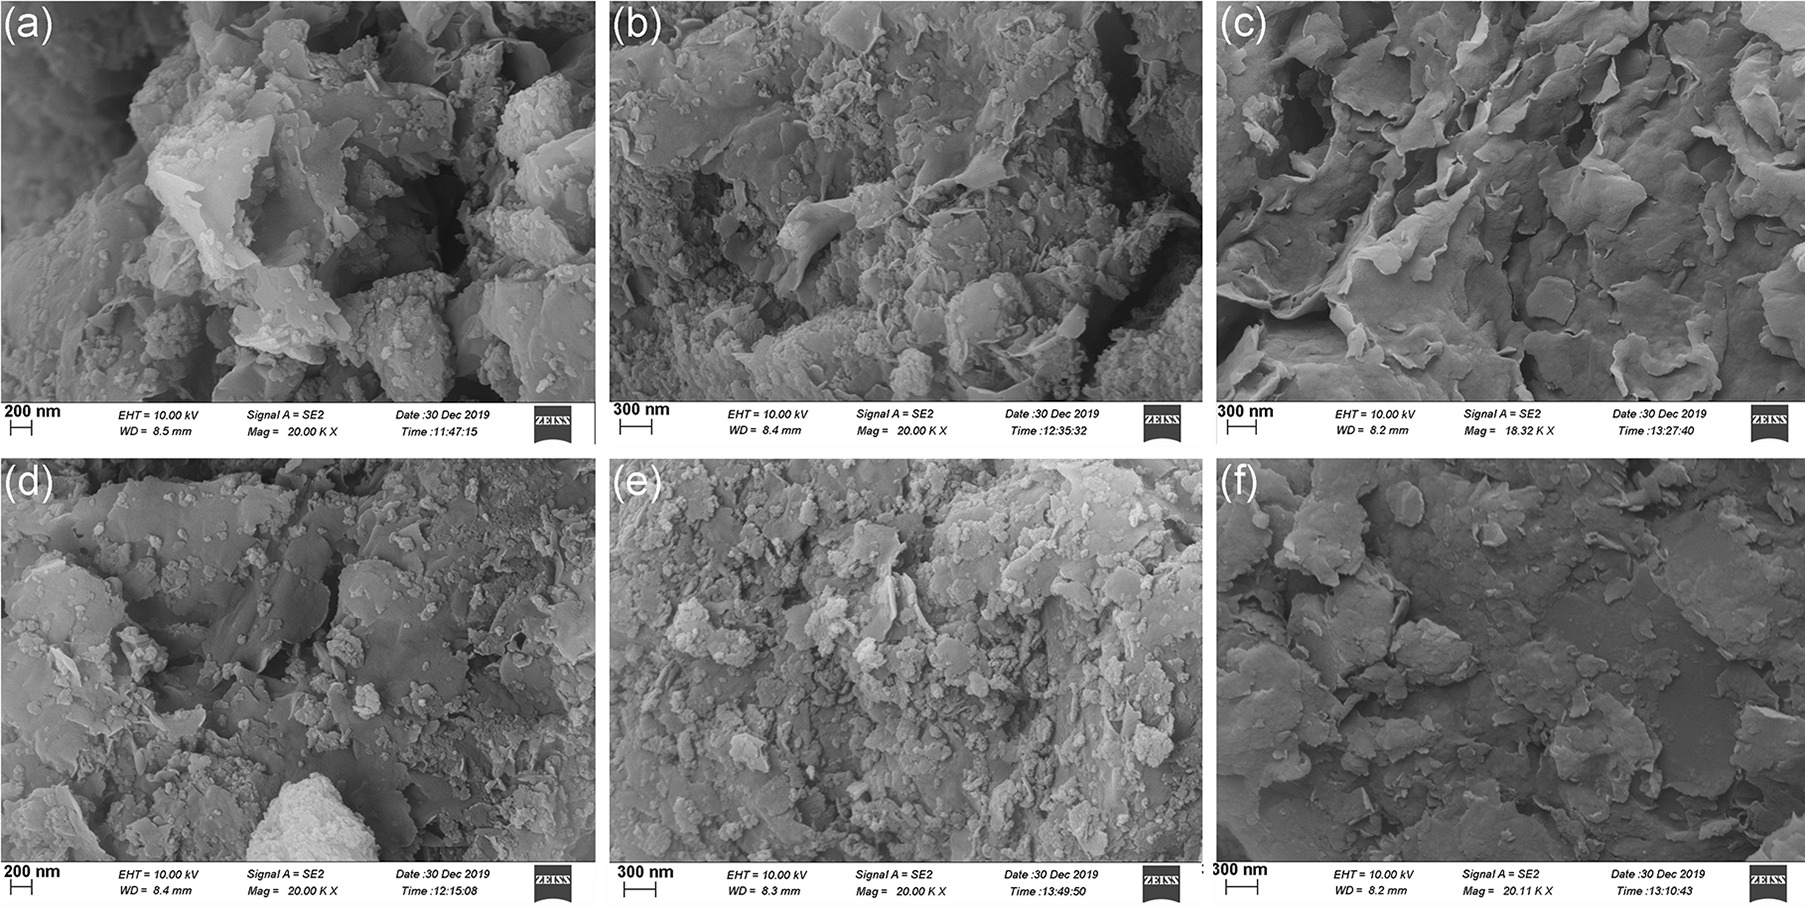
The montmorillonite layers in bentonite ore were complete and the pore structure between the layers was obvious (Fig. 5a, b, c). The layers of the calcined samples were damaged to varying degrees, and partial melting had occurred (Fig. 5d, e, f). In addition, the pore structure was blocked because the layers had collapsed and were stacked on top of each other. This can be attributed to the dehydroxylation of montmorillonite (caused by high-temperature treatment), which resulted in defects in the crystal structure, and the collapsing of layers blocked pore channels (Sarikaya et al. Reference Sarikaya, Onal, Baran and Alemdaroglu2000; Yang et al. Reference Yang, Yao and Chen2006). Comparison of the images of each sample before and after calcination showed that sample ST was damaged the most, indicating further that the thermal stability of sample ST was the worst among the three samples.
SEM images of the bentonite samples before and after calcination at 600°C, a WH, b XY, c ST, d WH-600, e XY-600, and f ST-600

Performance Change and Underlying Mechanism
The swelling values of samples WH, XY, and ST decreased in sequence; the consumption of methylene blue by the samples (after calcination at 600°C) decreased in turn; and the reusability also decreased in the same sequence (Table 6). Related to the Q m of samples (Table 3), the swelling of bentonite may be concluded to decrease as Q m decreases; the consumption of methylene blue after calcination increases with decreasing Q m , and the reusability decreases with increasing Q m . The Q m in sample WH was least but had the highest level of reusability (78.21%), which was followed by samples XY (9.48%) and ST (6.01%).
Casting performance indicators of the bentonite samples

The chemical composition and the phase-composition characteristics of the bentonite samples, as well as the thermal effects on montmorillonite and the change in the structure and FTIR absorption spectra of the calcinated samples, showed that the reusability of bentonite depended mainly on the thermal stability of montmorillonite. The thermal stability of montmorillonite, in turn, depended on the Q m . One concludes, therefore, that the reusability of bentonite depends on Q m . The reusability of bentonite increased with decreasing Q m . The high-temperature stability of bentonite (including the reusability) may have been affected by Q m because the generation and extent of Q m was related to the the substitutions of cations for Al3+ and Si4+ in the octahedral and tetrahedral sites. When the amount of Al3+ substitution in montmorillonite was large, resulting in a greater Q m , the structural stability of montmorillonite was reduced (Chai et al. Reference Chai, Li, Jiang and Du2013). During the heat treatment, the temperature at which the structure of montmorillonite was destroyed decreased, thus affecting the reusability of bentonite. In contrast, when the amount of substitution for Al3+ was small, Q m was small, the stability improved, and the thermal stability was also enhanced. Combined with the structural formula (Table 3) of the three samples, the amount of Al3+ substitution was largest in sample ST, moderate in sample XY, and smallest in sample WH. This showed that the thermal stability of bentonite (including its reusability) depended on the Q m and increased with decreasing Q m .
Conclusions
Samples from three mines (WH, XY, and ST) were all Ca-bentonite, and the main mineral impurities were quartz-type impurities. The Q m of sample ST was greatest (0.725 e/huc), followed by sample XY (0.470 e/huc), and sample WH (0.354 e/huc). The dehydroxylation temperatures were 701, 684, and 630°C, respectively, which decreased with increasing Q m . The XRD and FTIR data showed that after the three samples were calcined at 600°C for 60 min, the order of the structural integrity of montmorillonite was: WH > XY > ST. The reusability of sample WH was 78.21%, followed by sample XY with 9.48% and sample ST with 6.01%, which was proportional to the thermal stability of montmorillonite. The reusability of bentonite depended mainly on the thermal stability of montmorillonite, which, in turn, depends on Q m . The reusability of bentonite increased with decreasing Q m , therefore.
ACKNOWLEDGMENTS
This work was supported by the National Natural Fund of China [grant number 41972042,42072048] and the National Key R & D Program of China [grant number 2018YFC1802902].
Declarations
Conflict of Interest
On behalf of all authors, the corresponding author states that there is no conflict of interest.