1 Introduction
A central task in many empirical investigations is to equalize covariate distributions between groups of units. This could, for example, be in an effort to reduce bias due to confounded treatment assignment under a selection-on-observables assumption. Matching is a popular approach for making such adjustments (Cochran and Rubin Reference Cochran and Rubin1973). A matching method constructs groups of units that are as homogeneous as possible with respect to observed covariates, under the restriction that all matched groups contain at least one unit from each treatment group.
The popularity of matching is arguably due to its conceptual simplicity; fairly complex adjustments can be fully represented as discrete groups of matched units. This makes the analysis easy to understand and easy to communicate to a broader audience. Investigators also appreciate that the method generally is nonparametric and does not require restrictive functional form assumptions. But the conceptual simplicity is deceiving. While the method is easy to understand and use with the matched groups in hand, it is often difficult to construct the groups in the first place. This is because their construction involves an intricate integer programming problem that is computationally intractable unless the sample is small and the design is simple. This forces investigators to use ad hoc methods, which may produce matchings of poor quality. This paper describes a matching method with proven optimality properties that can accommodate complex designs and large samples.
The method we describe is a generalization of full matching, which is a flexible matching method that is optimal for many common use cases (Rosenbaum Reference Rosenbaum1991; Hansen Reference Hansen2004). In particular, among all matching methods that do not discard units, full matching produces matched groups with the least within-group covariate heterogeneity. Conventional full matching is, however, restricted to studies with two treatment conditions where the investigator requires no more than one unit of each treatment condition in each matched group. Subsequently, the application of the method is limited, and investigators are forced to resort to suboptimal approaches for more intricate designs and matching constraints. The method we introduce generalizes full matching to facilitate designs with multiple treatments and complex compositional restrictions.
Existing matching algorithms cannot be used to derive generalized full matchings. The most widely used algorithm for full matching derives optimal solutions (Hansen and Klopfer Reference Hansen and Klopfer2006), and it is thus an excellent choice when it is an option. However, its focus is traditional designs with two treatment conditions. Moreover, the derivation of optimal solutions is computationally demanding, meaning that the algorithm by Hansen and Klopfer (Reference Hansen and Klopfer2006) cannot be used with large samples even when the design is simple. The main contribution of this paper is the development of an algorithm to derive generalized full matchings in a wide range of settings.
The algorithm we describe derives near-optimal generalized full matchings, and it does so quickly even in large samples. A matching produced by the algorithm is guaranteed to be within a factor of four of the optimal solution, ensuring that its worst-case quality is not arbitrarily bad. Simulations show that the algorithm on average performs roughly on par with the optimal full matching algorithm in cases where the optimal algorithm can be used. The generalized full matching algorithm scales well in the sample size, and it terminates in linearithmic time on average. The simulation study shows that it is several orders of magnitude faster than existing approaches. For example, a sample with one million units can be matched in less than a minute on an ordinary laptop computer.
The central discovery that facilitates the results in this paper is that the generalized full matching problem can be represented in a sparse, unweighted graph. This representation encodes information about the units’ treatment assignments, the similarity between units, and the constraints the investigator imposes on the matched groups. With the sparse representation in hand, the construction of the groups is straightforward and fast, so the main computational challenge is to construct the representation from the original data. The main technical contribution of the paper is to show how this can be done quickly for standard metric spaces.
We have previously used a similar approach to derive a blocking algorithm for treatment assignment in randomized experiments (Higgins, Sävje, and Sekhon Reference Higgins, Sävje and Sekhon2016). The experimental design problem is simpler than the matching problem because treatments are not yet assigned, so the units are unlabeled, and the sparse representation of the blocking problem is more immediate. The algorithm in this paper demonstrates that more complex relationships and constraints can also be encoded using a sparse graph representation, and the techniques we discuss here may be helpful in applications involving complex clustering problems more generally.
2 An Illustrative Application
To illustrate the use of the generalized full matching method, we revisit a large-scale voter mobilization experiment by Gerber, Green, and Larimer (Reference Gerber, Green and Larimer2008). The motivation of the original study was the seemingly puzzling fact that rational people vote in elections (Downs Reference Downs1957). The probability that any particular voter is pivotal is negligible, so the benefit of voting appears to be small, but the cost is not. Gerber et al. (Reference Gerber, Green and Larimer2008) investigate whether social norms can provide an explanation.
The authors randomly assigned 344,084 registered voters in the 2006 primary election in Michigan to one of five treatment conditions. The condition of main interest was the receipt of a postcard documenting the voting history of the recipient and their neighbors. The recipients were also informed that updated postcards would be sent out after the election. The purpose was to use social pressure to motivate the recipients to vote. If a recipient abstained, their neighbors would know that they did not conform to the social norm of voting, possibly incurring social costs or stigma. Turnout among recipients of the postcard was
 $37.8\%$
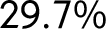
. This is to be compared with a turnout of
 $29.7\%$
in the control group, who did not receive a postcard. The estimated causal effect is therefore
 $8.1$
percentage points, indicating that social pressure was a motivation for these voters.
The Michigan experiment is impressive in both scale and design, but it has one important shortcoming: the sample used in the experiment is not representative of the overall population. Turnout among all registered voters in Michigan was
 $17.7\%$
in the 2006 primary election. We would expect this figure to be close to the turnout of
 $29.7\%$
in the control group if the sample were representative of the population. The purpose of the experiment was to establish whether social pressure can be a determinant of voting, so the authors constructed a sample with individuals deemed to be receptive to the postcard intervention. The practice is methodologically sound in that it maximizes power with respect to the question at hand, but it makes it harder to answer other questions about voting behavior. A careful analysis, adjusting for the systematic differences between the sample and population, is needed to extrapolate from the experiment. This is the task we undertake in this application.
The exercise of generalizing findings from an experiment to a larger population has attracted much recent interest (see, e.g., Stuart et al. Reference Stuart, Cole, Bradshaw and Leaf2011; Tipton Reference Tipton2013; Hartman et al. Reference Hartman, Grieve, Ramsahai and Sekhon2015; Kern et al. Reference Kern, Stuart, Hill and Green2016; Buchanan et al. Reference Buchanan2018; Dehejia, Pop-Eleches, and Samii Reference Dehejia, Pop-Eleches and Samii2019). The typical approach is based on the assumption that all factors used to construct the experimental sample are observed. If this is indeed the case, methods traditionally used to account for confounded treatment assignment in observational studies can be used for the extrapolation. Units not included in the experimental study can be seen as being assigned to an alternative treatment condition, so we can apply methods that aim to adjust for covariate differences between treatment groups. The results from the extrapolation are less reliable than those from the experiment itself, because we rarely know what factors determined the sample. However, the Michigan experiment is an exception in this regard. The construction of the experimental sample was based on the voter file, containing a record for every registered voter in Michigan, and we have access to this data set. In other words, the selection-on-observables assumption is known to be satisfied.
Conceptually, the task ahead is straightforward: we simply need to make the experimental sample comparable to the overall population with respect to observed characteristics in the voter file. Practically, the task is far from trivial. The first challenge is how to account for the information in the voter file. Gerber et al. (Reference Gerber, Green and Larimer2008) worked with a political consultant to construct the sample using proprietary indices of partisanship and voting behavior. We know that these indices were constructed based on information in the voter file, including geographical coordinates derived from addresses, but we do not know how the information was used. While the information itself is observed, the relevant functional form is unknown and likely complex. In particular, we cannot rule out that auxiliary geographical information has been merged with the voter file and subsequently used in the construction of the sample.
The presumingly complex sample selection procedure rules out adjustment methods that aim to equalize aggregated characteristics between the treatment groups. Examples of such methods include various types of regression adjustments and methods that assign weights to the observations to equalize targeted covariate moments (see, e.g., Graham, De Xavier Pinto, and Egel Reference Graham, De Xavier Pinto and Egel2012; Hainmueller Reference Hainmueller2012; Diamond and Sekhon Reference Diamond and Sekhon2013; Imai and Ratkovic Reference Imai and Ratkovic2014). In contrast, matching methods can accommodate arbitrary metrics encoding similarity between units, and such metrics can be constructed to include the geographical coordinates in a flexible, nonparametric way. Matching is for this reason a good choice as an adjustment method in the current application. Unlike moment-based approaches, the treatment groups after matching adjustment will be approximately similar with respect to the entire joint covariate distribution if an appropriate distance function is used. However, this comes at the cost of less balance on the moments that are specifically targeted by the moment-based approaches.
The choice of matching-based adjustments for the analysis leads us to the second challenge. The experiment was large and complex, with 344,084 participants and five treatment conditions. After adding the overall population from the complete voter file, the data set consists of 6,762,701 observations divided between six effective treatment conditions. The typical application of matching methods involves a study with two treatment conditions and at most a few thousand observations. To the best of our knowledge, no existing matching method can accommodate this setting, and this provides the motivation for the development of the matching method we describe in this paper.
The subsequent sections describe the generalized full matching method and the associated algorithm in detail. We conclude by returning to the Michigan voter mobilization experiment to investigate what the effect would have been if the treatments were scaled up to the complete population.
3 Generalized Full Matching
3.1 Background
Matching methods make treatment groups comparable by reweighting units with treatment assignments that are over- or underrepresented given their characteristics. That is, units assigned to a treatment condition that is uncommon locally in the covariate space are given a larger weight than neighboring units assigned to a common condition. The reweighting is sometimes implicit. For example, this is the case for matching methods that discard units. In the Michigan experiment, people with a higher baseline propensity to vote were overrepresented, so they must be downweighted to make the experimental sample representative of the overall population.
We might be able to perfectly equalize the covariate distribution between the treatment groups when the confounders are few and coarse. That is, we can construct an exact matching. This is achieved by stratifying the sample based on the confounders so that all units within each matched group are identical. Exact matchings are rarely possible because balance is often sought on continuous and other high-dimensional variables. In these cases, the units are instead partitioned into groups that are as homogeneous as possible, but not necessarily identical, producing an approximate matching.
The construction of matched groups involves several considerations. The most immediate one is the objective of the matching, namely, to make the matched groups homogeneous. Homogeneity is typically assessed through pairwise distances between units based on some distance function deemed relevant for the application at hand. Common choices are the absolute difference between propensity scores (Rosenbaum and Rubin Reference Rosenbaum and Rubin1983), and Euclidean and Mahalanobis distances in the covariate space (Cochran and Rubin Reference Cochran and Rubin1973).
Another important consideration is the composition of the matched groups. The archetypical composition is nearest neighbor matching, which is also called 1:1-matching. Each matched group is here required to contain exactly one treated unit and exactly one control unit. The matching can be done with replacement, where the same unit can be matched to several other units, or without replacement, where each unit is matched to at most one other unit. In both cases, units without matches are discarded. Nearest neighbor matching often yields homogeneous groups, but the approach comes with the obvious disadvantage that large parts of the sample may be ignored in the subsequent analysis.
Rosenbaum (Reference Rosenbaum1991) introduced full matching to address the issue. The method imposes two compositional constraints. First, all units must be assigned to matched groups, so none are discarded. Second, all groups must contain at least one unit of each treatment condition. Rosenbaum (Reference Rosenbaum1991) studies this type of matching in settings with two treatment conditions, and shows that all matched groups in an optimal matching under the two constraints will contain exactly one unit of at least one treatment conditions. The insight allows him to construct an algorithm to construct optimal matchings for a wide range of distance functions. The method enables investigators to construct matched groups of high quality without discarding units. Hansen (Reference Hansen2004) provides important developments, which we discuss in more detail in the concluding remarks.
The conventional formulation of full matching requires a particular design. It can only be used in studies with two treatment conditions when the investigator accepts matched groups with only two units. While most observational studies conform to this design, many do not, meaning that conventional full matching cannot be used. Examples include when there are several treatment conditions or when larger matched groups are needed for heterogeneous treatment effect analysis or variance estimation. Currently, such studies must use cruder matching methods that may introduce bias or increase variance. The following subsection introduces a generalization of conventional full matching that can be used in these more complex settings.
3.2 A Generalization of Full Matching
Consider a sample consisting of n units indexed by
 $\mathbf {U} = \{1, 2, \ldots , n\}$
. The units have been assigned to one of k treatment conditions indexed by
 $\{1, 2, \ldots , k\}$
through an unknown or partially unknown process. Let
 $W_i$
denote the condition that unit i is assigned to. We construct a set
 $\mathbf {w}_x$
for each treatment condition x that collects the units assigned to the corresponding treatment:
 $$ \begin{align*} \mathbf{w}_x = \{i\in\mathbf{U}: W_i = x\}. \end{align*} $$
A matched group
 $\mathbf {m}$
is a nonempty set of unit indices. A matching
 $\mathbf {M}$
is a set of matched groups:
 $\mathbf {M} = \{\mathbf {m}_1, \mathbf {m}_2, \ldots \}$
. A matching problem is defined by a set of constraints and an objective function. The constraints describe a collection of admissible matchings
 $\mathcal {M}$
, and the objective function
 $L: \mathcal {M} \rightarrow \mathbb {R}$
maps from the admissible matchings to a real-valued measure of match quality.
Definition 1 An optimal matching
 $\mathbf {M}^*$
is an admissible matching that minimizes the matching objective:
 $$ \begin{align*} L(\mathbf{M}^*)= \min_{\mathbf{M}\in\mathcal{M}} L(\mathbf{M}). \end{align*} $$
Generalized full matching imposes the constraint that each unit is assigned to exactly one group. The investigator can also impose constraints on the composition of the matched groups. In particular, for each treatment condition x, one can require that each matched group contains at least
 $c_x$
units assigned to the corresponding condition. One can also require that each group contains at least t units in total, irrespective of treatment assignment.
Definition 2 An admissible generalized full matching for constraints
 $\mathcal {C}=(c_1, \ldots , c_k, t)$
is a matching
 $\mathbf {M}$
that satisfies:
-
1. (Spanning)
 $\bigcup _{\mathbf {m}\in \mathbf {M}}\mathbf {m} = \mathbf {U}$
,
-
2. (Disjoint)
$\forall \mathbf {m}, \mathbf {m}'\in \mathbf {M}, \mathbf {m} \neq \mathbf {m}' \implies \mathbf {m} \cap \mathbf {m}' = \emptyset $
, -
3. (Treatment constraints)
$\forall \mathbf {m}\in \mathbf {M}, \forall x \in \{1, \ldots , k\}, |\mathbf {m} \cap \mathbf {w}_x| \geq c_x$
, -
4. (Overall constraint)
$\forall \mathbf {m}\in \mathbf {M}, |\mathbf {m}| \geq t$
.


The set
 $\mathcal {M}_{\mathcal {C}}$
collects all admissible generalized full matchings for constraints
 $\mathcal {C}$
.
As an example, consider a study with three treatment conditions. The constraint
 $\mathcal {C}=(2, 2, 4, 10)$
would restrict the admissible matchings to those where each matched group contains at least two units each of the first and second treatment conditions, at least 4 units of the third condition and at least 10 units in total.
When we impose the constraint that each matched group contains at least one unit of each treatment condition, we recover the conventional full matching definition for studies with an arbitrary number of treatment conditions.
Definition 3 A conventional full matching in a study with k treatment conditions is a generalized full matching with the matching constraints
 $\mathcal {C}=(1, 1, \ldots , 1, k)$
.
Our definition of full matching differs slightly from the original definition in Rosenbaum (Reference Rosenbaum1991). For studies with two treatment conditions, the conventional definition requires, in addition the conditions in Definition 3, that each matched group contain exactly one treated unit or exactly one control unit. That is, we have
 $|\mathbf {m} \cap \mathbf {w}_1| = 1$
or
 $|\mathbf {m} \cap \mathbf {w}_2| = 1$
for each
 $\mathbf {m}$
in
 $\mathbf {M}$
. However, as implied by Proposition 1 in Rosenbaum (Reference Rosenbaum1991), the optimal generalized full matching with constraints
 $\mathcal {C}=(1, 1, 2)$
is by necessity a full matching according to the original definition. As a result, we can disregard the additional conditions imposed by Rosenbaum (Reference Rosenbaum1991) and equivalently define full matchings as the optimal solution to the broader class of matching problems given by Definition2.
3.3 Near-Optimal Matchings
The problem of finding an optimal generalized full matching is NP-hard (Higgins et al. Reference Higgins, Sävje and Sekhon2016). Informally, this means that the problem is at least as computationally difficult as any NP problem, which is a class of decision problems for which proofs of affirmative answers are verifiable in polynomial time. Formally, the property signifies that every NP problem can be reduced in polynomial time to an instance of the generalized full matching problem (Sipser Reference Sipser2012). This is relevant from a practical perspective because near consensus exists among computer scientists that NP-hard problems are infeasible to solve to optimality for large inputs. Hence, it is unlikely that an algorithm exists that is both computationally tractable and optimal for the generalized full matching problem.
The route we take to achieve computational tractability is to focus on approximate optimality. That is, to facilitate an algorithm that is useful in practice, we will accept matchings that are not fully optimal. But we want to avoid matchings of low quality, so we seek a guarantee that the quality of the produced matching is close to optimal. As formalized in the following definition, a matching is said to be approximately optimal if it is within a constant factor of the optimal solution. An algorithm is said to be approximately optimal if the matchings it constructs are guaranteed to be approximately optimal.
Definition 4 An
 $\alpha $
-approximate matching
 $\mathbf {M}^\dagger $
is an admissible matching that is within a factor of
 $\alpha $
of an optimal matching:
 $L(\mathbf {M}^\dagger ) \leq \alpha L(\mathbf {M}^*)$
.
4 An Algorithm for Generalized Full Matchings
We now turn to the description of the algorithm used to construct near-optimal generalized full matchings. The algorithm is an extension of the blocking algorithm introduced by Higgins et al. (Reference Higgins, Sävje and Sekhon2016). Blocking is an experimental design where similar units are grouped together into blocks and treatment is assigned within the blocks. Matching and blocking are similar in that they try to balance covariate distributions across treatment conditions through a grouping of units. However, because treatment has not yet been assigned in blocking problems, such algorithms only need to consider overall size constraints. To solve matching problems, we must be able to impose more detailed compositional constraints.
4.1 Matching Objective
The matching objective is based on summaries of pairwise distances between units. Let
 ${d}: \mathbf {U}\times \mathbf {U} \rightarrow \mathbb {R}^+$
be a distance function capturing similarity between any pair of units, where lower values indicate greater similarity. We allow for the use of a pseudometric, meaning that distance function satisfies:
-
1. (Non-negativity)
$\forall i,j\in \mathbf {U}, {d}(i,j) \geq 0$
, -
2. (Self-similarity)
$\forall i\in \mathbf {U}, {d}(i,i) = 0$
, -
3. (Symmetry)
$\forall i,j\in \mathbf {U}, {d}(i,j) = {d}(j,i)$
, -
4. (Triangle inequality)
$\forall i,j,\ell \in \mathbf {U}, {d}(i,j) \leq {d}(i,\ell ) + {d}(\ell , j)$
.


All commonly used similarity measures satisfy these conditions, including absolute differences between propensity scores, and Euclidean and Mahalanobis distances in a covariate space.
The objective function used in full matching is conventionally either a weighted mean of within-group distances between treated and control units (Rosenbaum Reference Rosenbaum1991) or the sum of such distances (Hansen Reference Hansen2004). We will depart from this convention in two ways. First, we use a bottleneck objective function; that is, we minimize the maximum within-group distance. The main motivation for this shift is that the bottleneck objective facilitates the computationally efficient algorithm we present below. However, while we only prove approximate optimality with respect to the maximum distance, the simulation study indicates that the algorithm also performs well with respect to the mean distance. Apart from computational considerations, minimizing the maximum distance has the advantage of avoiding devastatingly poor matches that might be undetected by, for example, the mean distance (Rosenbaum Reference Rosenbaum2017).
The second departure is that we consider all within-group distances, not only those between units assigned to different treatment conditions as in the existing literature. In the conventional full matching setting, there is little difference between the two objectives, but with more than two treatment conditions and larger matched groups, the conventional objective risks ignoring important within-group distances. To maintain consistency with the current literature, we will also investigate the bottleneck objective that only includes within-group distances between units assigned to different conditions. In symbols, the two objective functions are
 $$ \begin{align*} {L_{\scriptstyle \mathrm{BN}}}(\mathbf{M}) &= \max_{\mathbf{m}\in\mathbf{M}}\max\{{d}(i,j) : i,j\in\mathbf{m}\},\\ {L_{\scriptstyle \mathrm{WBN}}}(\mathbf{M}) &= \max_{\mathbf{m}\in\mathbf{M}}\max\{{d}(i,j) : i,j\in\mathbf{m}\wedge W_i\neq W_j\}. \end{align*} $$
4.2 Graph Theoretical Preliminaries
The description of the algorithm and the proofs of its properties rely heavily on graph theory. The central insight is that one can describe relations between units in the sample using directed graphs, or digraphs. A digraph
 $G = (\mathbf {V},{\mathbf {E}})$
consists of a set of vertices
 $\mathbf {V}$
and a set of directed edges, or arcs,
 ${\mathbf {E}}$
connecting some or all of the vertices. In our case, the vertices of the graphs represent the units, and the arcs encode various relations between them. The graph can be weighted, in which case each arc is associated with a value. In our case, this value is the similarity between the connected units as given by the distance function
 ${d}(i,j)$
.
We use this graph representation instead of a conventional distance matrix. The reason is that a distance matrix stores the distances between all pairs of units in the sample and thus contains too much information. Considering all pairwise distances is intractable for large samples, and a graph allows us to focus on the most consequential relations. In particular, the full distance matrix corresponds to a complete graph, in which arcs connect all units with all other units, but the graphs we use are sparse, meaning that almost all of the arcs are removed. A sparse graph makes the problem tractable. Importantly, unlike a sparsified distance matrix, our graph representation does not need to be rectangular.
We next define the most central concepts used to construct the graph representation of the matching problem. The supplementary materials provide a brief overview of additional graph theoretical concepts and terminology.
Definition 5 A closed neighborhood of vertex i in digraph
 $G = (\mathbf {V},{\mathbf {E}})$
is a subset of vertices
 $ \operatorname {\mathrm {N}}[i] \subset \mathbf {V}$
consisting of i itself and all vertices
 $j\in \mathbf {V}$
with an arc from i to j:
 $$ \begin{align*} \operatorname{\mathrm{N}}[i] = \{j\in \mathbf{V}: (i,j)\in {\mathbf{E}}\} \cup \{i\}. \end{align*} $$
Definition 6 An
 $\mathbf {IJ}$
-digraph, denoted
 $G(\mathbf {I} \rightarrow \mathbf {J})$
, is a graph
 $G = (\mathbf {I} \cup \mathbf {J}, {\mathbf {E}}_{\mathbf {IJ}})$
with arcs drawn from all vertices in
 $\mathbf {I}$
to all vertices in
 $\mathbf {J}$
:
 $$ \begin{align*} {\mathbf{E}}_{\mathbf{IJ}} = \{(i,j) : i \in \mathbf{I} \wedge j \in \mathbf{J} \}. \end{align*} $$
Self-loops (arcs from i to i) are drawn for all vertices
 $i\in \mathbf {I}\cap \mathbf {J}$
.
Definition 7 A
 $\kappa $
-nearest neighbor digraph of
 $G = (\mathbf {V},{\mathbf {E}})$
is a spanning subgraph of G where an arc
 $(i,j)\in {\mathbf {E}}$
is in the nearest neighbor digraph if j is one of the
 $\kappa $
closest vertices to i according to
 ${d}(i,j)$
among all its outward-pointing arcs. That is, for each
 $i\in \mathbf {V}$
, sort
 $(i,j)\in {\mathbf {E}}$
by
 ${d}(i,j)$
and keep the
 $\kappa $
smallest arcs. If ties exist, give priority to self-loops and otherwise resolve them arbitrarily. We denote
 $\kappa $
-nearest neighbor graphs as
 $ \operatorname {\mathrm {NN}}(\kappa , G)$
.
4.3 The Algorithm
The following steps describe how a matching is constructed given a sample
 $\mathbf {U}$
, matching constraints
 $\mathcal {C}=(c_1, \ldots , c_k, t)$
, and distance metric
 ${d}(i,j)$
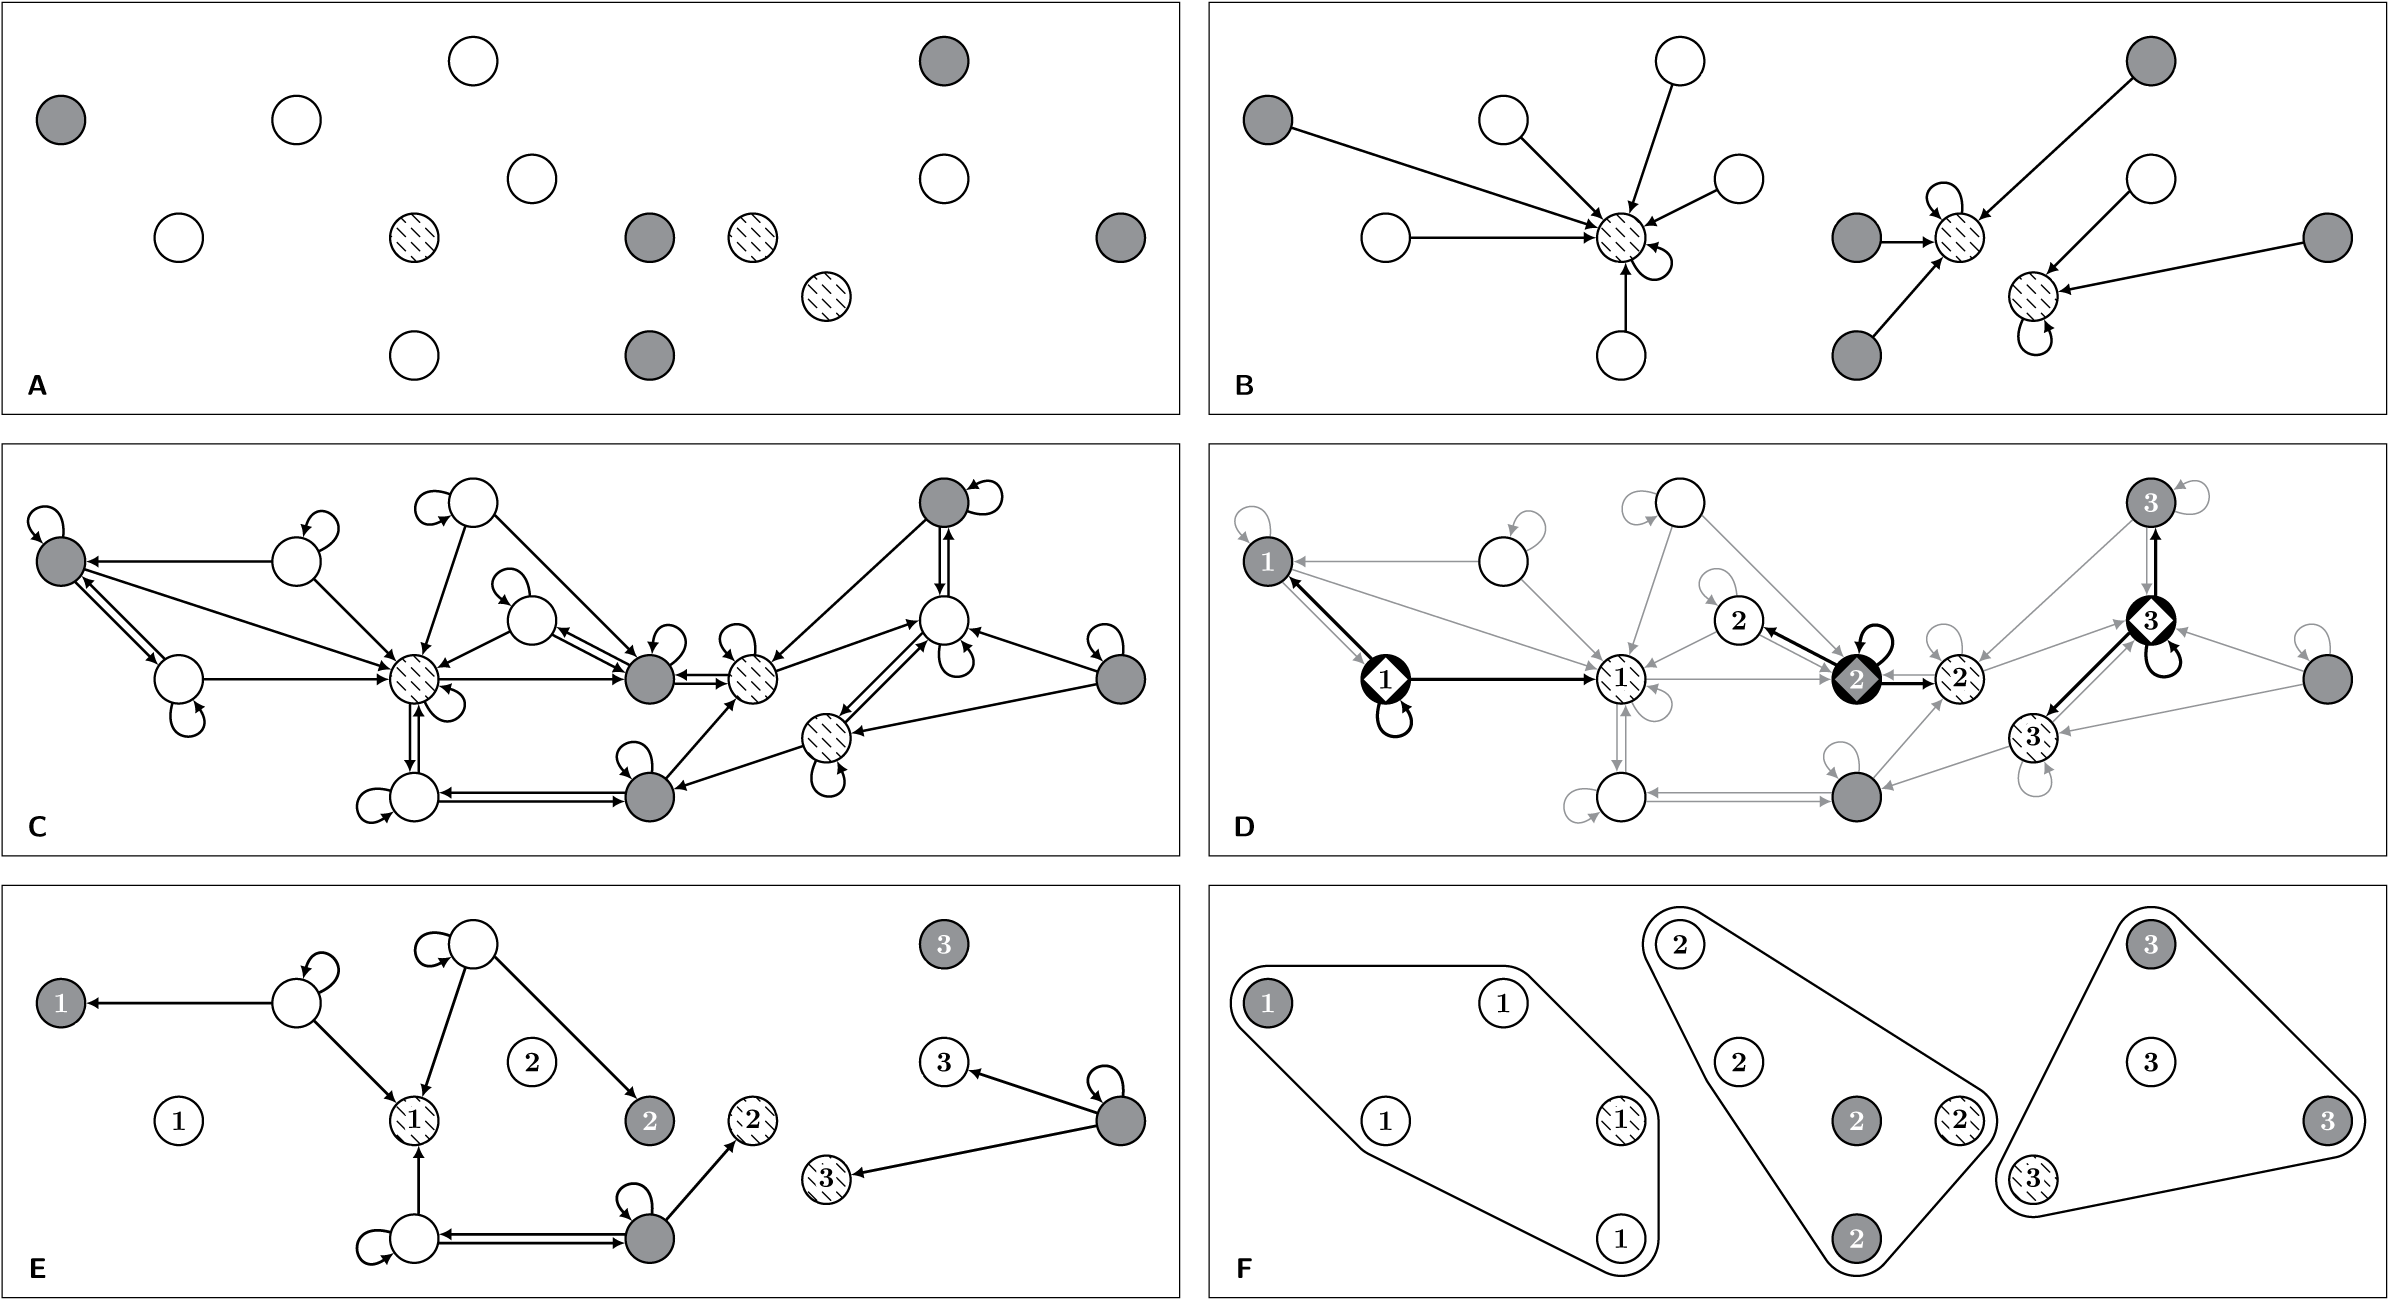
. Figure 1 provides an illustration.
-
1. For each treatment condition
$x\in \{1, 2, \ldots , k\}$
, construct the
$c_x$
-nearest neighbor digraph of the
$\mathbf {U}\mathbf {w}_x$
-digraph. Construct the union of these graphs:
$$ \begin{align*} G_w = \operatorname{\mathrm{NN}}(c_1, G(\mathbf{U}\rightarrow \mathbf{w}_1)) \cup \cdots \cup \operatorname{\mathrm{NN}}(c_k, G(\mathbf{U} \rightarrow \mathbf{w}_k)). \end{align*} $$
-
2. Let
$r = t - c_1 - \cdots - c_k$
be the number of units needed to satisfy the overall size constraint in excess of the treatment-specific constraints. Construct a digraph
$G_r$
by drawing an arc from i to each of its r nearest neighbors (of any treatment status) given that this arc does not exist in
$G_w$
:
$$ \begin{align*} G_r = \operatorname{\mathrm{NN}}(r, G(\mathbf{U} \rightarrow \mathbf{U}) - G_w), \end{align*} $$
where
$G(\mathbf {U}\rightarrow \mathbf {U})$
is the complete digraph over
$\mathbf {U}$
and the graph difference
$G(\mathbf {U}\rightarrow \mathbf {U}) - G_w$
removes all arcs in
$G(\mathbf {U}\rightarrow \mathbf {U})$
that exist in
$G_w$
. We refer to the union
$G_{\mathcal {C}} = G_w \cup G_r$
as the
$\mathcal {C}$
-compatible nearest neighbor digraph. -
3. Find a set of vertices
$\mathbf {S}\subset \mathbf {U}$
, referred to as seeds, such that their closed neighborhoods in
$G_{\mathcal {C}}$
are nonoverlapping and maximal in the sense that adding any additional vertex to
$\mathbf {S}$
would create some overlap. That is,
$\mathbf {S}$
has the following two properties with respect to
$G_{\mathcal {C}}$
:-
• (Independence)
$\forall i,j\in \mathbf {S}, \operatorname {\mathrm {N}}[i]\cap \operatorname {\mathrm {N}}[j] = \emptyset $
. -
• (Maximality)
$\forall j \not \in \mathbf {S}, \exists i\in \mathbf {S}, \operatorname {\mathrm {N}}[i]\cap \operatorname {\mathrm {N}}[j] \neq \emptyset $
.
-
-
4. Assign a unique label to each seed. Assign the same label to all vertices in the seed’s neighborhood in
$G_{\mathcal {C}}$
. We refer to vertices that are labeled in this step as labeled vertices. -
5. For each vertex i without a label, find its closed neighborhood
$N[i]$
in
$G_{\mathcal {C}}$
and assign it the same label as one of the labeled vertices in the neighborhood.



When the algorithm terminates, each vertex has been assigned a label. Vertices that share the same label form a matched group. The collection of labels thus forms a matching. Let
 ${\mathbf {M}_{\scriptstyle \mathrm{ALG}}}$
denote this matching.
The generalized full matching algorithm. The sample in this example consists of 14 units divided between three treatment conditions. We require that each matched group contains at least one unit of each treatment condition and at least three units in total. We use Euclidean distances based on two covariates. (A) The units are represented as points on the covariate plane. The treatment conditions of the units are indicated by the points’ color and pattern. (B) Step 1: One of the building blocks of
 $G_w$
is shown, namely the nearest neighbor digraph between the whole sample and the patterned units:
 $ \operatorname {\mathrm {NN}}(1, G(\mathbf {U}\rightarrow \mathbf {w}_{\text {patterned}}))$
. (C) Step 2: The
 $ \mathcal {C}$
-compatible nearest neighbor digraph
 $G_{\mathcal {C}}$
is created. Note that all vertices in this graph are pointing to one vertex of each treatment condition and that no graph exists with shorter arcs that satisfy this condition. (D) Step 3: A set of seeds is found. Seeds are indicated with a diamond shape enclosed in their circles. The arcs pointing out from the seeds are highlighted. Note that no two seeds are pointing to a common unit. Step 4: Each seed and its neighbors are given a unique label as indicated by the numbers. (E) Step 5: Some units are still unlabeled. Each such unit is assigned a label that is represented in its neighborhood. All outward-pointing arcs from unlabeled units are shown in this panel. (F) The algorithm has terminated. Matched groups are formed by units sharing the same label.

5 Properties
The algorithm and the matching it constructs have two key properties. First,
 ${\mathbf {M}_{\scriptstyle \mathrm{ALG}}}$
is a 4-approximate generalized full matching. That is, it is an admissible generalized full matching, and the maximum within-group distance in the matching is guaranteed to be less or equal to four times the maximum within-group distance in an optimal matching. Second, the algorithm terminates quickly. In this section, we discuss these properties in detail. Formal proofs are presented in the supplementary materials.
5.1 Optimality
Approximate optimality follows from two properties of the
 $\mathcal {C}$
-compatible nearest neighbor digraph, described by the following two lemmas.
Lemma 8 The closed neighborhood of each vertex in the
 $\mathcal {C}$
-compatible nearest neighbor digraph
 $G_{\mathcal {C}} = (\mathbf {V}, {\mathbf {E}}_{\mathcal {C}})$
satisfies the matching constraints
 $\mathcal {C}=(c_1, \ldots , c_k, t)$
:
 $$ \begin{align*} \forall i\in \mathbf{V},\, \forall x \in \{1, \ldots, k\},\, |\operatorname{\mathrm{N}}[i] \cap \mathbf{w}_x| \geq c_x \quad \text{and} \quad \forall i\in \mathbf{V},\, |\operatorname{\mathrm{N}}[i]| \geq t. \end{align*} $$
Lemma 9 The distance between any two vertices connected by an arc in the
 $\mathcal {C}$
-compatible nearest neighbor digraph
 $G_{\mathcal {C}} = (\mathbf {V}, {\mathbf {E}}_{\mathcal {C}})$
is less or equal to the maximum within-group distance in an optimal matching:
 $$ \begin{align*} \forall (i,j)\in {\mathbf{E}}_{\mathcal{C}},\; {d}(i,j) \leq \min_{\mathbf{M}\in\mathcal{M}_{\mathcal{C}}} {L_{\scriptstyle \mathrm{BN}}}(\mathbf{M}). \end{align*} $$
Lemma 8 states that the
 $\mathcal {C}$
-compatible nearest neighbor digraph encodes the matching constraints in the units’ neighborhoods in
 $G_{\mathcal {C}}$
. Admissibility of
 ${\mathbf {M}_{\scriptstyle \mathrm{ALG}}}$
follows from the fact that each matched group is a superset of such a closed neighborhood. Since each neighborhood satisfies the matching constraints, so will each matched group.
Lemma 9 provides a connection between the arc weights in the
 $\mathcal {C}$
-compatible nearest neighbor digraph and the maximum distance in the optimal solution. To understand this connection, observe that one can construct a digraph that is compatible with
 $\mathcal {C}$
, in the sense that it satisfies the matching constraints in Lemma 8, as a subgraph of the cluster graph induced by an optimal matching. This digraph satisfies the property in Lemma 9 because its construction does not require the addition of any arc not already in the optimal matching. We show in the supplementary materials that
 $G_{\mathcal {C}}$
is the digraph that minimizes the bottleneck objective among all digraphs that are compatible with
 $\mathcal {C}$
. Consequently, the distances between adjacent units in
 $G_{\mathcal {C}}$
must be bounded in the same way as in the subgraph induced by an optimal matching, and Lemma 9 follows.
Approximate optimality follows from the triangle inequality. In particular, we show in the supplementary materials that there always exists a path of at most two arcs in the
 $\mathcal {C}$
-compatible nearest neighbor digraph between each unit and the seed in its matched group. This implies that any two units in the same matched group are at most at a geodesic distance of four arcs. The worst case is when the five vertices connected by these four arcs are lined up on a straight line in the metric space. In that case, the distance between the two end vertices is the sum of the distances of the intermediate arcs. Lemma 9 provides a bound for the intermediate arc distances and thus a bound for all within-group distances, arriving at the following theorem.
Theorem 10
 ${\mathbf {M}_{\scriptstyle \mathrm{ALG}}}$
is a 4-approximate generalized full matching with respect to the matching constraint
 $\mathcal {C}=(c_1, \ldots , c_k, t)$
and matching objective
 ${L_{\scriptstyle \mathrm{BN}}}$
:
 $$ \begin{align*} {\mathbf{M}_{\scriptstyle \mathrm{ALG}}} \in \mathcal{M}_{\mathcal{C}} \quad \text{and} \quad {L_{\scriptstyle \mathrm{BN}}}({\mathbf{M}_{\scriptstyle \mathrm{ALG}}}) \leq \min_{\mathbf{M}\in\mathcal{M}_{\mathcal{C}}} 4 {L_{\scriptstyle \mathrm{BN}}}(\mathbf{M}). \end{align*} $$
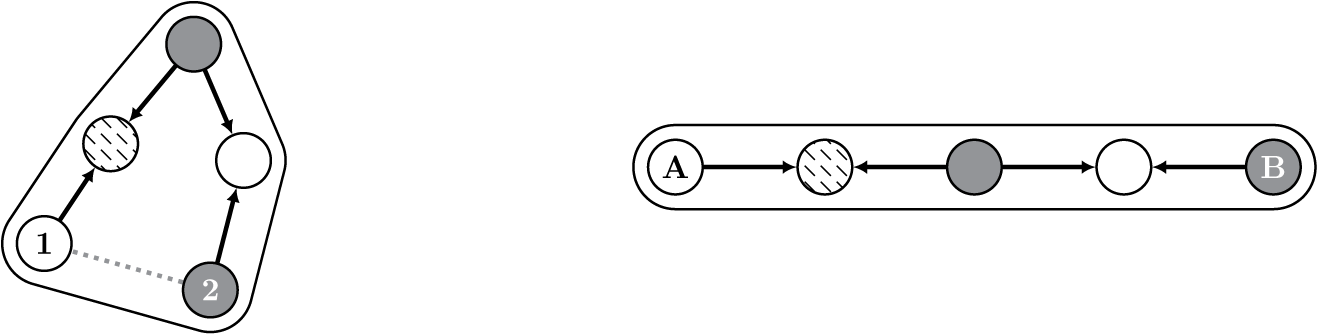
Figure 2 provides an illustration of the intuition behind Theorem 10. The figure depicts two matched groups. Both matched groups contain five units, and two of the units in each group are labeled with either
 $\{1,2\}$
or
 $\{\text {A},\text {B}\}$
. The depicted arcs are a subset of the arcs in the
 $\mathcal {C}$
-compatible nearest neighbor digraph. The labeled units within each matched group are at a geodesic distance of four from each other, meaning that the shortest path from one of the units to the other contains four arcs. How the geodesic distance translates into distances in the underlying metric space, which in this example is the two-dimensional plane, depends on the geometry of the matched groups.
Illustration of the 4-approximate optimality property.

In the matched group on the left-hand side in the figure, the arcs form a curve in the plane so that units
 $1$
and
 $2$
are quite close to each other as judged by the distance function, even though they are separated by four arcs in
 $G_{\mathcal {C}}$
. The distance
 ${d}(1,2)$
between units
 $1$
and
 $2$
is depicted by the dotted line in the figure. We see that the factor of four in Theorem 10 is very conservative in this case. The group on the right-hand side represents the worst-case geometry, namely when the units on the path between the end units are ordered on a straight line in the metric space. A geodesic distance of four arcs between units A and B now translates to a distance in the metric space that is the sum of the arc lengths. Such a geometry produces the largest distance between the units given the arc lengths, which is the worst-case captured by the theorem.
We can use a similar approach to bound the
 ${L_{\scriptstyle \mathrm{WBN}}}$
objective for the matching produced by the algorithm. In particular, Lemma 9 holds also for the bottleneck objective function with distances only between treated and controls in conventional full matching problems, as described by Definition 3, which yields the following theorem.
Theorem 11
 ${\mathbf {M}_{\scriptstyle \mathrm{ALG}}}$
is a 4-approximate conventional full matching with respect to the matching constraint
 $\mathcal {C}=(1, \ldots , 1, k)$
and matching objective
 ${L_{\scriptstyle \mathrm{WBN}}}$
:
 $$ \begin{align*} {\mathbf{M}_{\scriptstyle \mathrm{ALG}}} \in \mathcal{M}_{\mathcal{C}} \qquad \text{and} \qquad {L_{\scriptstyle \mathrm{WBN}}}({\mathbf{M}_{\scriptstyle \mathrm{ALG}}}) \leq \min_{\mathbf{M}\in\mathcal{M}_{\mathcal{C}}} 4 {L_{\scriptstyle \mathrm{WBN}}}(\mathbf{M}). \end{align*} $$
5.2 Complexity
Following the convention in the matching literature (Abadie and Imbens Reference Abadie and Imbens2006), we consider the number of treatment conditions and the matching constraints as fixed asymptotically. The time complexity is still polynomial if we let these numbers grow proportionally to n, but the exposition becomes less clear.
Theorem 12 In the worst case, the generalized full matching algorithm terminates in polynomial time using linear memory.
The algorithm can be divided into two parts. The first and more intricate part is the construction of the
 $\mathcal {C}$
-compatible nearest neighbor digraph. This essentially acts as a preprocessing step of the remainder of the algorithm. The idea is that
 $G_{\mathcal {C}}$
encodes sufficient information about the sample to ensure approximate optimality, but that it is sparse enough to ensure quick execution. Once
 $G_{\mathcal {C}}$
is constructed, the remaining steps are completed in linear time.
As discussed in the proof of Theorem 12 in the supplementary materials, the
 $\mathcal {C}$
-compatible nearest neighbor digraph can be constructed by
 $O(n)$
calls to a nearest neighbor search subroutine. For an arbitrary metric, each such call has a time complexity of
 $O(n \log n)$
and a space complexity of
 $O(n)$
. It follows that the overall worst-case time complexity is
 $O(n^2 \log n)$
.
Specialized nearest neighbor search algorithms exist for the most commonly used distance functions. For example, when the metric is the Euclidean or Mahalanobis distances in some vector space, large improvements can be expected by storing the data points in a kd-tree (Friedman, Bentley, and Finkel Reference Friedman, Bentley and Finkel1977). Given that the covariate distribution is not too skewed, each search can then be completed in
 $O(\log n)$
time on average. Using this approach, the overall average time complexity would be reduced to linearithmic time,
 $O(n \log n)$
, which is the same time complexity as sorting a list of n numbers.
A disadvantage of the data structures that facilitate fast nearest neighbor search is that they do not scale well with the dimensionality of the underlying vector space. Possible alternative approaches in such cases include reducing the dimensionality prior to matching (e.g., by matching on estimated propensity scores, Rosenbaum and Rubin Reference Rosenbaum and Rubin1983), repeated matching in random low-dimensional projections of the covariate space (Li et al. Reference Li, Vlassis, Kawale and Fu2016) and using approximate nearest neighbor search algorithms (Arya et al. Reference Arya, Mount, Netanyahu, Silverman and Wu1998).
6 Extensions
The algorithm described in Section 4.3 admits several extensions and refinements. First, the set of seeds derived in the third step of the algorithm is not unique. The properties discussed in the previous section hold for any set of seeds, but the exact performance of the matching depends on the units that are selected. A valid set of seeds is the same as a maximal independent vertex set in the graph described by the adjacency matrix
 $\mathbf {A}\mathbf {A}' + \mathbf {A} + \mathbf {A}'$
, where
 $\mathbf {A}$
is the adjacency matrix of
 $G_{\mathcal {C}}$
. We expect improvements if a larger maximal independent set is used as seeds.
Second, in the fifth step of the algorithm, unassigned vertices are assigned to groups based on the
 $\mathcal {C}$
-compatible nearest neighbor digraph. However, as all matching constraints have already been fulfilled in the fourth step, the restrictions encoded in
 $G_{\mathcal {C}}$
are no longer necessary. By restricting the matches to arcs in
 $G_{\mathcal {C}}$
, we might miss matched groups that are closer to the unassigned units. We could improve quality by searching for the closest labeled vertex among all vertices.
Third, it is sometimes beneficial to relax the restriction that all units must be assigned to a matched group. For example, if some regions of the covariate space are sparse with respect to a treatment condition, we could be forced to construct groups of poor quality in order to avoid discarding units. A common way to avoid groups of poor quality is to apply a caliper. That is, we restrict the maximum allowable distance within any matched group to some value. Units that cannot be assigned a group without violating the caliper are discarded. In the algorithm we describe, such a caliper can be imposed in the construction of
 $G_{\mathcal {C}}$
. In particular, by restricting the length of the arcs in
 $G_{\mathcal {C}}$
, we implicitly restrict the maximum allowable distance in the resulting matching. If the second refinement is implemented, we can impose a caliper (perhaps of different magnitude) also when assigning units in the fifth step. Note that the use of a caliper may implicitly change the targeted population, and thus the causal estimand, unless appropriate adjustments are made after the matching step.
Fourth, investigators are occasionally interested in estimating treatment effects only for some subpopulation. For example, it is common to estimate the average treatment effect only for treated units. To estimate such an effect, we only require that units from the subpopulation of interest are assigned to matched groups, and other units can be left unassigned. It can still be beneficial to assign all units to groups as we then take advantage of all information in the sample. However, if there are sparse regions in the covariate space, including all units will often lead to poor match quality. The algorithm allows us to focus the matching to a certain set of units. In particular, by substituting
 $\mathbf {U}$
with some subset
 $\mathbf {B} \subset \mathbf {U}$
in the first two steps of the algorithm, we ensure that all units in
 $\mathbf {B}$
are assigned to matched groups. Units not in
 $\mathbf {B}$
are only assigned to groups insofar as they are needed to satisfy the matching constraints. The unassigned units may later be assigned to groups in the fifth step, preferably with a caliper to avoid impacting match quality.
7 Estimation and Adjustment
Matching methods can be used together with a diverse set of approaches for adjustment and estimation. It is beyond the scope of this paper to review all of them in detail, but we will briefly discuss two such approaches that are often used by investigators. One approach omitted from this discussion, which many investigators find useful, is permutation-based inference (Rosenbaum Reference Rosenbaum2002, Reference Rosenbaum2010). Stuart (Reference Stuart2010) provides an extensive review of other approaches for adjustment and estimation that we were forced to omit.
The first approach is the estimator described by Abadie and Imbens (Reference Abadie and Imbens2006) and Imbens and Rubin (Reference Imbens and Rubin2015) to estimate the average treatment effect for the subpopulation of treated units (att). This estimator calculates the mean outcome difference between treated and control units within each matched group, and it then averages the differences over all groups weighted by the number of treated units:
 $$ \begin{align*} \widehat{\tau}_{\scriptstyle \mathrm{ATT}}(\mathbf{M}) = \sum_{\mathbf{m} \in \mathbf{M}} \frac{|\mathbf{w}_1\cap\mathbf{m}|}{|\mathbf{w}_1|} \left[\frac{\sum_{i\in\mathbf{m}} W_i Y_i}{|\mathbf{w}_1\cap\mathbf{m}|} - \frac{\sum_{i\in\mathbf{m}} (1-W_i) Y_i}{|\mathbf{w}_0\cap\mathbf{m}|}\right], \end{align*} $$
where
 $W_i$
is a conventional binary treatment indicator.
With only a small modification, we can tailor the estimator to estimate the treatment effect between two arbitrary treatments in a study with more than two treatment conditions for an arbitrary subpopulation. Let
 $a, b \in \{1, 2, \ldots , k\}$
be the labels of the two treatment conditions in the treatment effect contrast we seek to estimate, and let
 $\mathbf {B}$
be all units in the sample that belong to the targeted subpopulation. The generalized estimator is then

Observe that we recover the original estimator by setting
 $a = 1$
,
 $b = 0,$
and
 $\mathbf {B} = \mathbf {w}_1$
.
The estimator
 $\widehat {\tau }_{a,b,\mathbf {B}}(\mathbf {M})$
is well-defined as long as each matched group containing at least one targeted unit also contains at least one unit assigned to treatment a and at least one unit assigned to treatment b. The standard version of the generalized full matching algorithm described in Section 4.3 ensures that this condition holds. The condition also holds if the fourth extension discussed in Section 6 is used, provided that the targeted subpopulation
 $\mathbf {B}$
in the estimator is the same subpopulation targeted by the algorithm.
The second approach is the use of matching as a preprocessing step before some other main analysis. This could, for example, be in an effort to make the subsequent analysis less sensitive to model misspecification (Ho et al. Reference Ho, Imai, King and Stuart2007). For nearest neighbor matching and other simple matching methods, the preprocessing is automatic because the method discards a large portion of the units in the matching step. Generalized full matching does not discard units unless specifically instructed to do so by, for example, imposing a caliper. To achieve matching preprocessing with generalized full matching, we must instead weight the units.
Let
 $\mathbf {w}(i)$
and
 $\mathbf {m}(i)$
, respectively, be the treatment group and matched group that contain unit i. For a targeted subpopulation
 $\mathbf {B}$
, which may be the whole sample, the preprocessing weight for unit i is given by
 $$ \begin{align*} v_i = \frac{|\mathbf{B}\cap\mathbf{m}(i)|}{|\mathbf{B}| \times |\mathbf{w}(i)\cap\mathbf{m}(i)|}, \end{align*} $$
where
 $v_i = 0$
if
 $\mathbf {m}(i) = \emptyset $
, which is the case when unit i is not assigned a matched group. The reweighted sample using
 $v_1, \dotsc , v_n$
as weights is preprocessed so that each treatment group has a covariate distribution that is approximately equal to the covariate distribution in
 $\mathbf {B}$
. This highlights the connection between the two approaches discussed in this section: the estimator can be interpreted as the ordinary difference in means estimator when we preprocess the sample using
 $\mathbf {B}$
as the targeted subpopulation. In particular, we have the equality
 $$ \begin{align*} \widehat{\tau}_{a,b,\mathbf{B}}(\mathbf{M}) = \sum_{i\in\mathbf{w}_a} v_i Y_i - \sum_{i\in\mathbf{w}_b} v_i Y_i. \end{align*} $$
8 Simulation Study
We present the results from a small simulation study of an implementation of the generalized full matching algorithm. The comparison is with conventional full matching and nearest neighbor matching with and without replacement. We investigate the standard version of the generalized full matching algorithm, as described in Section 4.3, and a refined version that incorporates the first two extensions discussed in Section 6. We include both optimal and heuristic (“greedy”) implementations of nearest neighbor matching.
We focus on a simple setting where each unit has two covariates distributed uniformly on a plane:
 $$ \begin{align*} X_{1i}, X_{2i} \sim \mathcal{U}(-1,1). \end{align*} $$
To facilitate the comparison with previous methods, there are only two treatment conditions:
 $W_i\in \{0,1\}$
. The units are randomly assigned to one of the two conditions using a logistic propensity score that maps from the covariates to treatment probabilities as
 $$ \begin{align*} \Pr(W_i = 1|X_{1i}, X_{2i}) = \operatorname*{\mathrm{logistic}}\left[\frac{(X_{1i} + 1)^2 + (X_{2i} + 1)^2 - 5}{2}\right]. \end{align*} $$
Units with larger covariate values are thus more likely to be treated. The conditional probability of being assigned treatment
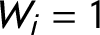 $W_i = 1$
ranges from 7.6% at
 $(-1,-1)$
to 81.8% at (1,1). The unconditional treatment probability is 26.5%. The outcome is given by
 $$ \begin{align*} Y_i = (X_{1i} - 1)^2 + (X_{2i} - 1)^2 + \varepsilon, \end{align*} $$
where
 $\varepsilon $
is standard normal. The outcome does not depend on the assigned treatments, so the treatment effect is constant at zero. We use the estimator
 $\widehat {\tau }_{\scriptstyle \mathrm{ATT}}(\mathbf {M})$
discussed in the previous section to estimate treatment effects.
The Savio cluster at UC Berkeley was used to run the simulations using version 3.3.2 of R. Each simulation round was assigned a single CPU core, largely reflecting the performance of a modern computer. To derive generalized full matchings, we used a development version of the quickmatch R package. Optimal conventional full matchings and optimal nearest neighbor matchings were derived using version 0.9-7 of the optmatch R package (Hansen and Klopfer Reference Hansen and Klopfer2006). Version 4.9-2 of the Matching R package (Sekhon Reference Sekhon2011) was used to derive greedy matchings and matchings with replacement.
The conventional and generalized full matching methods use the same matching constraints, namely that each group contains at least one treated and control unit. We used Euclidean distances on the covariate plane as the similarity measure in all cases. The quickmatch package uses the maximum within-group distance as its objective function, as discussed above. The Matching and optmatch packages use the sum of within-group distances between treated and control units as their objectives. All functionality beside the matching functions (e.g., the estimator) was implemented independently and is common for all matching methods. Replication code is available on the Harvard Dataverse (Sävje, Higgins, and Sekhon Reference Sävje, Higgins and Sekhon2020).
8.1 Run Time and Memory
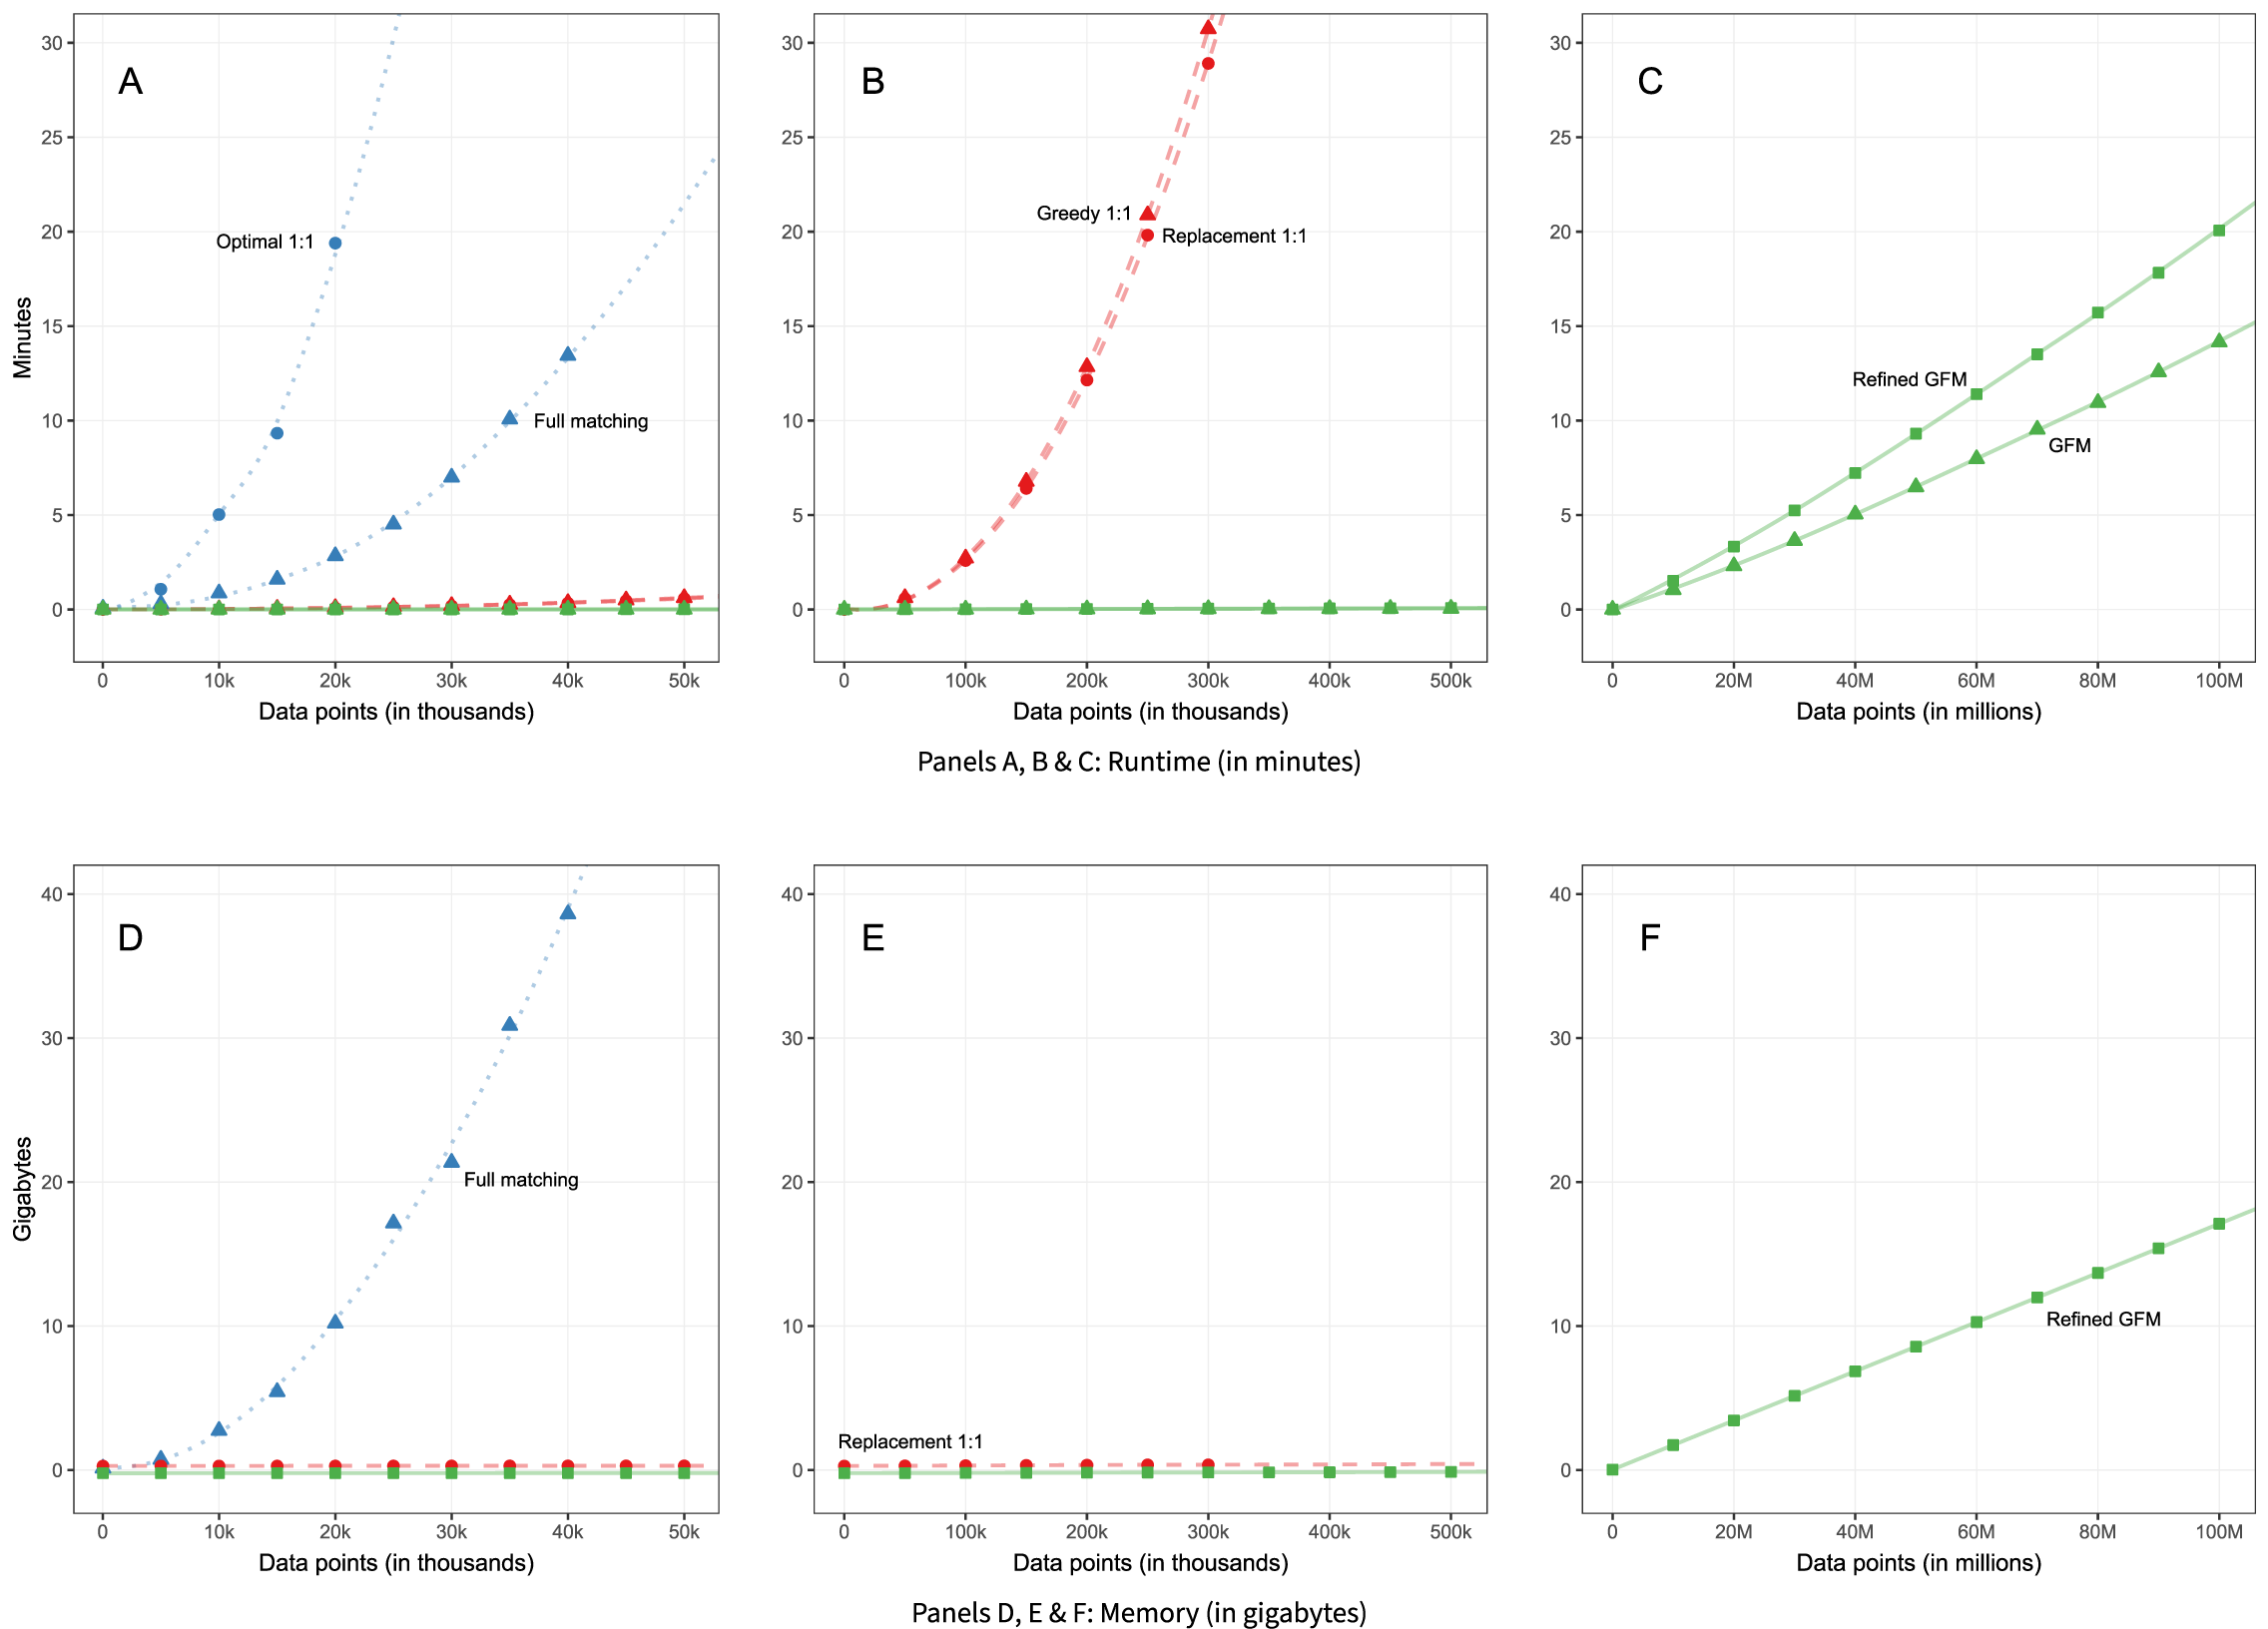
We matched 1,000 randomly generated samples with each matching method for sample sizes ranging from 100 units to 100 million units. Figure 3 presents the computational resources used by each implementation as a function of sample size. Average run times are presented in the first three panels, and memory use is presented in the subsequent three panels. The results are split into several panels with different scales due to the large differences in performance. Table S5 in the supplementary materials provides additional details.
Runtime and memory use by matching method. Marker symbols are actual simulation results, and connecting lines are interpolations. The colors represent different matching packages, and the shape of the marker symbols represent different implementations within the packages. Memory use was identical for methods from the same package, so we present results for only one implementation from each package. Each measure is based on 1,000 simulation rounds. The simulation errors are negligible.

Panels A and D present results for samples with up to 50,000 units. For small sample sizes, all implementations perform well. However, as the sample grows, the optmatch package struggles both with respect to runtime and memory. Already with 10,000 units, optimal nearest neighbor matching takes more than 25 minutes to terminate on average, and with sample sizes over 40,000 units, the package allocates more than 40 gigabytes of memory. The implementations in optmatch are the only ones that derive optimal solutions, but this comes at a large computational cost. The other packages terminate almost instantly with negligible memory use for these sample sizes.
Results for samples with up to 500,000 units are presented in Panels B and E. Implementations from the quickmatch package still terminate virtually instantly with negligible memory use. The Matching package terminates quickly for samples with less than 200,000 units, but its runtime increases after that. More than 30 minutes are required for samples larger than about 300,000 units. Memory use is, however, still negligible.
Panels C and F present samples with up to 100 million units. Both implementations of the generalized full matching algorithm terminate quickly for sample sizes of less than 20 million units. With a sample of 100 million units, the implementation without refinements terminates within 15 minutes on average, while the version with refinements adds about 5 minutes to the runtime. Memory use increases at a slow, linear rate. With a sample of 20 million units, it uses about 4 gigabytes of memory on average. With 100 million units, it allocates slightly more than 17 gigabytes.
8.2 Match Quality
To investigate the quality of the matched groups, we matched 10,000 randomly generated samples containing 1,000 and 10,000 units. The results differ little with sample size, so we present the results for samples with 10,000 units here, and the results for samples with 1,000 units in the supplementary materials. We also restrict our attention in the main paper to covariate balance and the behavior of the treatment effect estimator. We investigate group structure and various aggregated distance measures in the supplementary materials.
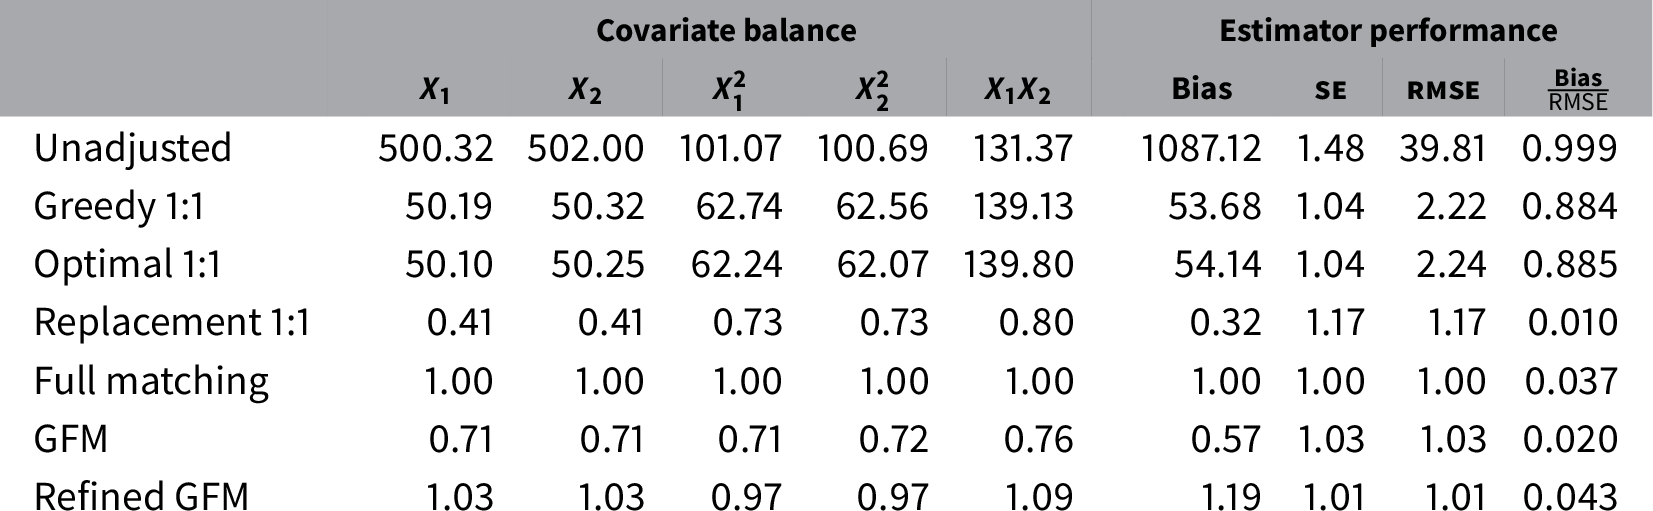
The first five columns of Table 1 present the absolute mean difference between the adjusted treatment groups on the first two moments of the covariates. The adjustment used to assess covariate balance is the same as for the estimator. We include the balance in the unadjusted sample before matching for comparison. The scaling of the balance is arbitrary, so the results are normalized by the results for conventional full matching to ease interpretation.
Performance of matching methods with samples of 10,000 units.

Note: The first five columns present treatment group differences in the first two moments of the covariates after matching adjustment. The next three columns present the bias, standard error and root mean square error of a matching treatment effect estimator. The final column is the bias-to-root mean square error ratio. All columns except the last have been normalized by the result for full matching.
How well the methods balance the samples depends on the data generating process. If, for example, the propensity score is constant, matching would only correct chance imbalances due to sampling variability and, thus, only lead to minor improvements compared to the unadjusted sample. We do not know how representative the simulation study is of the methods’ performance in general, but we have no reason to believe the qualitative conclusions would change.
All matching methods yield large improvements in covariate balance compared to the unadjusted sample. The one exception is the cross-moment of the covariates for the two implementations of nearest neighbor matching without replacement, where the balance is slightly worse than when no adjustment is performed. This is largely an effect of those moments already being fairly balanced in the unadjusted sample. The four remaining implementations lead to large improvements on all moments. Nearest neighbor matching with replacement produces the greatest balance, with the full matching methods as a close second. Nearest neighbor matching with replacement achieves its balance by discarding
 $54.7\%$
of the units in the sample (see Table S2 in supplementary materials). The full matching method does not discard any units, so it takes advantage of all information in the sample, and it does so with only a small decrease in balance. We note that generalized full matching without refinements leads to better balance than the other two full matching methods. We have not found an explanation for this behavior, and we do not expect it to hold across settings.
We continue with an investigation of the behavior of the treatment effect estimator under the different matching methods. As with the balance measures, these results depend on the details of the data generating process. While the quantitative details might not generalize, the qualitative conclusions should. The final four columns in Table 1 present the results.
The first of these four columns presents the absolute value of the bias of the estimator. As expected, the estimator has substantial bias in the unadjusted sample. Nearest neighbor matching without replacement leads to a reduction of about 95%. While this is a large improvement, it is still more than an order of magnitude greater than the bias for nearest neighbor matching with replacement and full matching.
The second column presents the estimator’s standard error. The standard error depends mainly on two factors. First, while the purpose of matching is to adjust for systematic covariate differences between the treatment groups, it will also adjust for unsystematic differences. Such chance-imbalances lead to increased estimator variance, and matching may therefore improve precision. Second, for a given level of balance, larger variation in the weights induced by the matching will lead to a greater standard error because the information in the sample is used less effectively. The trade-off between balance and weight variability is reflected in the standard errors. This is particularly evident when the standard errors for nearest neighbor matching with and without replacement are compared. Matching with replacement induces a larger variation in the matching weights, and the standard error is
 $12.5\%$
larger compared to matching without replacement.
The final two columns investigate the root mean square error (RMSE) of the estimator and the bias’s share of this error. The full matching methods lead to both low bias and variance, so they yield a low total error. Matching with replacement yields a 17% larger RMSE compared to conventional full matching, but this is still considerably lower than matching without replacement. The bias-to-RMSE ratio shows whether conventional confidence statements will capture the true uncertainty of the treatment effect estimator. In particular, if the systematic error is a large part of the total error, variance estimators will not reflect the true accuracy of the estimation, and conclusions drawn from the results may be misleading. This measure is scale-free, and it is therefore not normalized. As expected, the RMSE consists almost exclusively of bias in the unadjusted sample. Any conclusions from such analyses are likely very misleading. Matching without replacement only produces minor improvements. In stark contrast, matching with replacement and full matching lead to large reductions in the ratio; the bias is only between 1% and 4% of the RMSE. This ratio critically depends on the dimensionality of the covariate space (Abadie and Imbens Reference Abadie and Imbens2006), but we expect a similar pattern to hold across settings.
9 Extrapolation from a Voter Mobilization Experiment
We return to the voter mobilization experiment discussed in Section 2. The objective is to extrapolate the results from the experiment to the overall population of registered voters in the 2006 Michigan primary election. The experimental sample was constructed from Michigan’s Qualified Voter File (QVF). The Bureau of Elections in Michigan created the QVF in 2002 in an effort to modernize their decentralized voter registration system, and by 2006, the file contained 6,762,701 registered voters.Footnote 1 We ask what the voter turnout would have been if the treatments in the experiment were assigned to the complete population of registered voters in the voter file.
Our focus in this application is point estimation. Given the large size of the experiment, the standard errors are negligible compared to the treatment effects. The bias of the estimator, rather than its variance, is therefore the main concern here, and estimated standard errors will misrepresent the true accuracy of the point estimates. For this reason, we report the point estimates without associated estimates of their variance. In applications where variance is a first-order concern, standard methods of variance estimation for matching estimators can be used (see, e.g., Stuart Reference Stuart2010; Imbens and Rubin Reference Imbens and Rubin2015).
The treatment condition of main interest in Gerber et al. (Reference Gerber, Green and Larimer2008) was the postcard with the voting history of the recipient’s neighborhood (the “Neighbors” condition). The authors were, however, worried that the postcards could affect voting behavior through other channels than social pressure, so they added additional treatment conditions to shed light on this. The first concern was that the postcard would simply remind the recipient of the upcoming election, perhaps prompting an intrinsic sense of moral obligation to vote. A condition was added (“Civic Duty”) with a postcard stating that it was the recipient’s civic duty to vote in the upcoming election, but containing no information about voting history. If social pressure were an important determinant of voting in this sample, we would expect there to be a noticeable difference in turnout between the Neighbors and Civic Duty conditions. A second concern was the so-called Hawthorne effect, namely, that the knowledge that one is being studied can itself affect behavior. A third condition was added (“Hawthorne”) with a postcard stating that the authors would be studying voting behavior in the election, and would be observing the recipient’s voting decision through public records. The final concern was that being reminded of one’s own voting history might affect behavior irrespective of knowledge about the voting pattern of one’s neighbors. The fourth condition (“Self”) was a postcard listing the voting history of the recipient without any information about their neighbors. The final condition was a pure control group in which the registered voters did not receive a postcard.
The first row in Table 2 presents the average turnout within each of the five treatment conditions. We see that the Neighbors condition led to the largest turnout of
 $37.8\%$
, but the three other postcard conditions still increased turnout compared to the control condition. The final column in Table 2 presents turnout among registered voters not included in the experiment. People in this group were not sent a postcard, so their treatment is effectively the same as the control group in the experiment. Even so, voter turnout was more than eleven percentage points higher in the control group than in the nonexperimental group. This gives an indication of how selective the experimental sample was.
Unadjusted and matching adjusted average turnout in the 2006 primary election.

To extrapolate the results, we construct matched groups using all registered voters in the voter file such that each group contains at least one unit from each treatment condition. The matching was performed in R using the generalized full matching algorithm implemented in the quickmatch package, and it was completed within two minutes on a laptop computer. We include all covariates discussed by the original authors: age measures in days, gender, and past voting history. The voting history consists of indicators of whether a person voted in the primary elections in August of 2000, 2002, and 2004, and in the general elections in November of 2000 and 2002. The exclusion of the general election in 2004 is discussed below. We also include geographical coordinates of the address of each registered voter. Mahalanobis distances are used to measure similarity.
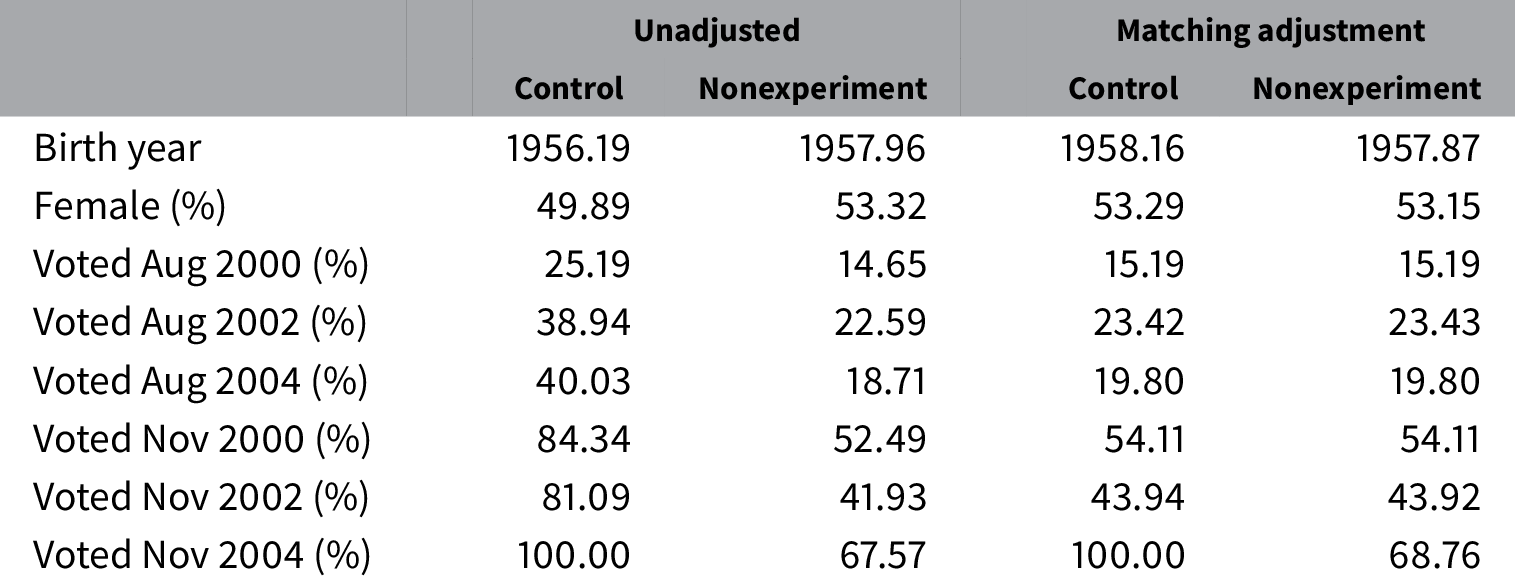
Table 3 presents averages of all variables except the geographical coordinates for the control condition and the nonexperimental group before and after matching. The supplementary material presents unadjusted and adjusted covariate averages for all treatment conditions. As expected, we see large improvements in balance after matching adjustment except for the final covariate, which is voting in the general election in 2004.
Covariate balance before and after matching adjustment.

The second row in Table 2 presents turnout for the six conditions after matching adjustment. The numbers should be interpreted as estimates of turnout for the six conditions if scaled up to the whole population; that is, the turnout when all registered voters, both those in the experiment and those not, were exposed to the corresponding treatment. We expect the estimates to be accurate representations of the counterfactual turnout if the matching was successful and the selection-on-observables assumption holds. We see that voter turnout is lower for all treatment conditions compared to the experiment, reflecting the fact that the experimental sample predominantly consisted of voters with a high baseline propensity to vote.
There is generally no way to test the selection-on-observables assumption, and the quality of an extrapolation can often only be assessed indirectly. However, we can directly test the assumption in this application because the pure control group and the nonexperimental group received the same treatment. Turnout should therefore be essentially the same for the two conditions if the matching adjustment were successful. But this is not what we observe: voter turnout is almost three percentage points higher for the control condition than for the nonexperimental condition. The failure of this placebo test is a strong indication that the extrapolation was unsuccessful.
We need to consider the voting history in the 2004 general election to understand this result. The authors’ sample selection was based on the proprietary indices discussed in the introduction, but they also required that all registered voters in the experimental sample had voted in the 2004 general election. In contrast, only
 $67.6\%$
of the registered voters not included in the experiment voted in that election. The consequence is that the support of the covariate distribution in the experiment does not overlap with covariate distribution in the population. Therefore, no adjustment exists to balance the distributions along this dimension. The only way to salvage the validity of the matching estimates presented above is to assume that voting behavior in the 2004 general election is independent of voting behavior in the 2006 primary election conditional on the remaining covariates. This assumption is unlikely to hold.
A simple solution is to change the inferential target to the set of registered voters in the overall population who did vote in the 2004 general election. Overlap is ensured with respect to this subpopulation, so extrapolation can be successful without the strong assumptions that otherwise would have been necessary. Of course, the effects in this subpopulation are likely different than the effects in the complete population, so the estimates may not provide an answer to the question of ultimate interest. The information at hand always limits what questions can be answered, and we must abide.
Table 4 presents turnout for the six conditions before and after adjustment for the subpopulation of voters in the 2004 general election. The unadjusted turnout in the nonexperimental group increases compared to Table 2. As we might expect, these voters were more likely to vote in the election in the absence of any postcard. There is, however, still a substantial difference between the control and nonexperimental groups, indicating that further adjustments are required. The second row in Table 4 presents the results after adjustment using generalized full matching. The difference between the control and nonexperimental groups is now small but still not zero, showing that the adjustment is not perfect. The remaining difference could, for example, indicate that sample selection was based on some additional information, which we do not have access to, or that the metric we use is not entirely appropriate. The placebo test can, however, be marked as a “weak pass,” and the results should provide a reasonable, but not perfect, indication of the counterfactual turnout if the treatments were scaled up to this subpopulation.
Turnout in the 2006 primary election among voters in the 2004 general election.

The adjusted averages in Table 4 suggest that the postcards would have increased turnout. The Neighbors condition leads to the highest turnout at
 $32.9\%$
. This is almost five percentage points lower than in the experimental sample, accounting for the lower baseline propensity to vote. Of particular note is that the effect of the Neighbors condition relative to control is lower than in the experiment. The effect was
 $8.1$
percentage points in the experiment but only
 $6.3$
points in this subpopulation after adjustment. A naive extrapolation using the treatment effect in the experiment would thus have been misleading. The remaining treatment conditions follow a similar pattern: voter turnout is lower after adjustment, and the effects relative to the control condition are lower than in the experiment. Of note here is also the rank switch between the Civic Duty and Hawthorne conditions, where the former had the lowest turnout among the postcard conditions in the experiment while the latter is lowest after the adjustment.
10 Concluding Remarks
Matching is an important tool for empirical researchers, but conventional matching methods are not always applicable. Algorithms with guaranteed optimality properties have limited scope and require vast computational resources. They are rarely useful when designs are complex or samples are large. Investigators have therefore been forced to use alternative approaches to construct their matches, either by simplifying the problem or by using ad hoc methods such as greedy matching.
We illustrate these issues with an extrapolation exercise of the treatment effects in a complex, large-scale experiment to an even larger population. Investigators face similar concerns when adjusting for confounded treatment assignment in large observational studies under a selection-on-observables assumption. Well-performing and computationally efficient methods for covariate adjustment are needed in these situations, and the method we describe in this paper provides a possible solution.
Generalized full matching is applicable in a wide range of settings. Like its predecessor, the method admits good match quality without discarding large parts of the sample. However, unlike conventional full matching, it is not restricted to one particular design but can accommodate any number of treatment conditions and intricate compositional constraints over those conditions. Studies with such designs have conventionally solved several matching problems and merged the resulting matchings in a postprocessing step. Aside from being tiring and error-prone, such an approach does not maintain optimality even if the underlying methods are optimal with respect to each separate matching problem. Generalized full matching allows the investigator to construct a single matching that directly corresponds to the desired design. The algorithm used to construct these matchings, as implemented in the quickmatch package, uses computational resources efficiently. This enables investigators to use the approach also in large studies where matching methods previously have been infeasible.
The appropriate compositional constraints in a matching problem depend on the application at hand. If investigators only desire point estimates of average treatment effects, it is generally sufficient to require only one unit of each treatment condition in each matched group. However, the construction of confidence intervals and hypothesis tests may require group-specific variance estimates, in which case the matched groups must contain at least two units of each treatment condition unless one borrows information between groups. Estimation of heterogeneous treatment effects often require even larger groups. While some applications require larger matched groups, investigators should not make the groups larger than necessary because this may impair the quality of the matching. By the same token, when possible, investigators should target the matching to the subpopulation of interest using the fourth extension discussed in Section 6. This gives the algorithm more flexibility to construct matched groups of high quality.
We conclude by stressing that our algorithm is a complement to existing matching methods. There are some settings where we would discourage its use. Unlike existing approaches based on network flows (see, e.g., Hansen and Klopfer Reference Hansen and Klopfer2006), the approach presented in this paper does not necessarily derive optimal solutions. For this reason, best practice is still to use existing optimal algorithms when possible. Furthermore, several refinements to the conventional full matching algorithm have been developed since its conception. For example, Hansen (Reference Hansen2004) demonstrates how to impose bounds on the ratio between the number of treated and control units within the matched groups. This limits the weight variation of the matching and allows the investigator to directly control how aggressive the adjustment may be. When used with care, such control can greatly improve one’s inferences because one can tailor the bias–variance trade-off underlying the matching problem to the application at hand. A similar effect can be achieved by adjusting the compositional constraints in a generalized full matching, but it is a blunt solution without the same level of control as in Hansen’s formulation.
Network flow algorithms can also be adapted to construct matchings with fine balance (Rosenbaum, Ross, and Silber Reference Rosenbaum, Ross and Silber2007). Here, the matched groups are constructed to ensure that the adjusted treatment groups have identical marginal distributions for a set of categorical covariates. The current implementation of our algorithm cannot accommodate such global objectives. Pimentel et al. (Reference Pimentel, Kelz, Silber and Rosenbaum2015) introduces a refinement of fine balancing in which categorical covariates can be prioritized so that they are balanced in a hierarchical fashion. This ensures fine balance on covariates deemed more important, before improving covariate balance more generally. Pimentel et al. (Reference Pimentel, Kelz, Silber and Rosenbaum2015) also show how large samples can be accommodated by thinning out the edges in the network flow problem. Building on this idea, Yu, Silber, and Rosenbaum (Reference Yu, Silber and Rosenbaum2019) discuss a preprocessing procedure that finds the smallest caliper such that the resulting matching problem still has at least one admissible solution. This allows investigators to use network flow algorithms with fine balancing constraints in moderately large studies with two treatment conditions, thereby making the preprocessing procedure by Yu et al. (Reference Yu, Silber and Rosenbaum2019) an important complement to the algorithm we describe.
Another preprocessing approach that facilitates matching in large data sets was introduced by Iacus, King, and Porro (Reference Iacus, King and Porro2012). The method coarsens the covariate space into discrete bins, which are then used to construct an exact matching. The coarsening can be performed in linear time in the sample size, so the approach is generally very fast. Its purpose is, however, somewhat different from that of generalized full matching. The approach by Iacus et al. (Reference Iacus, King and Porro2011) gives researchers fine-grained control over the worse-case covariate balance, but the control has costs. Valuable information may be lost when the covariates are coarsened, and the method is prone to discarding units because it does not ensure that all treatment conditions are represented in the bins. Full matching admits less control over the covariate balance, but it fully uses the covariate information and does not discard units from the matching unless instructed to do so.
Finally, it may be feasible to use algorithms with an exponential time complexity if the sample is sufficiently small. One such example is Zubizarreta (Reference Zubizarreta2012), who provides a general framework for directly solving the integer programming problem that underlies the matching problem. When feasible, this approach gives the investigator the greatest control over the matched groups, which allows for superior performance when applied with care. Bennett, Vielma, and Zubizarreta (Reference Bennett, Vielma and Zubizarreta2020) show that the underlying integer program can in some instances be relaxed to a more tractable linear program. When used together with template matching to construct a small reference group (Silber et al. Reference Silber2014), the approach can accommodate samples of several hundred thousand observations divided between more than two treatment conditions.
Investigators will find these alternative matching methods attractive in many situations, for good reasons. However, they cannot be used with the complex compositional conditions and large samples accommodated by the method and algorithm introduced in this paper. The task of extrapolating the results from the voter mobilization experiment in Michigan is one such case. We believe challenges of this type will become increasingly common as data sets grow in size, and we hope investigators will find the work presented in this paper useful in such situations.
Funding
This work was partially supported by the Office of Naval Research [N00014-15-1-2367, N00014-17-1-2176].
Acknowledgments
We thank Peter Aronow, Justin Grimmer, Ben Hansen, Kosuke Imai, Walter Mebane, Sam Pimentel, Liz Stuart, Cyrus Samii, Yotam Shem-Tov and José Zubizarreta for helpful comments and discussions. We thank Alan Gerber, Don Green and Christopher Larimer for sharing the data from their experiment.
Data Availability
The replication materials for this paper can be found at Sävje et al. (Reference Sävje, Higgins and Sekhon2020).
Supplementary material
For supplementary material accompanying this paper, please visit https://dx.doi.org/10.1017/pan.2020.32.