Feeding to increase weight gain has been a common approach to reduce age at first calving and thereby reduce rearing costs. However, several authors have associated a greater rate of gain in the rearing phase with impaired mammary development and lower milk production at first lactation (Sejrsen & Purup, Reference Sejrsen and Purup1997; Radcliff et al. Reference Radcliff, Vandehaar, Chapin, Pilbeam, Beede, Stanisiewski and Tucker2000). On the other hand, others have suggested that an increased weight gain does not negatively impact mammary development when diets contain an adequate balance between energy and protein (Capuco et al. Reference Capuco, Smith, Waldo and Rexroad1995; Dobos et al. Reference Dobos, Nandra, Riley, Fulkerson, Lean and Kellaway2000; Whitlock et al. Reference Whitlock, Vandehaar, Silva and Tucker2002).
These conflicting results may be explained by the complex nutrition and physiology interactions that occur during the stage of life when these experiments are conducted (Sejrsen, Reference Sejrsen1994). Although mammary gland growth in the pre-pubertal phase is quantitatively less than in other stages (i.e. gestation), evidence suggests that the alterations that takes place in the mammary gland during both pre-pubertal and post-pubertal period can have a strong influence on future milk production (Purup et al. Reference Purup, Vestergaard, Weber, Akers and Sejrsen2000).
The mass of the mammary fat pad is probably directly related to the high weight gain during the pre-pubertal period. This in turn is directly related to the amount of energy consumed by the animal. However, some authors have suggested that the main influence on the accumulation of fat in the mammary gland is not specifically energy intake, but rather the proportion between the energy and the protein consumed by the animal (Capuco et al. Reference Capuco, Smith, Waldo and Rexroad1995; Dobos et al. Reference Dobos, Nandra, Riley, Fulkerson, Lean and Kellaway2000).
Furthermore, some workers also have tested the influence of nutrition on post-pubertal heifers (Hoffman et al. 1996; MacDonald et al. Reference Macdonald, Penno, Bryant and Roche2005). According to these authors, the differences of diet energy throughout post-pubertal stage can change calving weight and consequently might influence mammary gland development and milk yield in the first lactation. Despite this fact, few studies have involved pre and post-pubertal heifers in the same experiment.
The focus of this experiment was to gain a better understanding of how feeding varying ratios of MP to ME impacts heifer growth and mammary development using both pre-pubertal and post-pubertal heifers. Moreover, we chose to evaluate mammary development by using ultrasound technology. This non invasive approach allowed us to study development over time in the same animals and avoided complications such as mammary biopsies. The use of heifers at different ages was chosen to compare diet effects both in pre- and post-pubertal phases. Overall, we hypothesised that Holstein heifers with average daily gain (ADG) of 1·0 kg/d, and fed more than 43 g of metabolisable protein (MP) per Mcal of metabolisable energy (ME) would not have their mammary gland development affected.
Material and methods
Experimental design
The experiment was conducted at the Dairy Farm of Universidade Federal de Viçosa from December 2011 to April 2012, and it was divided into four 28-d periods. All procedures were previously approved by the Committee of Ethics and Animal Welfare of Universidade Federal de Viçosa, according to protocol no. 11/2012.
Twenty-five Holstein heifers with an average body weight (BW) of 213±13·5 kg and an average initial age of 7·8±0·5 months were distributed in a randomised block design with 5 replications, with initial weight as blocking factor. The heifers were kept in individual pens with a resting area, and provided with a feed and water trough. Heifers received the same diet from weaning until the beginning of experiment, being a total mixed ration formulated with corn silage, corn, soybean meal and minerals to gain daily 700 g/d according to NRC (2001).
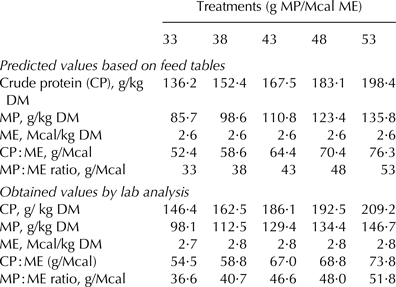
Before the start of the experiment, the heifers were allowed a 14-d adaptation period. Afterwards, they were allocated to their treatments (n=5); each treatment varied the ratio between the dietary MP and ME as follows: 33, 38, 43, 48, and 53 g of MP/Mcal ME (Table 1).
Composition and the content of the nutrients in the experimental diets

Diets were formulated with a roughage:concentrate ratio of 60:40, thereby keeping the amount of energy fixed (2·6 Mcal ME/kg DM) while varying the amount of protein per treatment. All diets were formulated to provide a gain of 1 kg/d based on the ME requirements of a heifer of 200 kg BW (NRC, 2001). The diets were supplied ad libitum daily, at 8·00 and 16·00.
The influence of treatments on the analysed variables will be based on the MP:ME ratios. However, the protein:energy ratio will also be presented as CP:ME, since this ratio is commonly used by farmers.
During the last week of each experimental period, all heifers were weighed, body measurements recorded, blood collected, and mammary gland development evaluated via ultrasound. At the same time, the roughage and left-over feed from each animal were submitted to chemical analysis. In addition, at the end of the 1st and 3rd periods, digestibility trials were performed with all heifers.
Mammary gland measurements
Mammary gland development was evaluated with the help of an ultrasound device (B-mode) equipped with a micro-convex transducer, working at a frequency of 6 MHz (DP2200, Mindray, China). Heifers at this stage of maturity have a relatively small mammary gland and so less tissue penetration is needed. Therefore, we chose to work at a 6-MHz frequency, so as to prioritise the detail of the images. In all heifers from each period, the images were taken from all fore- and rear-quarters with a standardised probe position; the probe was placed at an angle of 45° in relation to the teat base, always in the caudal-cranial direction as described by Nishimura et al. (Reference Nishimura, Yoshida, El-Khodery, Miyoshi, Furuokam, Yasuda and Miyahara2011). All procedures were performed with animals in a standing position without the use of sedatives (Fig. 1). Images from the four mammary gland quarters were taken from each animal in each period. These four values were averaged to compose the final value from each period.
Diagram representing the position of the probe during evaluation of mammary gland with ultrasound (a). Picture of a heifer where its mammary gland is being evaluated with ultrasound (b).
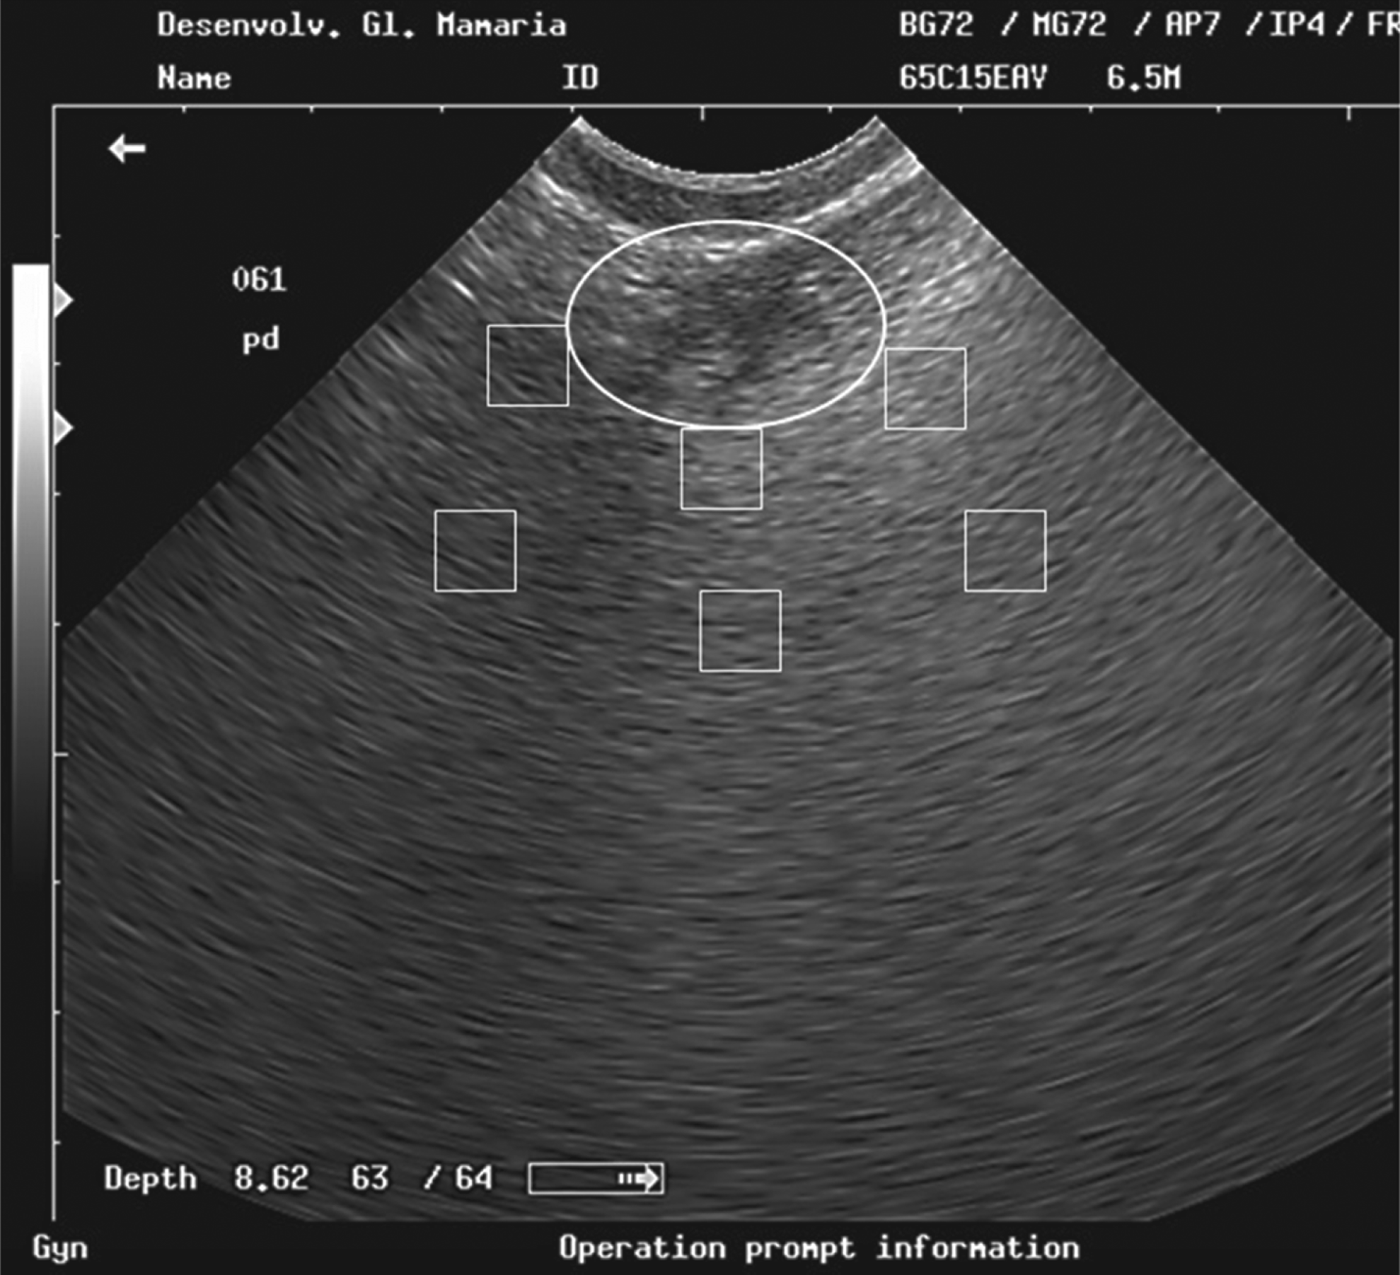
Images were saved in bitmap (BMP) format and subsequently transferred to software ImageJ® (NIH, Bethesda MD, USA). Within each image were outlined 6 random squares with 16 square mm, being 3 squares taken about 1 mm away from the ductal structures and 3 squares taken about 4 mm away from ductal structures representing the ductal and sub ductal area, respectively (Fig. 2). The black circle marks the region in which the formation and growth of the ducts are most evident.
Illustration of mammary gland ultrasound image opened up with the ImageJ software. The circle represents the buds growth. The upper squares are positioned close to the buds growth (ductal region) and the lower squares are positioned away to the buds growth (subductal region).
Within each of these defined squares, we used the pixels contained within each area to calculate the average pixel brightness. Specifically, in 8-bit images, each pixel was numerically represented on a scale of 256 thousand shades of grey (0=black; 255000=white) according to their brightness (Ferreira & Rasband, Reference Ferreira and Rasband2011).
The amplitude or brightness of the pixels (0–255000 scale) can be defined in terms of echogenicity, i.e. how much a structure retains or reflects the sound wave from the ultrasound transducer. Structures with a high ability to reflect sound waves (fat tissue) are hyperechoic and thus present with a higher pixel value. Conversely, tissues with a limited ability to reflect sound waves are hypoechoic and have a lower pixels value (parenchymal tissue).
Blood sampling
Blood samples were collected in the last week of each experimental period by jugular venipuncture, approximately 4 h after the morning feeding. The blood was collected in 10-ml tubes and immediately centrifuged at 1304 g for 15 min to obtain the blood serum. After that, three 1-ml aliquots of serum were collected and frozen separately at −20 °C. Subsequently, serum urea-nitrogen, glucose and IGF-1 values were obtained. Glucose analysis was performed according to the glucose oxidase method by using a kit supplied by Sigma (Sigma, St. Louis MO, USA) according to Sumner et al. (Reference Sumner, Valdez and Mcnamara2007). Serum urea nitrogen was analysed according to the glutamate dehydrogenase method. IGF-1 was measured by the enzyme-linked immunosorbent assay (DSL-10-2800 ACTIVE IGF-1 ELISA of Diagnostic System Laboratories Inc., Webster TX, USA) immunoassay method. The coefficient of variation for IGF-1 usually varies 3·6–8·9 and 3·4–10·9% for intra-assays and inter-assays, respectively.
Digestibility trial
Digestibility trials were conducted at the end of the first and third experimental periods. The digestibility values obtained in the first and third periods were extrapolated to the second and fourth periods, respectively. Thus, it was possible to estimate the digestible OM (DOM) intake and ME intake of each experimental period.
To estimate the amount of energy lost in faeces, a total faecal collection procedure was performed on all animals for 3 consecutive days. Animals remained loose within their pens and their faeces were collected from the floor, always avoiding any contamination with urine. At the end of each collection day, the total volume of faeces was weighed and sampled. Subsequently, the samples were dried in a ventilated oven at 55 °C and a composite sample proportional to the quantity of excreted DM was formed.
To quantify the total nitrogen contents in the urine, urea nitrogen in the urine, allantoin, uric acid, and creatinine were evaluated using the spot urine collection technique over 3 consecutive days (Valadares et al. Reference Valadares, Broderick, Valadares Filho and Clayton1999). The first collection was performed before the morning feeding (7·30), the second between the 2 feedings (12·00), and the last after the 2 feedings (18·00).
At the end of the collection period, each sample of urine was divided into 2 sub-samples: one diluted sample and the other of pure urine. To compose the former, an aliquot of 10 ml of urine was diluted into 40 ml 0·018 m-H2SO4, so as to prevent bacterial destruction of the purine derivatives and precipitation of the uric acid. In the diluted-urine sample, analyses of allantoin were performed according to the technique described by Chen & Gomes (Reference Chen and Gomes1992).
Uric acid concentration was determined according to the method described by Fujihara et al. (Reference Fujihara, Ørskov, Reeds and Kyle1987). The urea content was determined according to the enzymic colourimetric method described by Kerscher & Ziegenhorn (Reference Kerscher, Ziegenhorn and Bergmeyer1985) and creatinine was determined by the endpoint method with the help of picrate and acidifier (Lagoa Santa, Minas Gerais, Brazil, Labtest Diagnóstica S.A). Urea-N in urine was calculated by multiplying the urea by a factor of 0·4667. Daily creatinine excretion was estimated from the equation proposed by Chizzotti et al. (Reference Chizzotti, Valadares Filho, Valadares, Chizzotti and Tedeschi2008) for Holstein heifers, and the excretion of purine derivatives was calculated by summing the daily excretion of allantoin and the daily excretion of uric acid in the urine, and was expressed as mmol/d. Absorbed microbial purines (mmol/d) were calculated based on the excretion of purine derivatives (Prates et al. Reference Prates, Valadares, Valadares Filho, Detmann, Santos, Braga, Pellizzoni and Barbosa2012) and the intestinal flow of microbial N was calculated as a function of the absorbed purines using equations proposed by Prates et al. (Reference Prates, Valadares, Valadares Filho, Detmann, Santos, Braga, Pellizzoni and Barbosa2012).
Analysis of the feedstuffs
The corn silage and the left-overs from each animal were sampled during the last 7 d of each experimental period. At the end, a composite sample per animal of approximately 300 g was formed, on which all analyses were performed.
Composite samples of left-overs, faeces and roughage were pre-dried in a ventilated oven (55 °C), and were ground in a knife mill using a sieve with 1-mm screen. All feedstuffs, left-overs and faeces were subjected to analysis of DM (method 934·01; AOAC, 1990), ash (method 924·05; AOAC, 1990), crude protein (method 920·87; AOAC, 1990), neutral detergent fibre (NDF) (Ankom-220 Fiber Analyzer, ANKOM Technology, USA) and ether extract (AOCS, 2004). Calculation of ME and MP were based on equations proposed by NRC (2001).
Statistical analysis
The experiment was conducted in a randomised block design, considering the initial weight as a factor of local control. The block was used to cover both stages pre-pubertal and postpubertal, so this effect could be tested in this trial. The evaluations were performed through a mixed model, in which treatments were considered fixed effects, and blocks considered random effects. The sum of the treatment square was orthogonally decomposed into linear and quadratic effects.
The pixel values derived from the analysis of ultrasound images did not follow a normal distribution and so a logarithmic transformation of the data was performed. However, the pixel data are illustrated in untransformed format to make it easier to view the data.
The mammary gland measurements from the different periods and the measurements of nutrient intake and digestibility throughout the experiment were included in the model as repeated measures. The structures of the (co)variance matrices were evaluated by corrected Akaike's information criterion (AIC). Compound symmetry heterogeneous autoregressive 1 or non-structured symmetry structures were used for the different variables. For all analyses, we adopted P⩽0·05 as the significance level, and used PROC MIXED of SAS (Statistical Analysis System, version 9.2).
Results and discussion
Some of the CP:ME ratios established in this experiment are within the range of ratios proposed for heifers in the pre-pubertal phase (50–65 g CP:Mcal ME) by NRC (2001). However, some ratios (68·8 and 73·8) were above the values recommended by the NRC (2001). A couple of authors have suggested that the protein levels recommended by the American system fall short of the requirements of Holstein heifers weighing above 200 kg (Valadares Filho & Oliveira, Reference Valadares Filho and Oliveira2010).
The MP:ME ratios observed at the end of the experiment (36·6, 40·7, and 46·6) did not coincide exactly with the predicted values (33, 38, and 43) as they were greater than expected (Table 2). This was probably related to the analysis of crude protein in the soybean meal (48·73 vs. 50·39% DM), as our results revealed higher values than those used during the planning of the study.
Observed and predicted values for the percentage of metabolisable protein (MP) and metabolisable energy (ME) in the diet
The block analysis, utilised to measure differences between pre- and post-pubertal heifers, showed no difference (P>0·05) in any variables analysed in this trial. This highlights that MP:ME ratio on the diet had a similar effect between heifers of different stages of rearing, as suggested by others authors (Meyer et al. Reference Meyer, Capuco, Ross, Lintault and Van Amburgh2006).
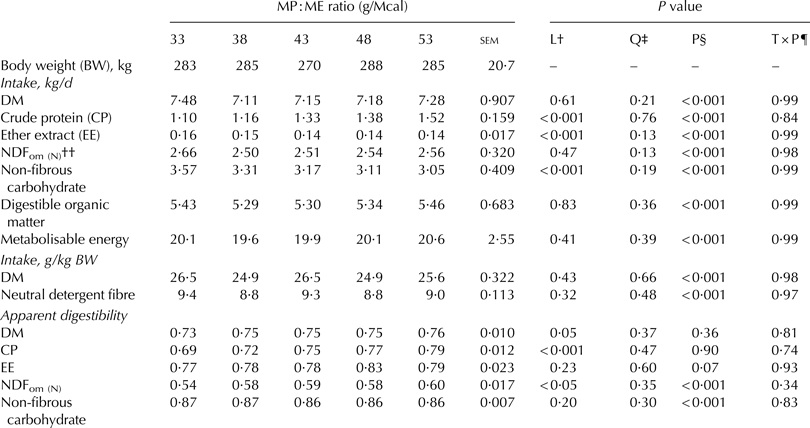
There was no difference in the intakes of DM, NDF, ME or DOM (P>0·05) (Table 3). Intake is regulated by both physical and chemotactic factors; while the latter have greater influence when the diets have a low filling capacity, the first is more related with diets with higher power to fill rumen (Fisher, Reference Fisher2002). The diets were formulated so as to contain the same amount of energy (2·6 Mcal ME/kg DM), to provide an ADG close to 1 kg/d, and they demonstrated an average of 73% DM digestibility. Therefore, it is suggested that intake was controlled according the level of energy in the diet, which in turn was similar.
Average body weight, daily intake, and apparent total tract digestibility
† Linear effect
‡ Quadratic effect
§ Period effect
¶ Interaction between treatment and period
†† NDFom (N)=Nitrogen detergent fibre based on organic matter and nitrogen free
MP:ME ratios affected (P<0·05) CP and non-fibrous carbohydrate (NFC) intakes (Table 3). These variables demonstrated an inverse linear behaviour, i.e. while the CP intake increased with the treatments, NFC intake decreased. This behaviour was brought about by an alteration in the proportion of the ingredients of the diet, where corn was replaced by soybean meal.
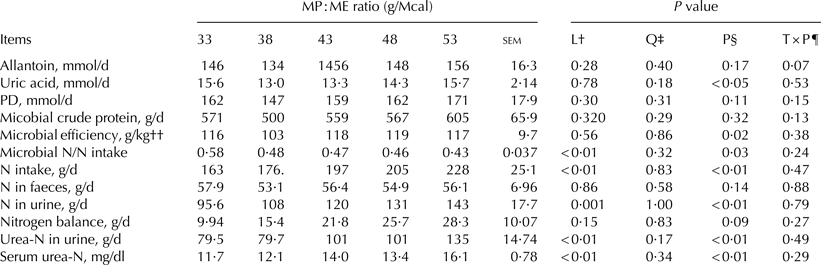
Results for the daily excretion of allantoin, uric acid, purine derivatives, nitrogen balance, microbial CP, microbial efficiency and N in faeces were not affected by the treatment (P>0·05). However, the excretion of urea-N in urine, total N in urine, N intake, the ratio between the microbial N and N intake, and serum urea-N increased linearly (P<0·05) as MP:ME ratios increased (Table 4).
Average excretion of allantoin, uric acid, purine derivatives (PD), urinary urea nitrogen, nitrogen balance, microbial crude protein (CP), microbial efficiency, and serum urea nitrogen on the treatments
† Linear effect
‡ Quadratic effect
§ Period effect
¶ Interaction between treatment and period
†† g Microbial crude protein/kg digestible organic matter intake
Intestinal flow of microbial N, presented herein as MCP, was influenced by the ratio between the energy and N available in the rumen. CP intake had no influence on MCP, because the linear increase (P<0·05) in CP intake did not affect (P>0·05) production of MCP. Thus, it is suggested that MCP was regulated by a factor other than CP intake such as the energy availability in the rumen, which is related to DOM intake, which was not different between treatments in this trial (P=0·830).
Synchronism between the energy and protein in the rumen was maximised in the treatment with the lower MP:ME ratios; after this level, the energy would limit the MCP synthesis. Some authors also suggest that the MCP synthesis is maximised when there is adequate synchronism between the protein and energy in the rumen (Aldrich et al. Reference Aldrich, Muller, Varga and Griel1993; Dewhurst et al. Reference Dewhurst, Davies and Merry2000).
There was no difference (P>0·05) regarding the nitrogen balance and microbial efficiency (Table 3). The absence of effects on nitrogen balance is reinforced by the intake (Table 3) and performance data, which also did not show a significant difference (P>0·05).
Overall, MP:ME ratios did not affect (P>0·05) the quantity of N retained in the body of the animal, but increased (P<0·05) the amount of N lost in the urine. This phenomenon would certainly be undesirable in current livestock systems, where farmers aim to increase performance at a low cost and with the lowest environmental impact. However, this conclusion is exclusively limited to this context, because the goals established in this study involve other aspects which will be addressed next.
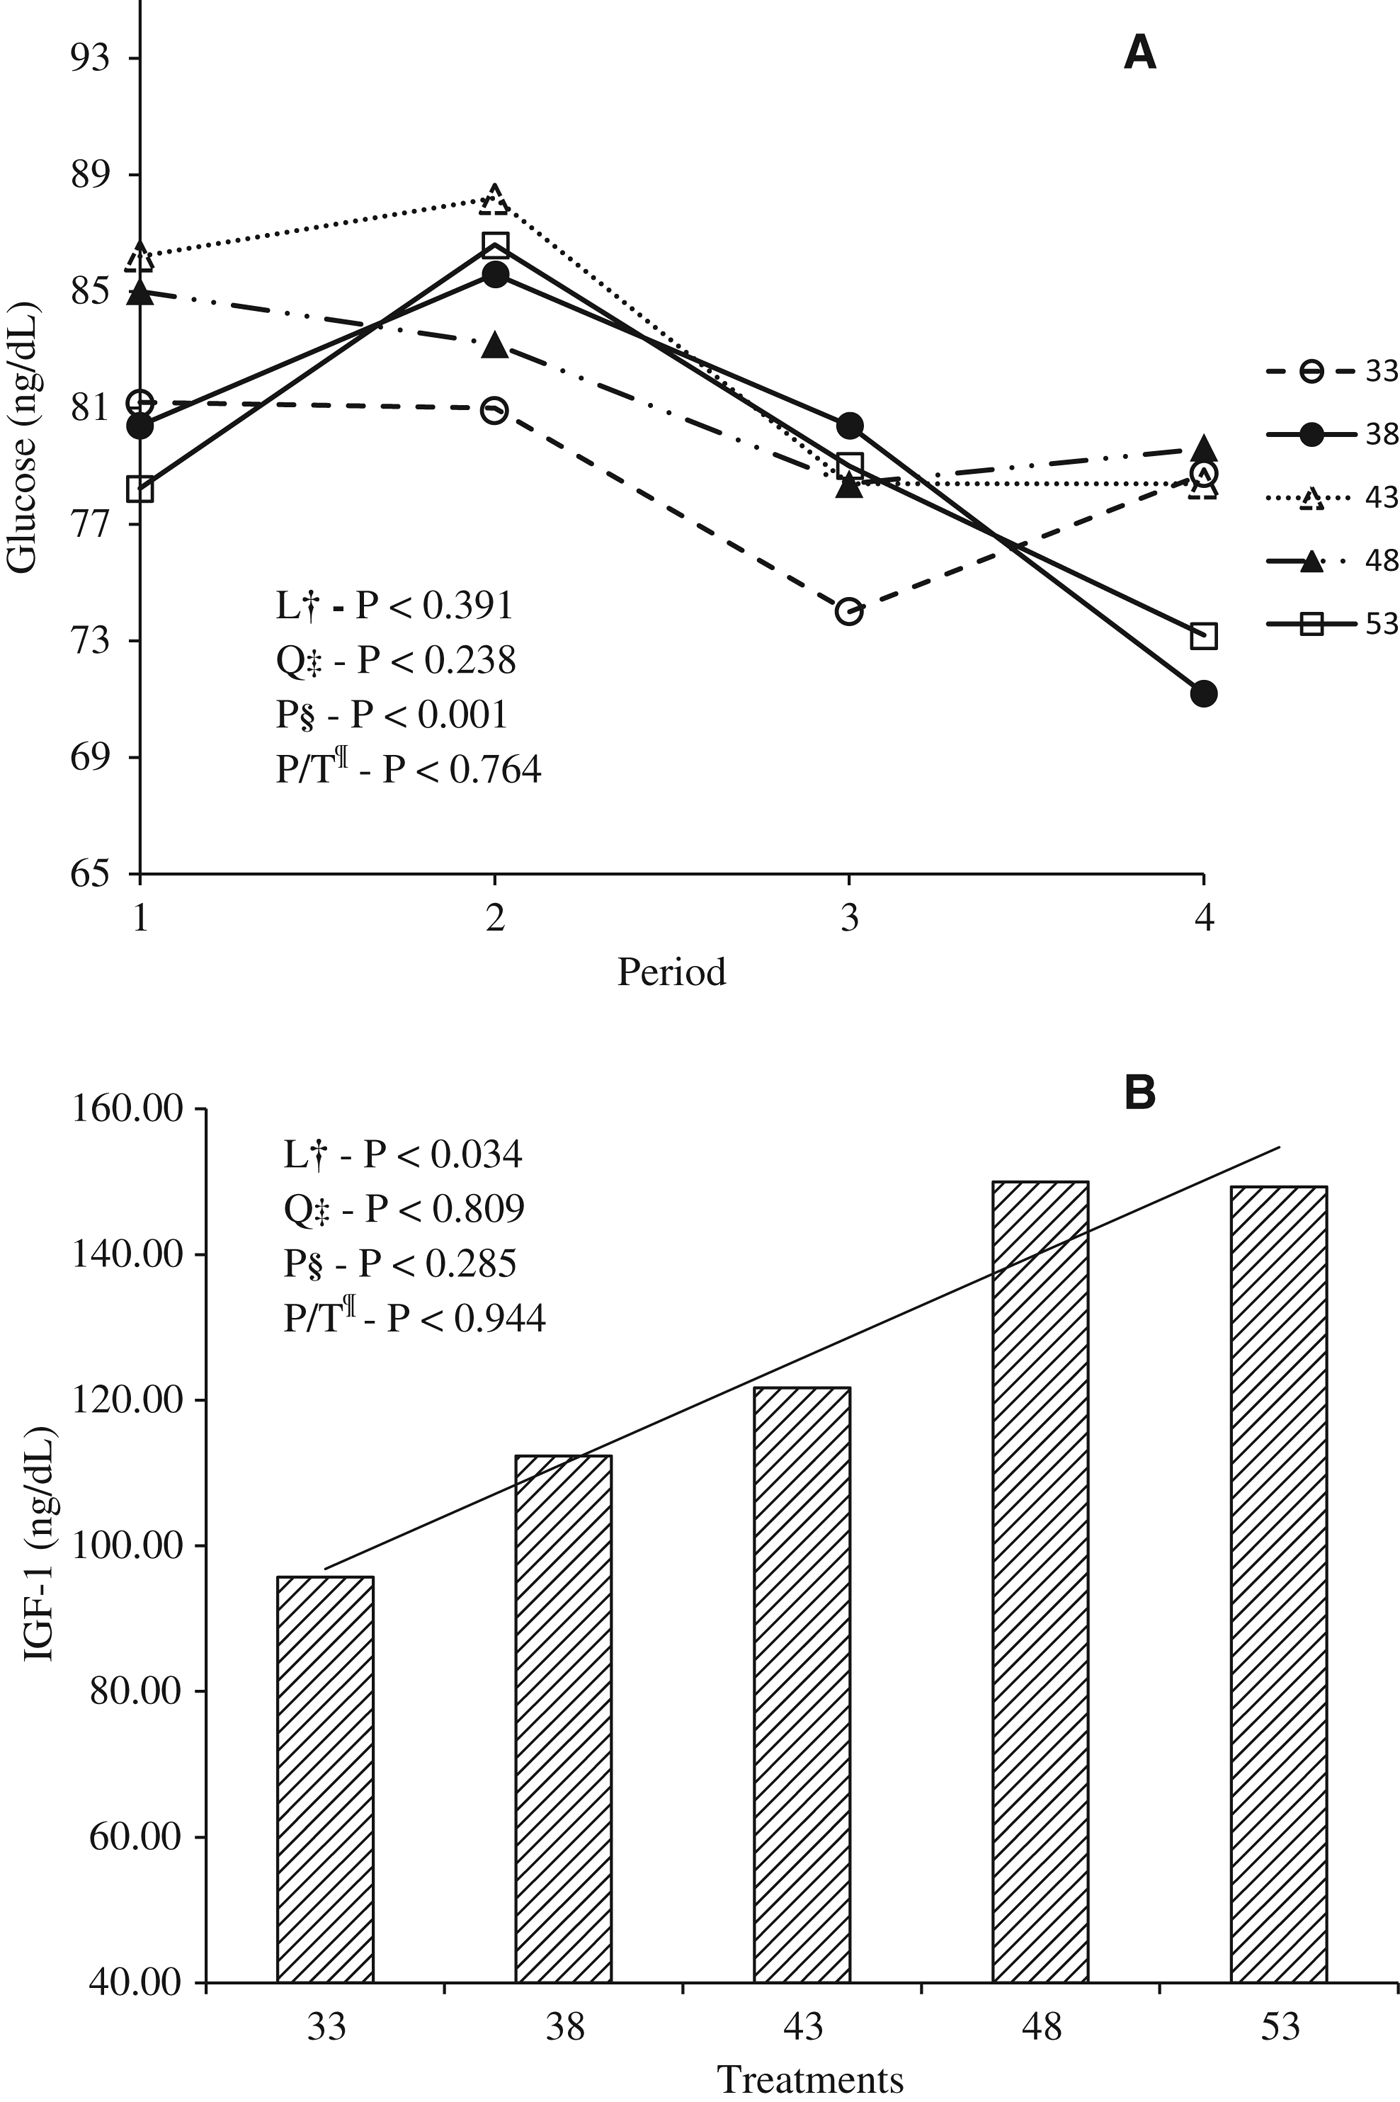
The pattern of blood glucose concentration showed no differences (P>0·05) among the treatments. The mean value (80·2±1·90 mg/dl) obtained in this experiment is similar to the 75 and 75·5 mg/dl found by Lalman et al. (Reference Lalman, Petersen, Ansotegui, Tess, Clarck and Wiley1993) and Sumner et al. (Reference Sumner, Valdez and Mcnamara2007), respectively.
On the other hand, the treatments had a linear effect (P<0·05) on the serum concentration of IGF-1 (Fig. 3a, b).
Variation of the glucose on each treatment over the periods (a). Level of IGF-1 according with treatments (b). †Linear effects. ‡Quadratic effects. §Period effect. ¶Interaction between treatment and period.
These results are similar to those obtained by Radcliff et al. (Reference Radcliff, Vandehaar, Kobayashi, Sharma, Tucker and Lucy2004), who observed an increase in the concentration of IGF-1 in the serum of heifers fed with high protein and energy diets, and in heifers treated with bovine somatotropin. IGF-1 is a mitogenic hormone, i.e. it acts by stimulating cellular proliferation (Akers, Reference Akers1990; Plath-Gabler et al. Reference Plath-Gabler, Gabler, Sinowatz, Berisha and Schams2001). According to Berry et al. (Reference Berry, Mcfadden, Pearson and Akers2001), there is significant production of IGF-1 in the mammary gland of growing heifers. Purup et al. (Reference Purup, Vestergaard, Weber, Akers and Sejrsen2000) found a strong relationship (R 2=0·84) between the concentration of IGF-1 in the serum and IGF-1 in the mammary gland.
Thus, the analyses of IGF-1 obtained through the blood serum allow us to estimate the relative expected concentrations of IGF-1 in the mammary tissue. Consequently, heifers with the highest concentration of IGF-1 in the serum have high tissue concentration of IGF-I and may be more prone to mitogenic effects of IGF-1 on the mammary gland (Purup et al. Reference Purup, Vestergaard, Weber, Akers and Sejrsen2000).
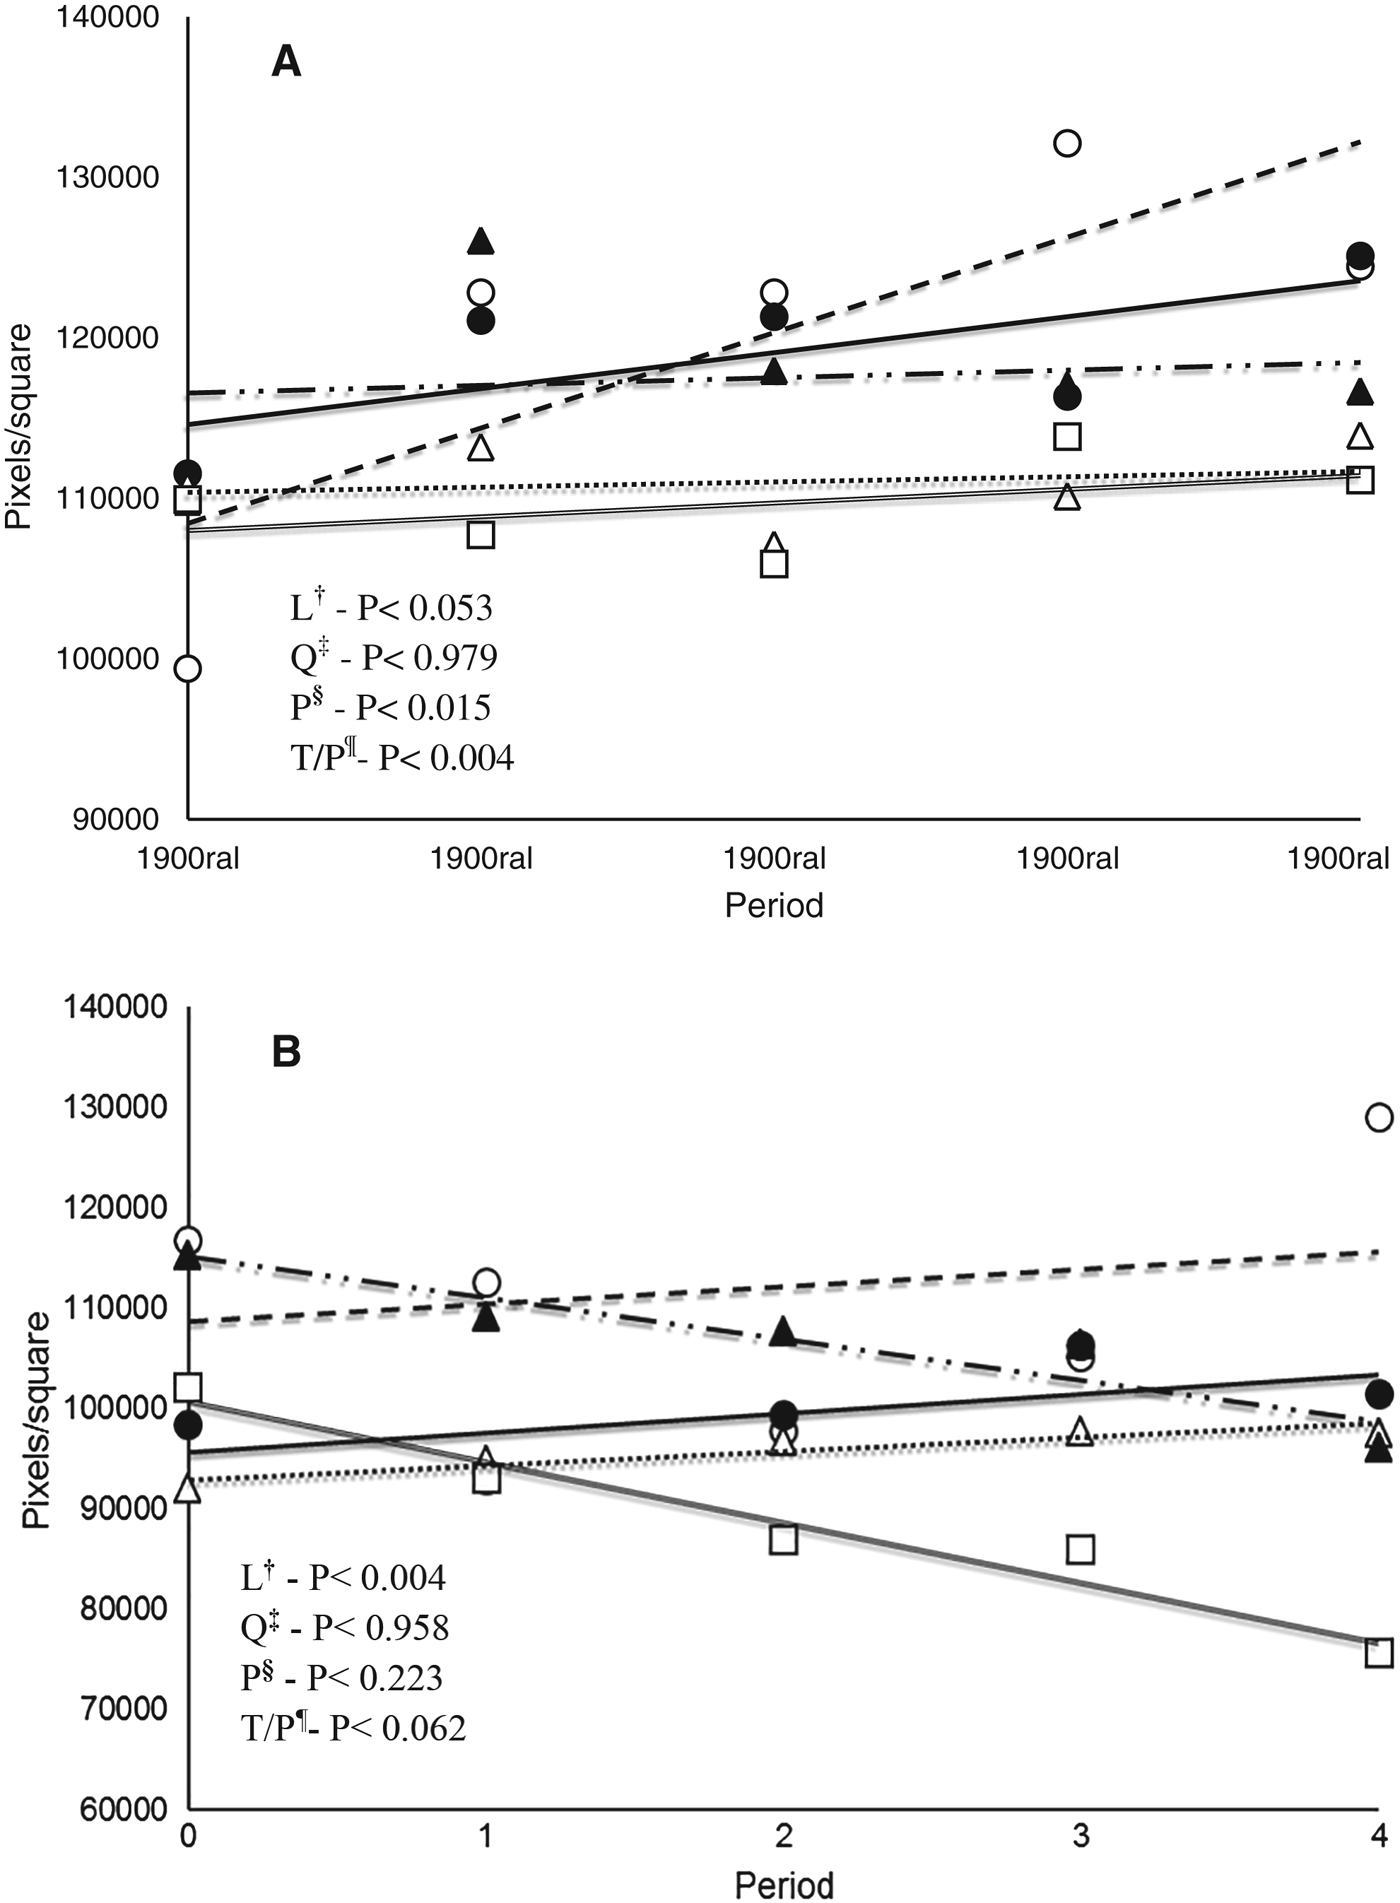
Treatments 33 and 38 increased linearly (P<0·05) the pixel brightness of the ultrasound images at the mammary gland on the ductal region (Fig. 4a). On the other hand, no effect was observed to other treatments under pixels brightness on the ductal region (Fig. 4a). The increased pixel values over the periods indicate that mammary gland of heifers under treatments 33 and 38 became more reflective of ultrasound waves. Therefore, the two lowest treatments may contribute to fat accumulation in the mammary gland of heifers reared under high performance.
Pattern of pixel values in the region ductal (a) and region subductal (b) over the evaluation period. The symbols represent: 33 (○. ---). 38 (○.—). 43 (△.···). 48 (▴.—··—). and 53 g of MP/Mcal of ME (□.=). †Linear effects. ‡Quadratic effects. §Period effect. ¶Interaction between treatment and period.
The mammary gland is basically formed of parenchymal and stromal tissue. The secretory and ductular tissues in the mammary gland are epithelial tissues collectively referred to as parenchyma. The connective tissues that support the parenchyma are referred to as stroma, which contains cellular and noncellular (e.g. collagen, elastin) elements. Cells of stroma are primary fibroblasts and, depending upon stage of development, may contain a considerable number of adipocytes. During mammary gland development, the epithelial ducts grow into the surrounding stroma, which, from birth until late in first pregnancy, contains many adipocytes and is referred to as the mammary fat pad (Capuco & Akers, 2010). Thus, as the mammary gland becomes fatter over the rearing period, the more the secretory tissue will penetrate the fat pad, diminishing the mammary gland development (Hovey et al. Reference Hovey, McFadden and Akers1999).
The fat pad tissue is constituted by a matrix of connective and adipose tissue. When the fat tissue exhibits an exaggerated growth, such as when there is an imbalance between dietary protein and energy, this may create conditions that limit the future development of milk-secreting tissues (Hovey et al. Reference Hovey, McFadden and Akers1999). According to VandeHaar (Reference VandeHaar1997) and Whitlock et al. (Reference Whitlock, Vandehaar, Silva and Tucker2002), changes in the ratio of protein and energy would be responsible for large differences in tissue deposition in the gland.
In treatments 33, 38 and 43 the pixels brightness did not show any significant change (P>0·05; Fig. 4b); therefore this region was not affected by diets at this time. Conversely, the pixels brightness in the treatments 48 and 53 decreased linearly over time (P<0·05).
The subductal region represents the fat pad region in the mammary gland. Mammary development occurs through growth of secretory tissue towards the fat pad. Thus, the reduction in pixels brightness may indicate that there was bigger growth of secretory tissue inside the fat pad of these treatments. We suggest that pixels reduction have been caused by an increase on secretory tissue (e. g. parenchymal tissue) because it has a lower power to reflect the sound waves, in turn it will produce lower pixels values. This result is linked to IGF-1 data (Fig. 3b), which increased (P<0·05) linearly between treatments, also reinforcing that there was a greater stimulus to growth of protein tissue (parenchymal tissue) over fat tissue in the fat pad region. Mechanisms related to the increase of parenchymal tissue as well as their differentiation will lead to an increase in milk production (Akers, Reference Akers2000). So, in this trial, we found that protein: energy ratio unsuitable for heifers reared under high performance can be detrimental to mammary development.
Conclusions
The use of diets that contain MP:ME ratios less than 38 g/Mcal might induce excess of fat accumulation in the parenchymal area of mammary gland, and therefore are not recommended when heifers are reared under high daily gains.
Refinements in ultrasound technology might allow a better estimation of the adipocyte concentration of the developing mammary gland relative to other stromal tissue elements. Certainly, significant changes in pixel values across periods suggest that ultrasound measurements can provide good measurements of tissue dynamics, especially within the developing mammary fat pad, independent of whether the heifers are pre- or postpubertal.