I. INTRODUCTION
Al–Si alloys are of considerable interest due to their useful properties, including low density, good castability, wear and corrosion resistance, weldability, machinability etc. Reference Davis1–Reference Zhou, Duszczyk and Korevaar3 Because of these properties, Al–Si alloys find their application as engineering components in automotive and aerospace industries. Reference Grosselle, Timelli and Bonollo4,Reference Kasprzak, Amirkhiz and Niewczas5 The service life of an engineering component depends on several factors, such as environmental conditions, service temperature etc. Reference Middleton, Timmins and Townsend6,Reference Krätschmer, Roos, Schuler and Herter7 The tribological and corrosion properties have influential effects on the durability of the components, especially in automotive applications like pistons, cylinder heads etc. Reference Ejiofor and Reddy8,Reference Chen, Meng-Burany, Perry and Alpas9 It has been reported by several authors that the wear resistance of the components are directly related to the hardness of the material Reference Khruschov10–Reference Moore12 and that the wear resistance of materials, such as Al–Si alloys, can be enhanced by several methods, including grain refinement, surface coatings, alloying addition etc. Reference Jeong, Gonzalez, Palumbo, Aust and Erb13,Reference Makarov, Pozdejeva, Savrai, Yurovskikh and Malygina14 The presence of hard Si particles in the Al–Si alloys leads to superior wear resistance and their amount, size, morphology, and distribution have a remarkable impact on the tribological properties. Reference Clarke and Sarkar15–Reference Lashgari, Zangeneh, Shahmir, Saghafi and Emamy19
Refinement of the microstructure can be carried out by several ways, such as through the addition of grain refiners or by rapid quenching of the melt. Reference Jia and Fischer20,Reference Jin, Park and Kim21 Among the advanced processing routes, selective laser melting (SLM) not only offers the possibility to produce parts with extremely complex and intricate geometries, but also induces cooling rates as high as 1 × 10⁵ K/s, which permit the production of bulk materials with very fine microstructures or even bulk metallic glasses. Reference Davis1,Reference Bourell, Wohlert, Harlan, Das and Beaman22–Reference Ma, Prashanth, Scudino, Lia, Wang, Zou, Wei and Eckert26 For example, Al–12Si samples produced by SLM display an extremely fine microstructure and remarkable mechanical properties, including yield strength four times higher than the corresponding conventionally cast material Reference Prashanth, Scudino, Klauss, Surreddi, Löber, Wang, Chaubey, Kühn and Eckert25 with good weldability. Reference Prashanth, Damodaram, Scudino, Wang, Prasad Rao and Eckert27
Some applications of Al-based alloys involve their exposure to acidic environments. Reference Musa, Mohamad, Khadum and Chee28 Hence, the knowledge on the corrosion resistance of Al-based alloys in acidic conditions becomes a prerequisite. Previous studies showed that Al-based alloys are passive in halide-free aqueous electrolytes with pH values between 4.0 and 8.5. Reference Song and Liu29,Reference Holroyd, Scamans, Newman and Vasudevan30 In this pH range, the Al-based alloys generally form a passive stable Al2O3 layer. The oxide film is self-healing and any mechanical abrasion or damage of the surface film does not lead to the corrosion of the underlying alloy. Reference Kending, Jeaniaquet, Addison and Waldrop31 However, aluminum suffers from severe corrosion in nitric acid environments. The corrosion rate of Al in HNO3 is in the order of 4.0 mm/y in the concentration range of 20–40% HNO3 (0.01–1 M HNO3) at room temperature. Reference Musa, Mohamad, Khadum and Chee28
The present manuscript focuses on the tribological and corrosion properties of the Al–12Si samples produced by SLM. Sliding wear, fretting wear, and corrosion tests were carried out on as-prepared and annealed Al–12Si SLM samples and the results are compared with the same material produced by casting. The sliding wear rates are also compared with the data available in the literature to evaluate the wear resistance of the SLM samples. The influences of the microstructure in terms of Si size and distribution on the wear and corrosion properties are discussed in detail.
II. EXPERIMENTAL
Cylindrical rods of 10 mm diameter and 15 mm length for wear experiments and square plates of 3 mm length, 3 mm width, and 2 mm thickness for corrosion experiments with nominal composition of Al–12Si (wt.%) have been produced by SLM (for details about SLM processing see Ref. Reference Prashanth, Scudino, Klauss, Surreddi, Löber, Wang, Chaubey, Kühn and Eckert25). Heat-treatment of the SLM samples was carried out at 473, 573, 623, 673, and 723 K for 6 h under argon atmosphere. For comparison purposes, cylindrical Al–12Si rods and bars were also prepared by graphite mold casting.
Sliding wear tests were carried out according to the ASTM G 99-05 standard at room temperature and in ambient atmospheric conditions using a pin-on-disc test device. A disc of 45 mm diameter and 13 mm thickness made of hard-faced stainless steel is used against the Al–12Si flat head pins of 9 mm diameter and 12 mm height. The tests were performed at constant load (10 N) with a sliding speed of 1 m/s for 30 min. The wear rate was evaluated by Reference Prashanth, Kumar, Scudino, Murty and Eckert32
 $${Q_{\rm{s}}} = {{{V_{\rm{s}}}} \over {{L_{\rm{s}}}}}\quad ,$$
where Q s is the wear rate, L s the sliding distance, V s the sliding volume loss, and the subscript ‘s’ indicates sliding. The volume loss (V s) can be expressed by the Archard equation as Reference Archard33
 $${V_{\rm{s}}} = {{kW{L_{\rm{s}}}} \over H}\quad ,$$
where k is the wear coefficient, W the applied load, and H the hardness of the material. The volume loss was calculated from the wear loss determined by measuring the weight of the flat head pins before and after the tests. The sliding distance is given by L s = 2πr s v s t s, where r s is the radius of the wear track (22.5 mm), v s is the speed expressed in rounds per minutes (450 rpm), and t s is the time (30 min).
Fretting wear tests were carried out according to the ASTM-D5706-97 and ASTM-D5707-97 standards using an OPTIMOL SRV device (Munich, Bavaria, Germany). In these tests, a steel ball (G-Cr 15) with 10 mm diameter is impended against a disk type fretting wear test rig (made of the Al–12Si samples) with a point contact mode. A preload of 5 N is firstly applied for 30 s and then the tests are carried out using a load of 10 N for 30 min with a frequency of 50 Hz and half-amplitude of 100 μm. The fretting wear volume was evaluated by Reference Elleuch and Fouvry34
 $${V_{\rm{f}}} = {h^2}(3{R_{\rm{f}}} - h)/3\quad ,$$
where V f is the volume loss, h is the depth of the fretting scar, and the subscript ‘f’ indicates fretting. R f is equal to (T 2 + h 2)/2h and T = (d 1 × d 2)−0.5/2, where d 1 and d 2 are the principal diameters of the wear surface that take into account any deviation from perfect circular shape of the fretting scar.
For the immersion corrosion experiments, the square shaped plates were polished using SiC paper from 400 down to 4000 grit and subsequently polished using 3 μm and 0.25 μm diamond suspensions. The samples were cleaned with ethanol and the initial weight as well as the dimensions of the samples was measured. The samples were then immersed in 0.01 M, 0.1 M, and 1 M HNO3 solutions. The samples were removed from the acidic solution every 24 h, subsequently rinsed with distilled water, dried in hot air and then weighed, and re-immersed in the acidic solution again for additional 24 h. The corrosion products were not removed intentionally at any of the intermediate stages. They were removed only after the last measurement for microscopic investigations. A Mettler Toledo AX205 analytical balance (Gießen, Hesse, Germany) with the smallest increment of 0.01 mg was used for all the weight measurements. Three independent trials were conducted under similar conditions.
The wear surfaces of the samples after sliding and fretting wear tests as well as the surface of the samples after immersion corrosion tests were characterized by optical microscopy (OM) using a VHX-2000 digital microscope (Neu-isenburg, Hesse, Germany) and by scanning electron microscopy (SEM) using a Gemini 1530 microscope (Göttingen, Lower Saxony, Germany) equipped with an energy-dispersive x-ray spectroscopy (EDX) setup. The Vickers hardness of the specimens was measured by means of a computer-controlled Struers Duramin 5 testing machine (Willich, North Rhine-Westphalia, Germany) using an applied load of 0.1 N for 10 s.
III. RESULTS
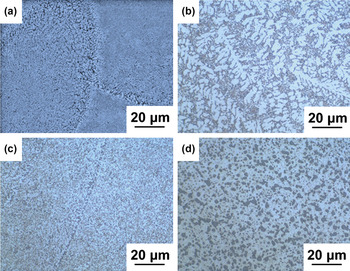
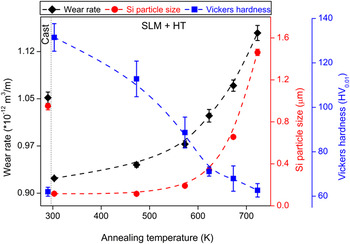
The detailed characterization of the Al–12Si samples produced by SLM has been reported elsewhere. Reference Prashanth, Scudino, Klauss, Surreddi, Löber, Wang, Chaubey, Kühn and Eckert25 Therefore, only the key microstructural features are given here. The microstructure of the SLM Al–12Si material consists of an extremely fine Al-rich cellular structure along with residual ultrafine-grained Si at the cellular boundaries [Fig. 1(a)]. This is in contrast to the corresponding cast material [Fig. 1(b)], which displays the typical hypoeutectic Al–Si structure consisting of primary α-Al and Al–Si eutectic. The microstructure of the SLM samples is significantly changed by annealing [Figs. 1(c) and 1(d)]. More specifically, the average size of the Si particles increases exponentially (full red circles in Fig. 2) and their number decreases with increasing annealing temperature. Reference Prashanth, Scudino, Klauss, Surreddi, Löber, Wang, Chaubey, Kühn and Eckert25 This corresponds to an increase of the Si weight fraction from 1 wt.% for the as-prepared SLM material to 8 wt.% for the SLM sample heat treated at 723 K. Reference Prashanth, Scudino, Klauss, Surreddi, Löber, Wang, Chaubey, Kühn and Eckert25 Finally, the SLM sample annealed at 723 K exhibits a composite-like microstructure consisting of micrometer-sized Si particles dispersed in the Al matrix [Fig. 1(d)].
OM micrographs of the Al–12Si samples: (a) as-prepared SLM, (b) cast and SLM annealed for 6 h at (c) 573 and (d) 723 K.

Sliding wear rate (υ), average size of the Si particles (λ) and the Vickers hardness (ν) for the Al–12Si cast, as-prepared SLM (300 K) and SLM samples annealed at different temperatures.

Under such conditions of varying size, shape, and density of the Si particles, examining the wear and corrosion properties of the as-prepared and annealed Al–12Si SLM samples is of primary interest because the hard Si particles play a significant role in dictating the wear properties and their distribution affects the corrosion properties of the Al–Si alloys.
A. Sliding wear
The wear rate, Vickers hardness, and size of the Si particles of the Al–12Si samples prepared by SLM are shown in Fig. 2 as a function of the annealing temperature along with the corresponding values of the as-cast Al–12Si material. The wear rate is at the minimum for the as-prepared SLM sample (300 K) and then it increases with increasing annealing temperature, following an exponential form very similar to the behavior shown by the size of the Si particles in the same temperature range.
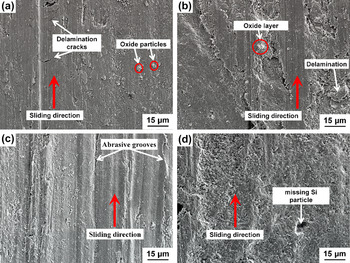
Figure 3 presents the wear tracks observed by SEM for the cast and as-prepared SLM materials and for the SLM samples annealed at 573 and 723 K after the sliding wear tests. The red arrows in the SEM images mark the sliding direction. The cast sample shows a very irregular surface morphology [Fig. 3(a)]. During the sliding wear test, the pin induces a large strain level in the soft Al matrix at the contact surfaces. Due to such a strain, surface and subsurface cracks are formed. Reference Raghukiran and Kumar35,Reference Suh36 Such cracks lead to the delamination of the surface, as observed in Fig. 3(a), and hence to significant material removal. In addition, aluminum oxide particles were also observed by EDX composition analysis (not shown here) along with plastic deformation due to the traction of the pin surface on the hard steel counter disc. Reference Raghukiran and Kumar35 The sliding of the pin against the disc promotes a strong temperature rise at the surface of the pin, leading to the preferential oxidation of the surface. Reference Raghukiran and Kumar35–Reference Liu, Asthana and Rohatgi38 The abrasion of the pin surface is marked by the presence of plowing grooves, as observed in Fig. 3(a). These findings indicate that the wear of the Al–12Si cast sample is mainly due to the following three mechanisms: abrasive component, delamination, and oxidative wear. Reference Liu, Asthana and Rohatgi38,Reference Subramanian39
SEM images of the wear tracks after the sliding wear tests for the Al–12Si samples: (a) cast, (b) as-prepared SLM and SLM annealed at (c) 573 and (d) 723 K.

The wear tracks of the as-prepared SLM sample are shown in Fig. 3(b). The wear tracks are shallow compared to the wear tracks of the cast sample [Fig. 3(a)], indicating that reduced wear occurs in this sample. The wear surface also shows the presence of oxide particles and delamination cracks but no significant delamination of the layers is observed. This is because the delamination cracks cannot transform to a delamination layer due to the higher hardness of the as-prepared SLM sample compared to the cast counterpart.
Selective oxidation of Al is also observed along the worn surface of the as-prepared SLM sample [Fig. 3(b)]. The presence of oxygen along the wear tracks suggests that the oxidative wear mechanism is prevailing in this sample. As the oxides are generally harder than the matrix, they may improve the wear resistance of Al alloys. Reference Dwivedi37 However, both the cast and as-prepared SLM samples show the presence of oxidation; therefore, the individual contribution of the oxides on the wear performance can be neglected in the present context. Consequently, the major wear mechanisms operating in the as-prepared SLM sample are abrasive component and oxidation wear. Reference Liu, Asthana and Rohatgi38–Reference Zhang and Alpas40
The wear tracks of SLM sample annealed at 573 K [Fig. 3(c)] show deep abrasive grooves due to plowing caused by the hard steel counter disc. Such wear morphology is very different compared to the as-prepared SLM material [compare Figs. 3(b) and 3(c)], suggesting different wear mechanisms operating in these two samples. Unlike the cast specimen, the SLM sample annealed at 573 K shows more pronounced abrasive grooves and plastic deformation. However, in contrast to the as-prepared SLM material, no distinct delamination cracks are observed, owing to the decreased hardness and increased ductility of the heat-treated sample. Reference Prashanth, Scudino, Klauss, Surreddi, Löber, Wang, Chaubey, Kühn and Eckert25 With further increase in the annealing temperature to 723 K, the specimens show more plastic deformation [Fig. 3(d)], corroborating the wear rate data in Fig. 2. In addition, removal of Si particles from the matrix has also been observed during sliding wear [Fig. 3(d)].
B. Fretting wear
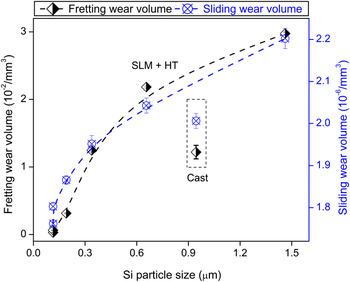
The fretting wear results for Al–12Si samples as a function of the size of the Si particles are presented in Fig. 4. The amount of material removed (wear volume) is least for the as-prepared SLM sample. The fretting wear volume increases by increasing the Si particle size (and consequently by increasing the annealing temperature; compare Figs. 2 and 4). This behavior is remarkably similar to the trend observed for the corresponding sliding wear volume (also shown in Fig. 4). In contrasts, both the fretting and sliding wear volumes for the cast material do not follow the tendency shown by the SLM samples.
Fretting (υ) and sliding (λ) wear volumes for the cast and SLM Al–12Si specimens as a function of the average Si particle size.

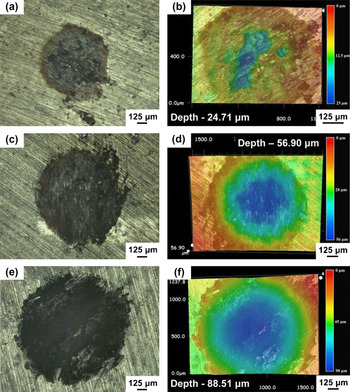
Figure 5 shows the OM images of the Al–12Si samples after fretting tests along with the corresponding depth profiles. As a result of the rubbing of the steel ball, all samples display approximately circular wear scars with depth increasing from the edges to the center. This is due to the degree of volume loss being high at the center and gradually decreases to zero toward the edges, which is characteristic for the fretting wear tests. Reference Zhu and Zhou41–Reference Goto and Uchijo43 The average diameter and the depth of the wear scar for the as-prepared SLM sample are 770 ± 50 µm and 25 ± 1 µm, respectively [Figs. 5(a) and 5(b)]. Delamination of the surface along with abrasive wear acts as material removal mechanism for this material.
OM images of the fretting wear scars and corresponding depth profiles for the Al–12Si samples: (a, b) as-prepared SLM, (c, d) cast, and (e, f) SLM annealed at 723 K.

The wear scar of the cast sample [Fig. 5(c)] shows traces of plastic deformation and delamination especially at the center of the damaged area. The diameter and the depth of the wear scar for the cast sample are 1220 ± 50 µm and 57 ± 2 µm [Figs. 5(c) and 5(d)]; therefore larger than the wear scar observed for the as-prepared SLM material. This indicates that more material is removed in the cast material, confirming the results shown in Fig. 4. Different regions in the wear scar show different wear mechanisms: adhesive wear predominantly occurs at the center of the wear scar Reference Zhu and Zhou41,Reference Goto and Uchijo43 along with traces of severe plastic deformation, Reference Goto and Uchijo43–Reference Timmermans and Froyen45 whereas along the sliding edges the main wear mechanism is found to be abrasive wear with some delamination cracks. This is in agreement with the mechanism proposed by Elleuch et al., Reference Blanchard, Colombie, Pellerin, Fayeulle and Vincent42 where material loss and the elimination of the wear surface during the fretting wear process is aided by the increased adhesion between the plastically deformed material and the steel ball. The increased adhesive tendency leads to mass transfer from the wear surface due to both adhesive wear and delamination.
The wear scar of the SLM sample annealed at 723 K [Figs. 5(e) and 5(f)] shows deeper depth of penetration (89 ± 2 µm) as well as increased diameter of the wear scar (1550 ± 30 µm) compared to the cast and as-prepared SLM samples, indicating reduced wear resistance. The wear mechanism observed in the annealed sample is similar to the one operating in the cast material: plastic deformation and adhesive wear along the center and abrasive wear and delamination along the edges of the wear scar. Reference Goto and Uchijo43–Reference Timmermans and Froyen45
C. Weight-loss tests
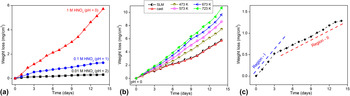
The weight-loss curves for the as-prepared SLM specimens as a function of the HNO3 concentration are shown in Fig. 6(a). The samples show a weight-loss of 0.31 ± 0.04 mg/cm2, 1.29 ± 0.11 mg/cm2, and 5.72 ± 0.15 mg/cm2 for 0.01, 0.1, and 1 M HNO3, respectively, after 14 days of immersion [Fig. 6(a)]. These results indicate that the weight-loss of the as-prepared SLM specimens increases by about four times for every one order of magnitude increase in the nitric acid concentration. The weight-loss curves of the as-prepared SLM samples are nonlinear for all the tested concentrations: the corrosion rates are initially (within 3 days) high and then they decrease with increasing immersion time. While for the more dilute electrolytes, i.e., 0.01 and 0.1 M HNO3, the corrosion rate remains more or less constant after 3 days, in the 1 M HNO3 electrolyte the corrosion rate increases again after approximately 10 days.
(a) Weight-loss curves for the as-prepared SLM samples as a function of the immersion time for three different HNO3 concentrations (0.01, 0.1, and 1 M). (b) Weight-loss plots for the as-prepared SLM, cast, and SLM heat-treated samples as a function of time for the 1 M HNO3 solution. (c) Weight-loss curve for the as-prepared Al–12Si SLM samples for 0.1 M HNO3, showing the different rates of corrosion as a function of the immersion time.

To evaluate the weight-loss, the samples were periodically removed from the acidic solution. This might affect the corrosion process and, consequently, the corrosion rate. To clarify this aspect, three as-prepared SLM samples were kept continuously in a 1 M HNO3 solution for 14 days. The weight-loss was found to be 5.49 ± 0.21 mg/cm2, which is similar to the value observed when the same process is interrupted periodically (5.72 ± 0.15 mg/cm2). This demonstrates that the periodic interruption of the corrosion tests has a minimal effect of the weight-loss.
Figure 6(b) presents the weight-loss curves for the as-prepared SLM, cast, and SLM heat-treated specimens in 1 M HNO3 solution. The weight-loss curve for the as-prepared SLM and the cast specimens are very similar, suggesting that the corrosion behavior exhibited by these materials is comparable, even though the initial microstructures of these samples are different (cellular for the as-prepared SLM material and eutectic for the cast sample, as shown in Fig. 1). The weight-loss gradually increases with increasing annealing temperature for the SLM samples; a weight-loss of 10.68 ± 0.26 mg/cm2 is observed for the material heat-treated at 723 K, which is two times higher than the SLM sample in the as-prepared condition.
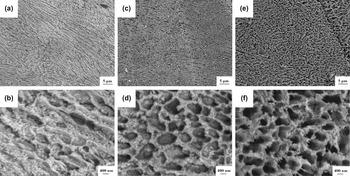
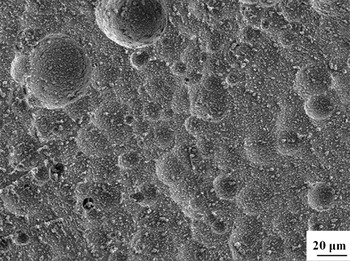
Figure 7 shows the cross-section of the as-prepared SLM samples exposed for 14 days to acidic solutions with three different HNO3 concentrations. The corroded surfaces of the as-prepared SLM material display a porous-like cellular structure with pore size increasing with increasing HNO3 concentration. This suggests that preferential corrosion of Al or Si occurs in these samples. Comparing the structure observed in Fig. 7 to the cellular microstructure shown in Fig. 1, reveals that the remaining phase in the corroded materials is Si and that Al is corroded out under the acidic environment.
Microstructure of the Al–12Si as-prepared SLM samples after 14 days of immersion in (a, b) 0.01 M HNO3 (pH = 2), (c, d) 0.1 M HNO3 (pH = 1), and (e, f) 1 M HNO3 (pH = 0) solutions.

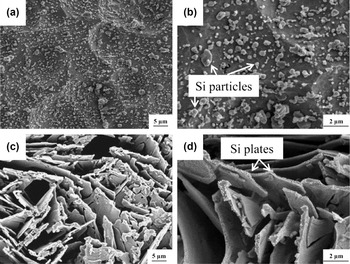
Figure 8 shows the corroded surfaces of the Al–12Si SLM heat-treated at 673 K [Figs. 8(a) and 8(b)] and cast [Figs. 8(c) and 8(d)] samples after 14 days of immersion in 1 M HNO3. As shown in Fig. 7, the as-prepared SLM sample shows a porous cellular structure after corrosion resulting from the selective corrosion of Al. However, the SLM heat-treated samples undergo a microstructural transformation Reference Prashanth, Scudino, Klauss, Surreddi, Löber, Wang, Chaubey, Kühn and Eckert25 from cellular for the as-prepared SLM sample to composite-like microstructure, consisting of Si particles dispersed in the Al matrix. The SLM sample annealed at 673 K shows an average Si particle size of 0.656 ± 0.17 μm. Reference Prashanth, Scudino, Klauss, Surreddi, Löber, Wang, Chaubey, Kühn and Eckert25 Figures 8(a) and 8(b) show Si particles in the same size range (0.65 μm). The Si particles are isolated and are weakly attached to the surface of the samples as a result of the dissolution of the surrounding Al matrix. Corrosion of the Al matrix is not uniform and proceeds via a multitude of local dissolution events leading to the formation of pitting-like features. Those pits are clearly visible in the low magnification image shown in Fig. 9. It can be observed that the pits are formed throughout the surface of the sample. However, the size distribution of the pits is nonuniform, displaying diameters of the pits ranging from 5 to 50 μm.
Microstructure of the Al–12Si (a, b) SLM heat-treated at 673 K and (c, d) cast samples after 14 days of immersion in 1 M HNO3 solution.

Corroded surface of the Al–12Si SLM specimen annealed at 673 K after 14 days of immersion in 1 M HNO3 solution.

The corroded surface of the cast sample [Figs. 8(c) and 8(d)] is in the form of an array of closely spaced Si platelets with length in the range 15–40 μm resulting from corrosion of Al from the eutectic microstructure. It is interesting to note that the corroded surface of the SLM, SLM heat-treated, and cast samples are completely different.
IV. DISCUSSION
A. Wear experiments
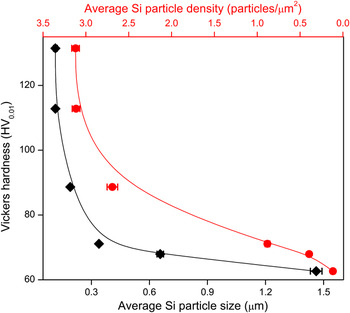
The volume loss (V s), which is proportional to the wear rate Q s [cf. Eq. (1)], is inversely proportional to the hardness of the material. The current system also obeys Eq. (2): where the wear rate of the SLM samples increases with decreasing hardness (Fig. 2). This is a direct consequence of the microstructure evolution during heating of the present SLM samples: the hardness decreases with increasing size of the Si particles as a result of the annealing treatment (Fig. 10). In addition, the hardness and, therefore, the wear rate of the SLM samples decrease with decreasing average density of the Si particles (Fig. 10), in agreement with previous works reporting that the good dispersion of the hard particles in the matrix leads to improved wear properties. Reference Kumar, Chakraborty, Subramanya Sarma and Murty46–Reference Thakur and Dhindaw48 The same conclusions can be drawn for the fretting wear (Fig. 4).
Influence of the size (υ) and density (λ) of the Si particles on the hardness of the Al–12Si SLM samples.

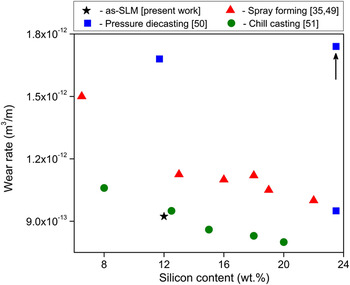
Figure 11 compares the wear rates of Al–Si alloys produced by different techniques, as a function of the Si content. Reference Raghukiran and Kumar35,Reference Suh36,Reference Srivastava, Rudrakshi, Uhlenwinkel and Ojha49–Reference Torabian, Pathak and Tiwari51 Similar wear testing parameters are chosen, aiding for the direct comparison with the present materials, except for the spray-formed Al–Si samples with Si content between 13 and 22 wt.%, Reference Raghukiran and Kumar35 where the sliding speed is 0.3 m/s. Despite the slower sliding speed with respect to the present work (1 m/s) and the larger Si content, the wear rates of these samples are higher than the as-prepared SLM sample.
Wear rates of Al–Si alloys produced by different techniques as a function of the Si content.

Prasad et al. Reference Prasad, Venkateswarlu, Modi, Jha, Das, Dasgupta and Yegneswaran50 have estimated the wear rate of Al–23.5Si alloys produced by gravity and pressure die-casting. The wear rate of the Al–23.5Si sample produced by gravity casting (indicated by an arrow in Fig. 11) is 50% higher than the present as-prepared SLM sample, whereas the sample produced by pressure die-casting shows a similar wear rate even though the Si content is about 2 times larger.
Torabian et al. Reference Torabian, Pathak and Tiwari51 have studied the sliding wear of binary Al–Si alloys with Si content ranging from 2 to 20 wt.% produced by chill casting. As expected, the wear rate of the chill-cast materials decreases with increasing hard Si phase (Fig. 11). Like SLM, the chill casting technique can also achieve high cooling rates. Reference Torabian, Pathak and Tiwari51 As a result, the wear rate of the chill-cast Al–12.5Si alloy is similar to that of the as-prepared Al–12Si SLM alloy. Except for the alloys produced by chill casting, Reference Torabian, Pathak and Tiwari51 all the other Al–Si alloys compared herewith Reference Elleuch and Fouvry34,Reference Thakur and Dhindaw48,Reference Srivastava, Rudrakshi, Uhlenwinkel and Ojha49 have higher wear rates than the as-prepared SLM material. This indicates that the microstructural refinement achievable by SLM processing not only leads to a significant strengthening of the Al–12Si alloy, Reference Prashanth, Scudino, Klauss, Surreddi, Löber, Wang, Chaubey, Kühn and Eckert25 but also induces remarkable tribological properties.
B. Corrosion experiments
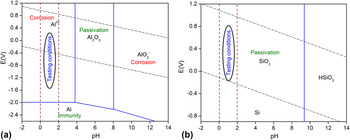
Figure 12 shows the Pourbaix diagrams for Al and Si. Reference Pourbaix52 The concentrations of HNO3 used in the present study (0.01, 0.1, and 1 M) correspond to pH values of 2, 1, and 0, respectively. At these pH levels, the Pourbaix diagrams suggest the dissolution of Al in the form of Al3+ ions [Fig. 12(a)]. On the contrary, the most favored state for Si is SiO2, which may act as a passive film blocking further oxidation of the Si atoms [Fig. 12(b)]. Hence, in the Al–Si system, the contact with HNO3 leads to selective corrosion in the form of Al dissolution and to the formation of a passive SiO2 layer. This explains why in the present study the Al rich phase corrodes out, while the Si rich phase remains intact.
Pourbaix diagrams for (a) aluminum and (b) silicon, showing the regions of corrosion, immunity, and passivation (after Ref. Reference Pourbaix52).

Figure 6(c) shows the weight-loss curve for the as-prepared SLM sample immersed in 0.1 M HNO3 over the period of 14 days at a higher magnification. As already observed in Fig. 6(a), the corrosion rate is not constant throughout the 14 days period. Instead, it shows a higher corrosion rate in the initial period of 3 days [corresponding to region – I in Fig. 6(c)] and a reduced corrosion rate for the rest of the period (region – II). Similar behavior is observed for the cast samples and SLM specimens heat-treated at 473 and 573 K [Fig. 6(b)]. In contrast, this behavior is not observed for the SLM samples heat-treated at 673 and 723 K.
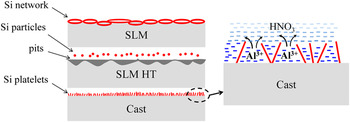
This behavior can be explained with the help of the schematic illustrations shown in Fig. 13. As a result of the rapid solidification during SLM, the as-prepared SLM material has a cellular microstructure consisting of a supersaturated primary Al-rich phase with residual Si segregated at the cellular boundaries [Fig. 1(a)]. In accordance with the Pourbaix diagrams presented above, the Al atoms from the Al-rich phase may be expected to dissolve in the electrolyte as Al3+ ions, while the Si atoms are oxidized to SiO2, which remains on the sample surface. As shown in Fig. 7, the cellular boundaries (now Si/SiO2) observed in the SLM as-prepared samples are mechanically stable and remain attached to the sample surface. Hence, the continuous boundary network of Si prevails during the corrosion process. This phenomenon is observed in the first 3 days of the corrosion process [region – I in Fig. 6(c)].
Schematic illustrations showing the corrosion behavior in Al–12Si as-prepared SLM, heat-treated SLM, and the cast samples under acidic environment.

Once the first layer of the Al-rich phase is removed from the surface of the material, the presence of the continuous Si network hinders the access of the HNO3 electrolyte to the subsequent layers. This restricted access may limit the transport rate of Al3+ away from the corroding interface and toward the bulk of the electrolyte, consequently decreasing the corrosion rate, as observed in region II. On the other hand, the heat-treated SLM samples, especially the materials annealed at 673 and 723 K, do not show a significant variation of the corrosion rate with the immersion time. In these samples, Si is present as isolated particles within the Al matrix. Reference Prashanth, Scudino, Klauss, Surreddi, Löber, Wang, Chaubey, Kühn and Eckert25 Again, during corrosion in HNO3, the Al atoms are oxidized to Al3+ ions and are removed from the surface of the sample. Although the Si particles are not dissolved in the electrolyte due to passivation, they are no longer interconnected as in the as-prepared SLM material, and thus are easily detached from the surface once the surrounding Al matrix is corroded (Fig. 13). This process is continuous and, hence, corrosion takes place at a constant rate during the testing period, leading to pits throughout the samples’ surface.
In the Al–12Si SLM samples, Si is gradually rejected from the supersaturated Al with increasing annealing temperature to form small Si particles. Reference Prashanth, Scudino, Klauss, Surreddi, Löber, Wang, Chaubey, Kühn and Eckert25 At the same time, the Si cellular boundaries also transform into Si particles. Reference Prashanth, Scudino, Klauss, Surreddi, Löber, Wang, Chaubey, Kühn and Eckert25 The particulate morphology of free Si in the heat-treated samples explains well the increase of the corrosion rate with annealing temperature: as the annealing temperature increases, the amount of free Si in the form of isolated particles increases and their detachment due to the corrosion of the surrounding Al matrix contributes to the weight loss.
Contrary to the heat-treated SLM samples, the cast material shows a very similar weight-loss curve with respect to the as-prepared SLM samples. The cast material displays a eutectic microstructure [Fig. 1(a)] with a larger amount of free Si and, consequently, with a smaller Si content in the Al-rich phase compared to the as-prepared SLM samples. This indicates that the connectivity of the free Si plays a more important role for the corrosion rate than the solubility of Si in Al. Therefore, a similar two-stage mechanism as proposed for the as-prepared SLM material may be used to explain the corrosion features of the cast samples. In the region – I, the removal of Al takes place selectively from the surface of the sample. In the region – II, the access of HNO3 to Al is restricted by the Si platelets, leading to the observed decrease of corrosion rate.
V. SUMMARY
The tribological and corrosion properties of the Al–12Si samples processed by SLM have been evaluated through sliding and fretting wear, and immersion corrosion tests. The results reveal that the as-prepared SLM samples show better wear resistance than their cast counterparts, whereas they display similar corrosion behavior. Both the wear and corrosion properties deteriorate with annealing treatments. The deterioration of the wear properties is attributed to the growth of the Si particles, which reduces the resistance of the Al–12Si material against sliding and fretting wear. The corrosion resistance is reduced as a result of the loss of the connectivity between the Si particles, which in turn allows easier access of the corroding medium to the Al phase.
ACKNOWLEDGMENTS
The authors would like to thank Prof. Wei Wen Zhang and Yu Xuan Liu for the help and support for conducting the fretting wear experiments. Authors also would like to acknowledge Natural Science Foundation of China (GD-NSFC) Foundation (U1034001) for their funding support to conduct fretting wear experiments at School of Mechanical and Automotive Engineering, South China University of Technology, Guangzhou 510640, China.