Implications
Goat husbandry is widespread worldwide and its importance could increase in the future to satisfy the food demand of a growing world population and the demand for quality and healthy products by the consumer. Our study led to a deeper knowledge of the relationships between certain genes considered and the quality of meat, helping the farmers to obtain a product meeting consumers’ expectation. In particular, our experiment has highlighted the importance of some genes involved in goat meat tenderness, opening the possibility to consider them as markers of this fundamental aspect of meat quality.
Introduction
Goat husbandry is widespread worldwide, and in the last 10 years, there has been a 19% increase of the world’s caprine population with values that exceeded 37% and 11% in Africa and Asia, respectively. Moreover, these continents will have a population increase of more than 80% over the next 20 years (Food and Agriculture Organization of the United Nations, 2018). Therefore, goat meat can play a role in satisfying the growing demand of products of animal origin on these continents. Goat meat can also satisfy the demand for healthy products by consumers in developed countries. In fact, goat meat has a low intramuscular fat content ranging between 0.6% and 2.6%, is rich in protein of high biological value and is high in beneficial fatty acids, such as α-linolenic and CLA (Webb et al., Reference Webb, Casey and Simela2005). The consumption of goat meat is linked to cultural and geographical factors. For marketing purposes, goat meat could be divided into two classes: one that was derived from young suckling animals (i.e. capretto, cabrito) producing carcasses of 6 to 12 kg, and chevon, one derived from older goats producing carcasses of 16 to 22 kg. In some countries of the Mediterranean basin, such as Italy, capretto/cabrito production is traditional and still the main meat product from goats. Less frequently, chevon is considered for consumption. Conversely, meat from heavier animals are preferred in other parts of the world, such as North America.
Tenderness is the most important factor influencing consumer satisfaction for meat (Argüello et al., Reference Argüello, Castro, Sánchez-Macías and Capote2012). The low acceptability of some consumers toward goat meat is due to the frequent lack of tenderness (Webb et al., Reference Webb, Casey and Simela2005). Tenderness is affected by many factors, such as the species, breed and age of the animal, and, at the muscle level, by the amount of collagen, intramuscular fat content, pH postmortem decline, and the size and type of muscle fibers. Based on what is known in cattle, many enzymatic systems are involved in protein degradation and are taken into consideration in the postmortem meat tenderization process (Kemp et al., Reference Kemp, Sensky, Bardsley, Buttery and Parr2010; Saccà et al., Reference Saccà, Bessong, Corazzin, Bovolenta and Piasentier2018). Among endogenous proteinases, calpains play a primary role in meat tenderness development during aging. Calpain-1 and calpain-2 are calcium-activated proteases that can hydrolyze the myofibrillar and cytoskeletal proteins (such as troponin-T, α-actinin, myosin and titin, nebulin, filamin and desmin) and cause structural changes during meat aging. Conversely, the high activity of their specific inhibitor, calpastatin, is related to the low degradation of myofibrillar proteins and low meat tenderness (Koohmaraie and Geesink, Reference Koohmaraie and Geesink2006).
Becila et al. (Reference Becila, Herrera-Mendez, Coulis, Laba, Astruc, Picard, Boudjellal, Pelissier, Bremaud and Ouali2010) provided evidence that the hypoxic/ischemic conditions that occur during the slaughter of animals could activate muscle cell death postmortem via an apoptotic process. There is growing interest in investigating the involvement of apoptosis in meat tenderization. Caspases are the main enzymes responsible for apoptosis. They can be initiators (such as caspases 8 and 9) or effectors (such as caspases 3 and 7). The predominant pathway of apoptosis in postmortem skeletal muscle occurs with the action of caspases 9 and 3 (Herrera-Mendez et al., Reference Herrera-Mendez, Becila, Boudjellal and Ouali2006). Initiator caspases are activated in response to environmental stresses and can activate effector caspases that can cleave specific substrates, including myofibrillar and cytoskeletal proteins (Brad Kim et al., Reference Brad Kim, Ma, Setyabrata, Farouk, Lonergan, Huff-Lonergan and Hunt2018). Despite this capacity to degrade a large number of muscle proteins, caspases role in the meat tenderization process is still debated (Saccà et al., Reference Saccà, Corazzin, Pizzutti, Lippe and Piasenter2015).
However, the state of stress caused by the ischemia that characterizes postmortem conditions could also activate some cell survival processes that involve increasing the concentration of several heat shock proteins (Hsp). In relation to their physiological role as chaperones, anti-apoptotic and anti-oxidative factors, heat shock proteins are believed to be involved in the transformation of muscle to meat (Cassar-Malek and Picard, Reference Cassar-Malek and Picard2016). In particular, Hsp27 can interrupt the apoptosis cascade at many levels, and together with other small Hsp, such as αB-crystallin and Hsp20, it can stabilize and protect muscle proteins (such as desmin and titin) to calpains action (Lomiwes et al., Reference Lomiwes, Hurst, Dobbie, Frost, Hurst, Young and Farouk2014). Hsp70 to 40 have been identified as regulators and suppressors of the apoptotic process by several authors.
Despite numerous reports on beef, scarce information is available on the expression of the genes involved in the meat tenderization process in goat, and, according to the bibliography, even less information is available on the variation of the expression of these genes during animal growth (Lin et al., Reference Lin, Zhu, Wang, Li and Lin2017). It was hypothesized that the quality and the tenderness in particular, of goat meat at different ages could have a genetic origin. Therefore, the aim of this trial was to assess meat quality traits and the expression of tenderness-related genes, such as calpains, calpastatin, caspases and Hsp, at both the messenger RNA (mRNA) and protein levels, in the longissimus lumborum (LL) of young goats at different ages.
Material and methods
Animals and treatments
Thirty-two young male goats of Alpine breed born on commercial farms of the Friuli Venezia Giulia region (N-E Italy) at the end of winter were considered. Animals were randomly allotted into three groups, which included 9 suckling kids (Sk), 16 chevons (Ch) and 7 post-puberal goats (Pu). After birth, the kids were suckled by their dams up to weaning, when the Sk group was slaughtered. After weaning, the remaining kids were transferred to the experimental farm and kept in a pen with straw bedding until slaughter. Animals were fed ad libitum on a mixed diet comprising 400 g/day of meadow hay (913 g/kg dry matter (DM), 85 g/kg DM ash, 87 g/kg DM CP, 23 g/kg DM ether extract, 646 g/kg DM NDF) and 800 g/day of commercial concentrate. The concentrate was made up of cereals by-products (wheat middlings, distillers corn grains, wheat bran, 377 g/kg), cereals grains (corn and barley, 304 g/kg), sunflower (100 g/kg), soybean (80 g/kg) and rapeseed meal (28 g/kg), grape by-products (22 g/kg), carob (10 g/kg), minerals, vitamins and molasses (79 g/kg). The proximate analysis was as follows: 867 g/kg DM, 80 g/kg DM ash, 32 g/kg DM ether extract, 238 g/kg DM NDF, 177 g/kg DM CP, 269 g/kg DM starch and 7.67 MJ/kg DM net energy for fattening. The milk intake of Sk was not measured. The young goats were weighed bi-weekly (from birth to slaughter for the Sk group and from weaning to slaughter for the Ch and Pu groups) to determine live weight gain and on the day before slaughtering to determine the live weight at slaughter. The slaughter occurred at an average age of 5.4±0.15 weeks for the Sk group, 17.1±0.55 weeks for the Ch group and 34.3±0.47 weeks for the Pu group. The animals in the Sk, Ch, and Pu groups were in the impuberal, pre-puberal and post-puberal phases, respectively.
Sample collection and first measurements
For all analysis, the LL of the right side of the carcass was considered. After slaughter, samples (5 g) of LL muscle were obtained within 20 min of exsanguination, frozen in liquid nitrogen and stored at −80°C until mRNA and protein analysis.
Twenty-four hours after slaughter, the carcasses were weighed to determine the cold carcass weight and visually evaluated for subcutaneous and kidney fat deposition. In particular, fat cover and kidney fat were assessed visually using the available photographic standards, together with the description of each, following the procedure of Colomer Rocher et al. (Reference Colomer Rocher, Morand-Fehr and Kirton1987). Ultimate pH was measured at five points/loin using a pH-meter (HI 8424; Hanna Instruments, Padova, Italy) equipped with a glass electrode (5232; Crison Instruments, Barcelona, Spain). The samples for fat content analysis were taken from the LL and immediately stored at −20°C until analysis. After 48 h of aging at 4°C, the color of the LL was measured by obtaining a 2 cm slice of the loin and allowing for a blooming time of 45 min. Measurements were obtained on five points/slice using a portable spectrophotometer, Minolta CM 2600d (Konica Minolta, Tokyo, Japan), with an 8 mm aperture, Standard Illuminant D65 light source and 10 viewing angle geometry. The values recorded, according to the standard conditions of the Commission Internationale de I’Eclairage (1986), included lightness (L*), redness (a*) and yellowness (b*). At the same time, samples of LL were collected and aged at 4°C for 7 days until cooking loss and Warner–Bratzler Shear Force (WBSF) determination.
Cooking loss and Warner-Bratzler Shear Force determinations
Slices of LL muscle of 2 cm thickness were cooked in plastic bags using a water bath until they reached 75°C at the core (Honikel, Reference Honikel1998). The internal temperature was monitored by a thermocouple (Thermocouple Thermometer HD 9016; Delta Ohm, Padova, Italy). Each slice of meat was weighed before and after cooking (dried with paper). The cooking loss was calculated as the difference between the weight before and the weight after cooking and expressed as a percentage of the initial weight.
The WBSF test was performed on cooked meat after cooking loss determination. Seven cross-section cylinders 15 mm in diameter were cut along the fibers axis for each LL sample. The cylinders were sheared perpendicularly of muscle fibers using a Warner–Bratzler device equipped with a triangular hole (60°) in the shear blade (1 mm thickness), mounted on a Lloyd TA Plus texture analyzer (Lloyd, Borgnor Regis, UK) and operating at a crosshead speed of 100 mm/min. From the WB deformation curves, two parameters were recorded: the peak yield force (PY, in N), which is the maximum peak yield of the force-deformation curve, and the final yield (FY, in N), which is the second peak yield of the force-deformation curve. The first peak is taken as a measurement of the myofibrillar component of tenderness and the second is taken as a measurement of the connective tissue component of tenderness (Møller, Reference Møller1981).
Intramuscular fat content analysis
Two grams of minced meat were homogenized in 40 ml of chloroform–methanol mixture (2 : 1 v/v) using an Ultra-Turrax homogenizer (T 25 basic; IKA, Staufen, Germany) and were subsequently filtered under a vacuum through Whatman filter paper (1820-047; GE Healthcare Life Sciences, Pittsburgh, PA, USA). The extract was washed with 10 mL of 0.88% (w/v) KCl, mixed vigorously for 1 min and then left overnight at room temperature. The organic phase was separated and the solvents were evaporated at 40°C with a Univapo Vacuum Concentrator (100EHC; Elettrofor Scientific Instruments, Rovigo, Italy). The fat amount was calculated by the difference between the weights before and after evaporation and expressed as grams of lipids per 100 g of muscle tissue.
RNA expression analysis
Ribonucleic acid analysis was made in according to previous experiments (Saccà et al., Reference Saccà, Corazzin, Pizzutti, Lippe and Piasenter2015), with some modifications, in particular regarding the sequence of some primers used.
RNA extraction
Total RNA was extracted from 40 mg of muscle (powdered with a mortar and a pestle in liquid nitrogen) using the RNeasy Fibrous Tissue Mini Kit (Qiagen, Hilden, Germany) according to the manufacturer’s protocol, DNase treatment included. The concentration and purity of extracted RNA were assessed using a NanoDrop 2000c spectrophotometer (Thermo Fisher Scientific, Waltham, MA, USA). The integrity of RNA (presence of intact 18S and 28S ribosomal RNA bands) and absence of genomic DNA were assessed by agarose gel (1% in tris-borate ethylendiaminetetracetic acid (TBE) buffer) electrophoresis, comparing with molecular weight standards.
Retro-transcription
To obtain complementary DNA (cDNA), the iScript cDNA Synthesis kit (Bio-Rad, Hercules, CA, USA) was used. Each 20 μl of reaction contained 4 μl of reverse-transcription reaction mix, 1 μl of iScript reverse transcriptase (moloney murine leukemia virus-derived RNase H+), the volume of RNA solution necessary to produce a final concentration of 50 ng/μl RNA, and nuclease-free water to final volume. The mixture was held for 5 min at 25°C, 1 h at 42°C and 5 min at 85°C before being cooled on ice.
Primers validation
A qualitative PCR was carried out on six randomly chosen samples to validate the primers pairs (Supplementary Table S1) specificity for all the genes examined: calpain-1 (Capn1), calpain-2 (Capn2), calpastatin (Cast), caspase 3 (Casp3), caspase 9 (Casp9), αB-crystalline (Cryab), heat shock protein 27 (Hsp27), heat shock protein 40 (Hsp40), heat shock protein 70 (Hsp70) and reference genes. Polymerase chain reaction was performed using the Bio-Rad CFX96 system (Bio-Rad) on a reaction volume of 20 μl containing 0.3 μl of each forward and reverse primer (0.3 μM), 10 μl of iQ SYBR Green Supermix (Bio-Rad), 8.4 μl of sterile water and 1 μl of cDNA. Amplification conditions included one cycle of 3 min at 95°C, 40 PCR cycles (15 s at 95°C, 30 s at 60°C), 30 s at 72°C and 1 min at 95°C, followed by a melt curve of 55°C to 95°C with increments of 0.5°C every 5 s. Unspecific amplifications and primer-dimers formation were excluded by checking melt curves. Amplicons length (Supplementary Table S1) was verified by agarose gel (1.5% in TBE buffer) electrophoresis, comparing with molecular weight standards.
Quantitative PCR
Quantitative PCR was performed on each sample for every gene examined using the same instrument, reaction reagents and volumes, and amplification conditions that were used in the primers validation phase. Each sample was analyzed in triplicate and relative gene expression was calculated according to the efficiency-corrected (Pfaffl, Reference Pfaffl2001) 2−ΔΔCq method (Livak and Schmittgen, Reference Livak and Schmittgen2001). Cyclophilin, β-actin, Glyceraldehyde-3-P dehydrogenase (GAPDH) and Ribosomial Protein Large P0 (RPLP0) were treated as reference genes. Since all the reference genes showed an average expression stability (M value) lower than 1 after GeNorm analysis, their geometric mean was used for the normalization of data (Vandesompele et al., Reference Vandesompele, De Preter, Pattyn, Poppe, Van Roy, De Paepe and Spelman2002). Data are presented as the fold-change ratio with the Sk group as reference. Primers efficiencies (Supplementary Table S1) were calculated and verified using the standard curve obtained by amplification of serial dilutions of the pooled cDNA (Pfaffl, Reference Pfaffl2001).
ELISA analysis of calpain-1 and calpastatin
Protein extraction
Two hundred milligrams of the frozen meat sample were homogenized on ice for 1 min using an Ultra-Turrax T25 basic (IKA, Staufen, Germany) in 1 ml of ice-cold extraction buffer (50 mM Tris/HCl, pH 8.3, 10 mM ethylendiaminetetracetic acid (EDTA) and 0.05% v/v 2-mercaptoethanol) and 10 µl of Protease Inhibitor Cocktail (P8340; Sigma-Aldrich, Saint Louis, MO, USA). The homogenate was centrifuged at 30 000 g for 1 h at 4°C and the supernatant was collected. Protein concentrations of the muscle extracts were determined using Bradford reagent (Sigma-Aldrich).
Quantification of calpain-1 and calpastatin
Capn1 and Cast were quantified by ELISA. Muscle extracts were adjusted to concentrations of 10 µg/ml protein with Tris-buffered saline (TBS). One hundred microliters of samples was dispensed into 96-well Costar® high binding polystyrene plates (3590; Corning Inc., NY, USA) in duplicate and incubated for 2 h at 37°C. Following coating, the contents of the wells were discarded and the wells were blocked with 200 μl/well of 1% bovine serum albumin (BSA)-TBS for 1 h at room temperature. After that, wells were washed three times with TBS containing 0.01% Tween-20 (TTBS) and then incubated for 1 h at 37°C with 100 ml/well of the mouse monoclonal anti-calpain-1 antibody (C0355; Sigma-Aldrich), diluted to 10 µg/ml in 1% BSA-TTBS, or with 100 ml/well of the mouse monoclonal anti-calpastatin antibody (SAB1402139; Sigma-Aldrich), diluted to 15 µg/ml in 1% BSA-TTBS. Wells were then washed three times with TTBS and the goat anti-mouse IgG HRP conjugate (A4416; Sigma-Aldrich), diluted to 1 : 500 in 1% BSA-TTBS, was applied for 1 h at 37°C. Following five washes with TTBS, 100 ml/well of 3,3’,5,5’-tetramethylbenzidine (TMB) substrate (T0440; Sigma-Aldrich) was applied. After approximately 10 min at room temperature, the reaction was stopped by adding 100 ml/well of 2 N H2SO4. The absorbance was measured at 450 nm using a Tecan Sunrise plate reader (Tecan Group Ltd., Männedorf, Switzerland). The relative quantity of Capn1 and Cast was measured by optical density (OD). Data are presented as the fold-change ratio with the Sk group as a reference. The mean intra-assay CV for Capn1 and Cast were 4.8% and 6.1%, respectively, whereas the mean inter-assay CV for Capn1 and Cast were 10.5% and 12.7%, respectively. The limit of detection was 0.2020 OD for Capn1 and 0.2210 OD for Cast. The linearity (R 2) of the calibration line was 0.981 for Capn1 and 0.985 for Cast.
ELISA analysis of heat shock protein 27 and αB-crystallin
Protein extraction
Two hundred milligrams of the frozen meat sample were homogenized on ice for 1 min using an Ultra-Turrax T25 basic (IKA, Staufen, Germany) in 1 ml of ice-cold extraction buffer (25 mM HEPES pH 7.5, 0.1% Triton X-100, 5 mM MgCl2, 1 mM EDTA and 1 mM 2-mercaptoethanol) and 10 µl of Protease Inhibitor Cocktail (P8340; Sigma-Aldrich) to produce the whole muscle homogenate. The homogenate was centrifuged at 20 000 g for 10 min at 4°C, and the supernatant was collected (sarcoplasmic fraction). Protein concentrations of the muscle extracts were determined using Bradford reagent (Sigma-Aldrich).
Quantification of heat shock protein 27 and αB-crystallin
Hsp27 and Cryab were quantified by ELISA. The sarcoplasmic fraction was adjusted to concentrations of 10 µg/ml protein with coating buffer (10 mM Na2HPO4, 15 mM NaCl; pH 7.4). One hundred microliters of samples was dispensed into 96-well Costar® high binding polystyrene plates (3590; Corning Inc.) in duplicate. Plates were placed on an oscillating shaker overnight at 4°C. Following coating, the contents of the wells were discarded, and the wells were blocked with 200 μl/well of 1% BSA wash buffer (10 mM Na2HPO4, 15 mM NaCl, 0.1% Tween 20; pH 7.4) for 1 h at room temperature, and then washed three times with 200 µl/well wash buffer. Following washing, 100 μl/well of the mouse monoclonal antibody anti-Hsp27 (WH0003315M4; Sigma-Aldrich), diluted to 5 µg/ml in 1% BSA in assay buffer (0.01 M PBS, 0.01% Tween 20) or anti-Cryab (WH0001410M1; Sigma-Aldrich), diluted to 10 µg/ml in 1% BSA in assay buffer, were added and incubated for 2 h at room temperature and then washed as previously described. The goat anti-mouse IgG HRP conjugate (A4416) was diluted to 1 : 1000 in assay buffer (1% BSA), and 100 μl/well aliquots were dispensed and incubated for 1 h at room temperature. Following washing, 100 μl/well of 3,3’,5,5’-TMB substrate (T0440; Sigma-Aldrich) was dispensed and incubated for 30 min. The reaction was stopped by dispensing 100 μl/well of 2 N H2SO4. The absorbance was measured at 450 nm using a Tecan Sunrise plate reader (Tecan Group Ltd., Männedorf, Switzerland). The relative quantity of Hsp27 and Cryab was measured by OD. Data are presented as the fold-change ratio with the Sk group as a reference. The mean intra-assay CV for Cryab and Hsp27 were 4.4% and 4.8%, respectively, whereas the mean inter-assay CV for Cryab and Hsp27 were 8.9% and 9.7%, respectively. The limits of detection was 0.1505 OD for Cryab and 0.1210 OD for Hsp27. The linearity (R 2) of the calibration line was 0.979 for Cryab and 0.988 for Hsp27.
Statistical analysis
Data analysis was performed using R software (3.4.0 version, R core team, 2017) with the packages emmeans (Lenth, Reference Lenth2018), multcomp (Hothorn et al., Reference Hothorn, Bretz and Westfall2008) and mixOmics (Le Cao et al., Reference Le Cao, Rohart, Gonzalez and Dejean2017). The normality of the data distribution was tested using the Shapiro–Wilk test. The effect of goat meat type on fatness scores was studied using the Kruskal–Wallis test and the non-parametric Mann–Whitney U-test. For the other variables, when appropriate, non-parametrically distributed data were transformed for parametric testing. These variables were subjected to a one-way ANOVA with ‘goat type’ as a fixed effect. Tukey’s correction, adapted for an unequal sample size, was used for multiple comparisons. Partial Least Squares Discriminant Analysis (PLS-DA; Chevallier et al., Reference Chevallier, Bertrand, Kohler and Courcoux2006) was applied to check the efficacy of the data on in vivo performances, carcass, meat and gene expression (X matrix) to discriminate the goat types, the matrix (Y matrix) of which was made by defining a dummy variable for each of them. The association networks between X and Y data sets were generated using the ‘network’ function of the mixOmics package (Le Cao et al., Reference Le Cao, Rohart, Gonzalez and Dejean2017).
Results
Animal and meat characteristics
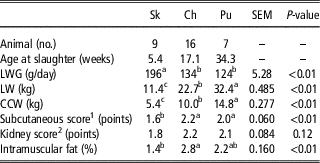
The animal and carcass characteristics, together with the lipid content of LL, are summarized in Table 1. The Sk group showed a higher live weight gain compared to the other age classes (P<0.05). Regarding fat deposits in carcasses and meat, Sk was the leanest group (subcutaneous fat, P<0.05), while for the intramuscular fat, it was leaner than the Ch group.
Animal and carcass characteristics and lipid content of the longissimus lumborum of the young goats

Sk=suckling kids; Ch=chevons; Pu=post-puberal goats; LWG=live weight gain (from birth to slaughter for Sk; from weaning to slaughter for Ch and Pu); LW=live weight at slaughter; CCW=cold carcass weight.
a,b,cValues within a row with different superscripts differ significantly at P⩽0.05.
1 From 1 (low fat cover) to 5 (very high fat cover) (Colomer Rocher et al., Reference Colomer Rocher, Morand-Fehr and Kirton1987).
2 From 1 (little) to 3 (excessive) (Colomer Rocher et al., Reference Colomer Rocher, Morand-Fehr and Kirton1987).
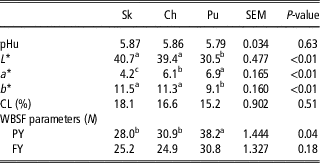
The ultimate pH and physical parameters of LL meat are shown in Table 2. The ultimate pH values were similar between groups (P>0.05). Lightness (L*) and yellowness (b*) were higher in the Sk and Ch groups compared to the Pu group (P<0.05). Moreover, the Sk group showed the lowest redness (a*) value (P<0.05). The cooking loss percentage was not different among age classes (P>0.05), and even for WBSF_FY, the difference between experimental groups did not reach the threshold of significance (P>0.05). Conversely, WBSF_PY was significantly lower in the Sk and Ch groups compared with the older group (P<0.05).
Ultimate pH, color characteristics, cooking loss (CL) and Warner–Bratzler Shear Force (WBSF) parameters of the longissimus lumborum of the young goats

Sk=suckling kids; Ch=chevons; Pu=post-puberal goats;
pHu=ultimate pH; L*=lightness; a*=redness; b*=yellowness; CL=cooking loss; PY=peak yield force; FY=final yield force.
a,bValues within a row with different superscripts differ significantly at P⩽0.05.
Messenger RNA and protein expression
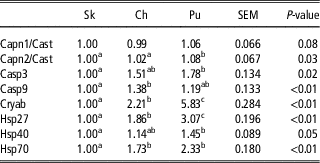
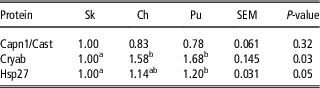
The gene expression results in terms of mRNA and protein are shown in Tables 3 and 4, respectively. Since Cast is the competitive inhibitor of Capn1 and Capn2, the calpain proteolytic system (Capn1, Capn2, Cast) is reported as Capn1/Cast and Capn2/Cast in tables. The Capn1/Cast ratio was similar between experimental groups, both in terms of mRNA abundance (P>0.05) and protein expression (P>0.05). The Capn2/Cast mRNA ratio was lower in younger animals compared to the Pu group (P<0.05). The Sk group also showed a lower level of Casp3 mRNA than the oldest goats (P<0.05), and Casp9 mRNA abundance was significantly different between the Sk and Ch groups (P<0.05). For Cryab and Hsp27, a significant increasing trend (P<0.05) was observed with animal age. The expression of Hsp40 was lower in the Sk group than in the Pu group (P=0.05); moreover, the expression of Hsp70 was lower in the Sk group than in the older groups (P<0.05). These results are similar to those obtained with ELISA analysis; in fact, the Cryab protein level in the Sk group was the lowest among the three groups, and the Hsp27 level in the Sk group was significantly lower than that in the Pu group (P=0.05).
Fold change ratio in relative RNA expression of the tenderness-related genes in longissimus lumborum of the young goats

Sk=suckling kids; Ch=chevons; Pu=post-puberal goats; Capn1=calpain-1; Capn2=calpain-2; Cast=calpastatin; Casp3=caspase 3; Casp9=caspase 9; Cryab=αB-crystallin; Hsp27=heat shock protein 27; Hsp40=heat shock protein 40; Hsp70=heat shock protein 70.
a,b,cValues within a row with different superscripts differ significantly at P⩽0.05.
Fold change ratio in relative protein quantity of the longissimus lumborum of the young goats

Sk=suckling kids; Ch=chevons; Pu=puberal goats; Capn1=calpain-1; Cast=calpastatin; Cryab=αB-crystallin; Hsp27=heat shock protein 27.
a,bValues within a row with different superscripts differ significantly at P⩽0.05.
Multivariate analysis
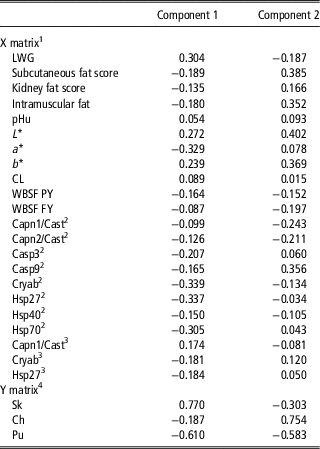
A multivariate analysis was performed to verify the possibility that animals’ features (in vivo performance, carcass and meat characteristics, and genes expression) considered could differentiate the experimental groups. A PLS-DA was thus carried out, and the loadings of X (standardized values of the animals’ features) and Y (goat types) variables along component 1 and component 2 are reported in Table 5. The two components explained about the 42% of the original variance of the animal features. The first component is positively correlated with live weight gain, and negatively correlated with a* and with the mRNA abundance of Cryab, Hsp27 and Hsp70; conversely, the second component is positively correlated with subcutaneous fat score, intramuscular fat level, L*, b* and the mRNA abundance of Casp9. At mRNA level, the Capn1/Cast and Capn2/Cast ratios showed very similar loadings on both components 1 and 2. Moreover, for the Y matrix values, along the component 1 the Sk group is well separated from the Pu group, while the Ch group is well separated from the other two groups on component 2.
Estimated loadings on the two first components of a Partial Least Squares Discriminant Analysis model for the classification of the goat types according to the age and the physiological condition (suckling kids (Sk); chevons (Ch); and post-puberal goats (Pu); Y matrix), based on their performance, carcass and meat characteristics, and gene expression profile (X matrix)

LWG=live weight gain; pHu=ultimate pH; L*=lightness; a*=redness; b*=yellowness; CL=cooking loss; WBSF PY=Warner–Bratzler Shear Force, peak yield force; WBSF FY=Warner–Bratzler Shear Force, final yield force; Capn1=calpain-1; Capn2=calpain-2; Cast=calpastatin; Casp3=caspase 3; Casp9=caspase 9; Cryab=αB-crystallin; Hsp27=heat shock protein 27; Hsp40=heat shock protein 40; Hsp70=heat shock protein 70.
1 Explained variance, 31% Component 1, 11% Component 2.
2 Messenger RNA.
3 Protein.
4 Explained variance, 46% Component 1, 54% Component 2.
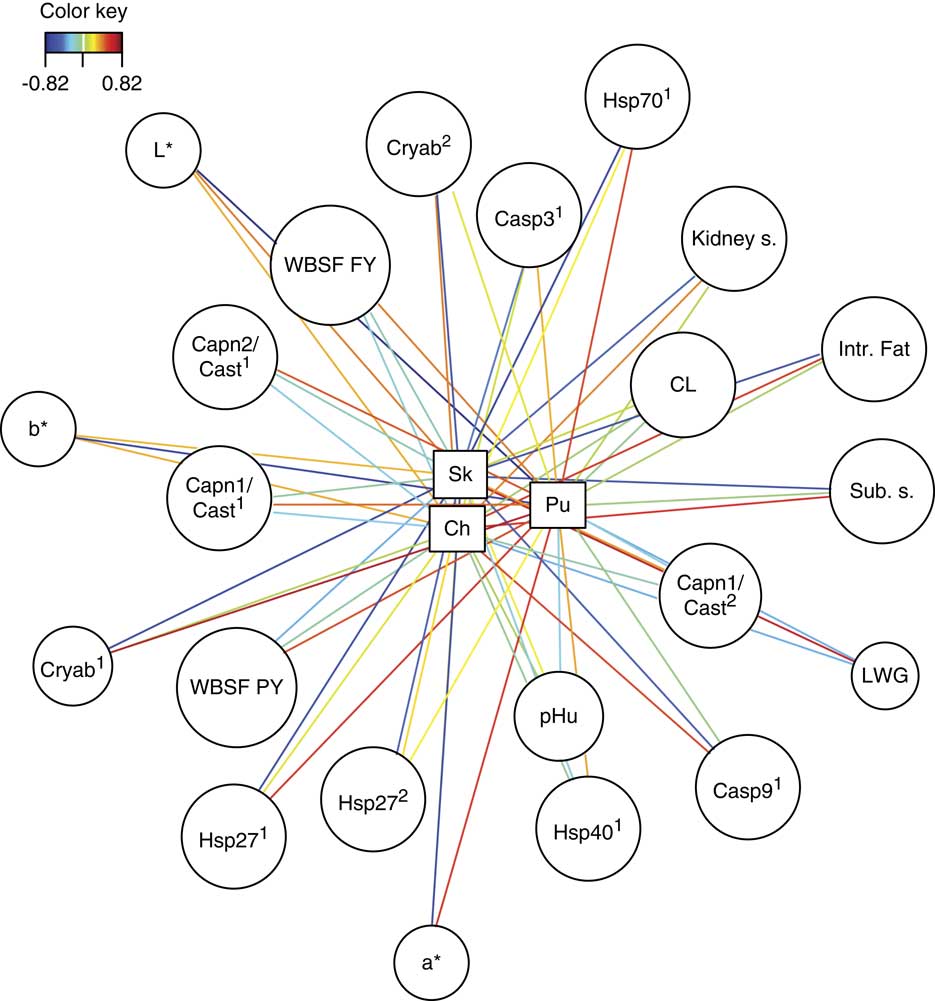
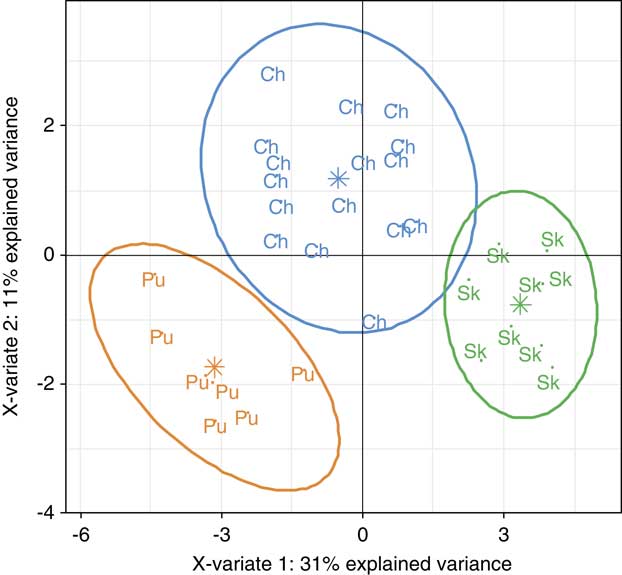
The association networks between the X (in vivo performances, meat and carcass characteristics and gene expression profile) and Y (goat type) data sets are reported in Figure 1. In this figure the negative association of the youngest group, Sk, with a* (−0.68), Cryab mRNA (−0.69), Hsp70 mRNA (−0.71) and Hsp27 mRNA (−0.67), the positive association of the same group with the live weight gain (0.67), the negative association of the oldest group, Pu, with L* (−0.82) and b* (−0.72), and the positive association of Pu with Cryab mRNA (0.69) are evident. The scores of the individual animals are plotted in Figure 2; the mRNA abundance can discriminate the youngest animals from the oldest ones (Sk v. Pu); intermediate characteristics were found for the Ch group.
Relevance networks plot. Correlation structure after Partial Least Squares Discriminant Analysis analysis between the goat types (suckling kids (Sk); chevons (Ch); post-puberal goats (Pu); Y matrix), and their performance, carcass and meat characteristics, and gene expression profile (X matrix). LWG=live weight gain; pHu=ultimate pH; L*=lightness; a*=redness; b*=yellowness; CL=cooking loss; WBSF PY=Warner–Bratzler Shear Force, peak yield force; WBSF FY=Warner–Bratzler Shear Force, final yield force; Kidney s.=fat kidney score; Intr. Fat=intramuscular fat; Sub. s.=subcutaneous fat score; Capn1=calpain-1; Capn2=calpain-2; Cast=calpastatin; Casp3=caspase 3; Casp9=caspase 9; Cryab=αB-crystallin; Hsp27=heat shock protein 27; Hsp40=heat shock protein 40; Hsp70=heat shock protein 70; 1messenger RNA; 2protein.

Partial Least Squares Discriminant Analysis plot of the individuals. The individual goats are divided by belonging group (suckling kids (Sk); chevons (Ch); post-puberal goats (Pu)). In the figure, also the group’s centroid and ellipse (95% confidence limit) were represented.

Discussion
Animal and meat characteristics
In our experiment, weaning seems to be the phase during which goats tend to gain the most weight relative to time when compared with any other phase in the growth process. Rojo Rubio (Reference Rojo Rubio, Kholif, Salem, Mendoza, Elghandour, Vazquez-Armijo and Lee-Rangel2016) showed a live weight gain of 163.2 g/day at weaning for Alpine breed, a value similar to that is reported in the present study, considering that the authors previously cited weaned the kids at a higher BW of 20 kg. The cold carcass weight in relation to the live weight of the three classes is in line with the literature data regarding Alpine breed (Borgogno et al., Reference Borgogno, Corazzin, Saccà, Bovolenta and Piasentier2015). The fat level results confirm the lean nature of goat carcasses (Webb et al., Reference Webb, Casey and Simela2005). In our trial, Sk was the leanest group regarding the subcutaneous fat level. In addition, Kaić et al. (Reference Kaić, Cividini and Potočnik2012) observed a significant increase in subcutaneous carcass fat, increasing the slaughter weight of kids from 9 to 14 to 16 to 24 weeks.
The ultimate pH values were similar between experimental groups and in line with those reported in previous works (Piasentier et al., Reference Piasentier, Volpelli, Sepulcri, Maggioni and Corti2005). Meat color is an important trait in goat carcasses evaluation, with pink or pale red expected for kids. The Sk group showed the lowest redness value of meat, probably because these animals were fed exclusively on milk. Redness reflects the presence of myoglobin and the availability of iron (Sañudo et al., Reference Sañudo, Campo, Muela, Olleta, Delfa, Jiménez-Badillo, Alcalde, Horcada, Oliveira and Cilla2012) in meat. An increase in redness was observed with goat age, in accordance with the parallel rise of muscle myoglobin content.
As previously stated, WBSF_FY and WBSF_PY are measurements of the connective tissue and myofibril contribution to meat tenderness, respectively (Møller, Reference Møller1981). In our trial, WBSF_FY was similar between experimental groups. It is well known that collagen is the most important protein of connective tissue, and its insolubility plays an important role in reducing meat tenderness (Starkey, Reference Starkey, Geesink, van de Ven and Hopkins2017). However, the lack of difference in WBSF_FY could be due to a limited difference in age between experimental groups, taking into account that the Sk and Ch groups were not puberal. Moreover, the experimental animals were too young for a difference in tenderness due to cross-links in the collagen molecules (Therkildsen et al., Reference Therkildsen, Melchior Larsen, Bang and Vestergaard2002) to be seen. Conversely, since the myofibrillar component of shear force (WBSF_PY) was significantly lower in the Sk and Ch groups compared to the Pu group, we suppose that this was due to a different postmortem proteolysis activity and myofibrillar degradation in pre-puberal goats and Pu. In other words, we speculate that sexual maturity could affects the expression of factors related with meat tenderness. Indeed, as suggested by Mberema et al. (Reference Mberema, Lietz, Kyriazakis and Sparagano2016) in cattle, androgens could influence the transcription of calpains, which are involved in myofibrils degradation and then in the development of the meat tenderness. Other authors highlighted the potential role of testosterone on sensory attributes of small ruminants’ meat, whose levels of 4-methyloctanoic and 4-methylnonanoic acids increase after sexual maturity, giving the goaty-muttony odor and flavor (Ames, Reference Sutherland and Ames1996; Borgogno et al., Reference Borgogno, Corazzin, Saccà, Bovolenta and Piasentier2015).
Messenger RNA, protein expression and multivariate analysis
Calpains are proteases considered to have a key role in postmortem tenderization because they are involved in muscle myofibrillar proteins degradation. Calpastatin is their specific inhibitor (Koohmaraie and Geesink, Reference Koohmaraie and Geesink2006), therefore, the calpains/Cast ratio can be considered to be related to beef tenderness. Guillemin et al. (Reference Guillemin, Bonnet, Jurie and Picard2011), in a proteomic study in cattle, found that in the longissimus muscle, both Capn1 and Capn2 were positively correlated with tenderness. Instead, in our trial, the direct role of the calpains/Cast ratio in determining muscle tenderization was not as evident because, while the Capn2/Cast mRNA ratio was higher in the Pu group compared to younger animals, Capn1/Cast expression was similar between experimental groups. Nevertheless, considering the important role of calpains in the balance between proteosynthesis and proteolysis of muscle fibers (Koohmaraie et al., Reference Koohmaraie, Kent, Shackelford, Veiseth and Wheeler2002), our Capn2/Cast ratio results suggest a lower rate of proteolysis in kids, in accordance with their higher growth rate. Discussing about muscle homeostasis, Goll et al. (Reference Goll, Neti, Mares and Thompson2008) attribute muscle growth to a decrease in protein degradation, principally due to an increase in calpastatin activity.
Muscle cells die by an apoptotic process after the slaughtering of animals (Becila et al., Reference Becila, Herrera-Mendez, Coulis, Laba, Astruc, Picard, Boudjellal, Pelissier, Bremaud and Ouali2010), and the intrinsic pathway of this process, which involves Casp9 (initiator) and Casp3 (effector), is the major pathway in muscle cells. For their role in apoptosis, caspases are suspected to have a role in muscle tenderization. In fact, effector caspases are responsible for the degradation of myofibrillar and cytoskeletal proteins and they can be related to muscle tenderization process and, probably because of their cooperative role with calpains, also to muscle turn-over (Guillemin et al. (Reference Guillemin, Bonnet, Jurie and Picard2011). In our trial, caspases 3 and 9 expression increase with the age of the animal similarly to the calpains/calpastatin ratio. Even Kemp et al. (Reference Kemp, Oliver, Wheeler, Chishti and Koohmaraie2013) highlighted the high level of cooperation between calpains and caspases in muscle homeostasis.
The Hsp expression showed an increasing trend with animal age both at the mRNA and protein levels. The similar, but non-exact, correspondence between mRNA and protein expression could be due to the post-transcriptional regulations or to the interactions between Hsp, as hypothesized by Yang et al. (Reference Yang, Cui, Yue, He, Yu, Liu, Liu, Ren and Meng2017). It was speculated that Hsp expression could be stimulated in response to muscle cell environmental stress, which can occur during physiological conditions or additionally during animal slaughtering. Hsp27, together with other small Hsp, such as Hsp20 and Cryab, can bind and protect myofibrillar proteins, such as desmin, actin and titin, from calpains degradation, both stabilizing denaturing proteins and functioning as competitive inhibitors of the proteolytic enzymes (Lomiwes et al., Reference Lomiwes, Hurst, Dobbie, Frost, Hurst, Young and Farouk2014). Hsp27 is also an anti-apoptotic factor that promotes cell survival by cytochrome c sequestration and prevents activation of caspase 3 (Brad Kim et al., Reference Brad Kim, Ma, Setyabrata, Farouk, Lonergan, Huff-Lonergan and Hunt2018). Hsp70 and Hsp40 have been identified as being involved in suppression of apoptotic process, in protein folding and in the oxidative stress response by several authors, and Hsp70 is referred to be a good biomarker of low tenderness (Picard et al. Reference Picard, Gagaoua, Micol, Cassar-Malek, Hocquette and Terlouw2014). Based on these considerations, the higher expression of Hsp in older animals, could have led to a higher protection of muscular proteins, a lower degradation of myofibrils and then to a lower tenderness. The highest levels of Hsp expression in the Pu group are associated with the darkest grade of meat color. The association network (Figure 2) also confirms the negative correlation between the Pu group and the L* and b* parameters of the meat color. Working on cull cows, Gagaoua et al. (Reference Gagaoua, Couvreur, Le Bec, Aminot and Brigitte Picard2017) found that L* and b* parameters were negatively and, respectively, correlated with the expression of Hsp27 and Hsp70, likely because of their protein protection activity that affects muscle structure and light reflectance.
The multivariate analysis discriminated the experimental groups along the first component (31% of variance explained), mainly loaded on live weight gain, a* and mRNA abundance of Hsp. The Ch group was placed between the other two groups, providing a clear age trend especially for Hsp (Table 5, Figure 1, Figure 2). Moreover, the mRNA abundance of Hsp and the WBSF were positioned in the same quadrant indicating an association between them. Overcoming the individual variability, such association reached a statistical evidence in the difference between the average performance of pre-puberal and post-puberal groups. Indeed, the last one combined a higher mRNA and protein expression of Hsp with a greater hardness of the meat. The overexpression of small Hsp, with their anti-apoptotic properties and protective activity on myofibrillar proteins (Cassar-Malek and Picard, Reference Cassar-Malek and Picard2016), could have led to a tougher meat in older goats. The increase of Hsp with age could represent the physiological evolution of the resistance of animals to environmental stresses and could also be related to the hormonal changes that occurred during puberty and sexual maturation. Zhang et al. (Reference Zhang, Lee, Han, Kang, Lee, Baik and Choi2012) found that the mRNA expression of a member of the Hsp family was higher in bulls compared to steers and increase under testosterone addition, suggesting its involvement in muscular maintenance after sexual maturation. Indeed, the authors highlighted the capacity of Hsp, in response to androgen induction, to activate the androgen receptor in cells, leading to the transcription of genes associated with muscle development and, consequently, with meat characteristics.
The role of the calpain system, caspases and Hsp in muscle cell homeostasis and in muscle to meat conversion is complex and not yet fully understood. These processes need to be considerably clarified, especially in goats where no transcriptomic information about muscle development is available (Lin et al., Reference Lin, Zhu, Wang, Li and Lin2017).
In conclusion, Sk and Pu groups, characterized by a different tenderness of their meat, were clearly discriminated by a different expression of the Hsp. On the other hand, the lower expression of the Capn2/Cast ratio and caspases in younger goats could be due to the involvement of these genes in muscle development and myofibrillar turnover. From this point of view, further studies are needed.
Acknowledgements
The research was funded by the ERSA Agency (L.R. n. 8/2004) of the Friuli Venezia Giulia Autonomous Region and sponsored by the FSE ‘European Social Found’ of Friuli Venezia Giulia. The authors thank Dr Angela Sepulcri for fat analysis.
Declaration of interest
No potential conflicts of interest were reported by the authors.
Ethics statement
The trial was carried out in accordance with EU Directive 2010/63/EU for animal experiments. All experimental procedures and care of the animals complied with the Italian legislation on animal care (DL n. 26, 04/03/2014), adhered to the internal rules of University of Udine and were authorized by the Italian Ministry of Health (Ministerial Decree n. 284/2012-B, 7 December 2012). Management systems and data collected on goats were part of the routine care and periodical control. Animals were slaughtered and dressed using standard commercial techniques in an EU-licensed abattoir.
Software and data repository resources
None of the data presented in this manuscript were deposited in an official repository.
Supplementary material
To view supplementary material for this article, please visit https://doi.org/10.1017/S1751731119000405