The Great Reform Act of 1832 was a watershed in the development of democratic institutions in Great Britain and set in motion important economic and social reforms, including the reform of the Poor Laws, a new system of local government, the repeal of the Corn Laws, and the factory acts regulation of working hours.Footnote 1 In this article, we study what motivated the oligarchic elite to endorse democratic reform. We take advantage of the fact that the reform bill was debated and voted on in the British House of Commons by the Members of Parliament (henceforth MPs) elected under the rules of the Unreformed Parliament, as the British political system between the 1688 Glorious Revolution and 1832 is usually called. Specifically, we argue that the critical roll call vote that took place on 22 March 1831, when the draft bill had a second reading and was passed with a one-vote majority, is critical for understanding democratization in an oligarchy.Footnote 2 Arguably, a few additional votes against the bill could have stopped, or at least delayed, parliamentary reform and thus the economic reforms that followed, and it is therefore important, for historical reasons, to understand why this did not happen.
From a theoretical perspective, the vote record of the MPs enables us to evaluate the relative importance of three prominent theories which shape the debate related to the extension of the voting franchise during the nineteenth and early twentieth century in Western Europe (e.g., Rueschemeyer, Stephens, and Stephens Reference Rueschemeyer, Stephens and Stephens1992; Collier Reference Collier1999; Ziblatt Reference Ziblatt2006). The first is that democratization was the result of a “threat of revolution.” According to this view, the oligarchic elite that had a monopoly on political power saw little advantage in sharing this power with others. They only unwillingly conceded franchise extensions because they feared a revolution that would fundamentally overthrow the existing economic and political order; in other words, democratic reform was used to pre-empt a revolution. This theory has a long pedigree. It was George Macaulay Trevelyan (Reference Trevelyan1920)’s interpretation of the Great Reform Act of 1832 and the theoretical work by Daron Acemoglu and James A. Robinson (Reference Acemoglu and Robinson2000, Reference Acemoglu and Robinson2008) and Carles Boix (Reference Boix2003) has given it new prominence.Footnote 3
The second theory sees democratization as demand-driven and politicians as influenced by peaceful agitation, lobbying, and mass-mobilization in support of reform. Ben Ansell and David Samuels (Reference Ansell and Samuels2010, Reference Ansell and Samuels2014), for example, stress that the new economic interests created by the industrial revolution in the nineteenth century demanded protection from the state in the form of a broader suffrage. Valerie J. Bunce and Sharon L. Wolchik (Reference Bunce and Wolchik2006) and Erica Chenoweth and Maria J. Stephan (Reference Chenoweth and Stephan2009, Reference Chenoweth and Stephan2011) argue that non-violent mobilization was instrumental in bringing about democratization in several countries in South Asia, Eastern Europe, and Sub-Saharan Africa in the 1990s. The theoretical literature on informational lobbying (e.g., Grossman and Helpman Reference Grossman and Helpman2001) shows how agitation and costly mass-mobilization can convey credible information about the intensity with which special-interest groups care about an issue. This can, in turn, convince politicians who are unsure about the right course of action to change their position. In short, expressions of public opinion can sway politicians leading to democratization.
The third theory is that democratization was the result of political expedience or self-interest unrelated to any fear of revolution or agitation. Roger D. Congleton (Reference Congleton2007, Reference Congleton2011) emphasizes Pareto-improving constitutional bargaining between King and Parliament; Alessandro Lizzeri and Nicola Persico (Reference Lizzeri and Persico2004) emphasize that suffrage reform was used strategically by the elite to change the policy mix from particularistic spending to spending on public goods; Toke S. Aidt, Martin Daunton, and Jayasri Dutta (Reference Aidt, Daunton and Dutta2010) view suffrage reform as a Pareto-improving exchange of tax revenue for political influence; Humberto Llavador and Robert J. Oxoby (Reference Llavador and Oxoby2005) stress that co-opting some parts of the working class was beneficial to the oligarchic elite; and Gertrude Himmelfarb (Reference Himmelfarb1966) emphasizes party political advantage. The key idea underlying all these theories, however, is that it is in the self-interest of some part of the existing oligarchic elite to change the franchise rules.
The Great Reform Act is well-suited to evaluate the relative extent to which (1) threats of revolution, (2) expressions of public opinion, or (3) political expedience induced the members of the ruling oligarchy to democratize. First, the fundamental difficulty with any test of the threat of revolution theory is that the threat is, by its very nature, not directly observed. We get around this difficulty by directly quantifying the degree of actual violent unrest preceding the second reading of the reform bill and use that as a proxy for the perceived threat of revolution (see, Przeworski (Reference Przeworski2009); Aidt and Jensen (Reference Aidt and Jensen2014); Aidt and Franck (Reference Aidt and Franck2015) for a similar approach).Footnote 4 Between Prime Minister Charles Grey’s announcement of parliamentary reform in November 1830 and the Royal assent on 7 June 1832, England experienced high levels of social unrest which included a major violent rural uprising in the hinterland of London (known as the Swing riots) and violent confrontations between workers and police in many of the fast expanding industrial cities in the North of England and in London (Tilly Reference Tilly1995). Geographical dispersion in the intensity of violent unrest enables us to directly evaluate the effect of fears of revolution by comparing the votes of MPs elected in areas with high levels of violent unrest to those elected in areas with low levels. Second, during the same period, England not only experienced a rise in violent unrest, it also experienced a surge in public demand for democratic reform from civic society and special interest groups such as the Birmingham Political Union (Horn and Tilly Reference Horn and Tilly1988; Brock Reference Brock1973). This allows us to quantify the effect of peaceful mass mobilization through public meetings and demonstrations related to parliamentary reform in the areas where the MPs were elected on their vote on the bill. We also explore the fact that thousands of petitions related to the reform were presented to the House of Commons to measure lobbying for and against the reform and in that way quantify the role of lobbying on the vote of the MPs elected in the constituencies which petitioned. Third, we can directly evaluate the extent of self-interested voting because the bill’s two main features—redistribution of seats and reform of the suffrage rules—allow us, when combined with detailed bibliographic information, to predict whether a MP would personally benefit or lose from the bill. In particular, the appendices to the draft bill listed the constituencies to be disenfranchised (in other words, to lose the right to elect MPs) and the places, mainly the expanding industry cities in the Midlands and in the North of England, that were to gain representation. Moreover, the bill changed the voting franchise in the counties in favor of the landowners. These features allow us to measure the geography of expected gains and losses, and in that way, test for political expedience in the voting behavior of the MPs.Footnote 5
The results of our econometric analysis show that conditional on party affiliation, the MPs’ votes were influenced by violent social unrest in urban (but not rural) areas, by peaceful agitation and expressions of mass-support for reform and were also motivated by political expedience. A “horse race” between the competing theories suggests that petitions and public agitation related to the reform were more important than fears of revolution created by exposure to violent urban unrest. Since the bill passed with a one-vote majority, two additional nays were all that was needed to block the bill. Our estimates enable us to evaluate counterfactual experiments to see if violent urban unrest, reform agitation, and political expedience were substantive enough to switch at least two votes. We find that this was the case.
Our article is related to a growing literature that demonstrates the value of moving away from comparative analysis of the causes of democratization at the macroeconomic level (such as Gundlach and Paldam Reference Gundlach and Paldam2009; Dincecco, Federico, and Vindigni Reference Dincecco, Federico and Vindigni2011; Aidt and Jensen Reference Aidt and Jensen2017) towards detailed quantitative analysis of particular episodes of democratization at the microeconomic level (such as Capoccia and Ziblatt Reference Capoccia and Ziblatt2010; Berlinski and Dewan Reference Berlinski and Dewan2011). Within this new literature, our analysis is most directly related to Aidt and Raphaël Franck (Reference Aidt and Franck2013, Reference Aidt and Franck2015) and Aditya Dasgupta and Daniel Ziblatt (Reference Dasgupta and Ziblatt2015) who test the threat of revolution theory in relation to the Great Reform Act of 1832. Aidt and Franck (Reference Aidt and Franck2013) explore that a sequence of reform-related roll call votes, including the critical second reading on 22 March, took place in the House of Commons in 1831. Since the intensity of violent unrest also varied across this period, it is possible to evaluate the effect of fears of revolution on the voting behaviour of the MPs. They find suggestive evidence that the threat of revolution affected the pro-reform Whigs but had no effect on the opposition coming from the Tory party. Aidt and Franck (Reference Aidt and Franck2015) study the general election in April–June 1831, exploiting the political geography of the Unreformed Parliament to link the election result to the degree of social violence observed in the immediate vicinity of each constituency during the Captain Swing riots in the winter of 1830–1831. They find, consistent with the threat of revolution theory, that exposure to local riots had a large causal effect on the likelihood that a pro-reform Whig MP was elected. Dasgupta and Ziblatt (Reference Dasgupta and Ziblatt2015) study the reaction of the British sovereign bond market to the social unrest that preceded the 1832 reform and show that the yield increased in the run-up to the reform but fell back immediately after it was passed. They interpret this as evidence in favour of the threat of revolution theory. Our study goes beyond this previous research by systematically evaluating three theories of democratization (including the threat of revolution theory) in relation to the critical second reading of the reform bill. Substantively, we add to the literature by showing that reform agitation and political expedience were important drivers of reform, and that the threat of revolution played a lesser role in securing a majority in favor of reform in March 1831.
VOTING ON THE GREAT REFORM ACT: BACKGROUND AND HYPOTHESES
Parliamentary Reform in Britain
Despite the relocation of economic activity and internal migration, the new economic centers in the North and in the Midlands had no representation in 1830, many constituencies established in the Middles Ages were largely depopulated, and a very small proportion of the population had the right to vote (Brock Reference Brock1973, Ch. 1).Footnote 6 Indeed, the rules for elections to the House of Commons had not fundamentally changed in nearly 200 years.
The 489 English MPs were elected to the Unreformed House of Commons from 244 constituencies (Fischer Reference Fisher2009). The 41 English counties returned two to four MPs on a property-value qualified franchise while the borough constituencies (which were predominantly located in rural market towns) could, typically, return two MPs as did the graduates of the universities in Cambridge and Oxford. In the so-called “rotten” boroughs, patrons, who were typically large local landowners, nominated the MPs.Footnote 7
The MPs received no salary and election was subject to a high property qualification. This prevented individuals from the lower classes from running and the House of Commons was dominated by men of substantial wealth, mostly landowners or their sons, merchants, and industrialists. In addition to their main place of residence, which for the landed gentry would be a country estate and for merchants and industrialists would be in one of the larger provincial towns in the area where they were elected, most MPs had a residence in London. There was no requirement that a MP lived in the constituency in which he was elected and most did not, especially not if elected in a small rural (borough) constituency.
The MPs formed political groups in the House of Commons. The Whig and Tory parties made up the dominant factions, with a few Radical MPs elected in London and the larger provincial constituencies (in 1830). However, these factions were not political parties in the modern sense. They were factions with parliamentary leaders, core followers and regular supporters. They were sufficiently organized to hold meetings as well as to organize their own patronage networks and party finance but crucially, party discipline remained imperfect, even on seemingly core issues such as Catholic emancipation or parliamentary reform (Machin Reference Machin1964; Mitchell Reference Mitchell1967, Ch. 1; Hill Reference Hill1996; Jupp Reference Jupp1998). This meant that the MPs had a large degree of freedom to determine how they would vote on particular bills.Footnote 8
Some attempts at parliamentary reform had been made from the 1780s onwards, notably in the 1820s by John Russell, Charles Grey, and other leading Whig politicians, to address the uneven geographical distribution of seats, electoral corruption, and the limited voting franchise, but without success (Cannon Reference Cannon1973, Ch. 7) until the Great Reform Act of 1832. The bill had two main pillars. First, it changed the suffrage rules by standardizing the franchise. All male householders in the borough constituencies who occupied property worth £10 a year were given the vote while voting rights in the county constituencies were extended to copyholders of land and to various groups of tenant farmers (see Evans (Reference Evans2000, Appendix I) for details). Second, the bill redistributed seats from the small “rotten” boroughs to the large and growing industrial cities and to the counties. The immediate consequences of the reform were limited to redistribution of parliamentary seats, to a modest extension of the franchise to “respectable” segments of the middle class, and to the introduction of a uniform set of suffrage rules based on property. However, in the broader historical perspective, it must be viewed as a watershed that set in motion a long process of political and economic reforms (Maehl Reference Maehl1967, p. 1).
The reform process started with the 1830 general election. The Tories, who had been in power since 1807 and who had opposed any attempt at parliamentary reform, could not agree on a new prime minister. This gave the Whigs, led by Charles Grey, an opportunity to form a government and to put the reform question on the agenda. Grey made his intentions clear in the House of Lords in November 1830, a few days after having been appointed prime minister:
“The principal of my reform is to prevent the necessity of revolution…. The principle on which I mean to act is neither more nor less than that of reforming to preserve, and not to overthrow” (Hansard HL Deb 22 November 1830, vol. 1, c613).
The bill’s journey through the political process was, however, far from smooth and it could have failed at a number of hurdles along the way. Formally, as a piece of legislation sponsored by the government (a public bill), the legislative process started with a member of the government presenting the bill in the House of Commons where it was first read which was usually a matter of routine and rarely required a formal vote (Escott Reference Escott and Fisher2009). The bill was then printed to enable the MPs to consider its general principle. The critical junction was the vote after the second reading in the House. If the bill obtained a majority of votes after the second reading debate, it went into a committee, for scrutiny clause by clause. For important public bills, such as the reform bill, this took place in a committee of the whole House. The bill with majority-supported amendments would then be returned to the House of Commons for general debate and a third reading, where further amendments could be made, before it was sent to the House of Lords. The Lords might vote for the bill without any modification and ask for royal assent, reject it, or modify it and send it back to the House of Commons.
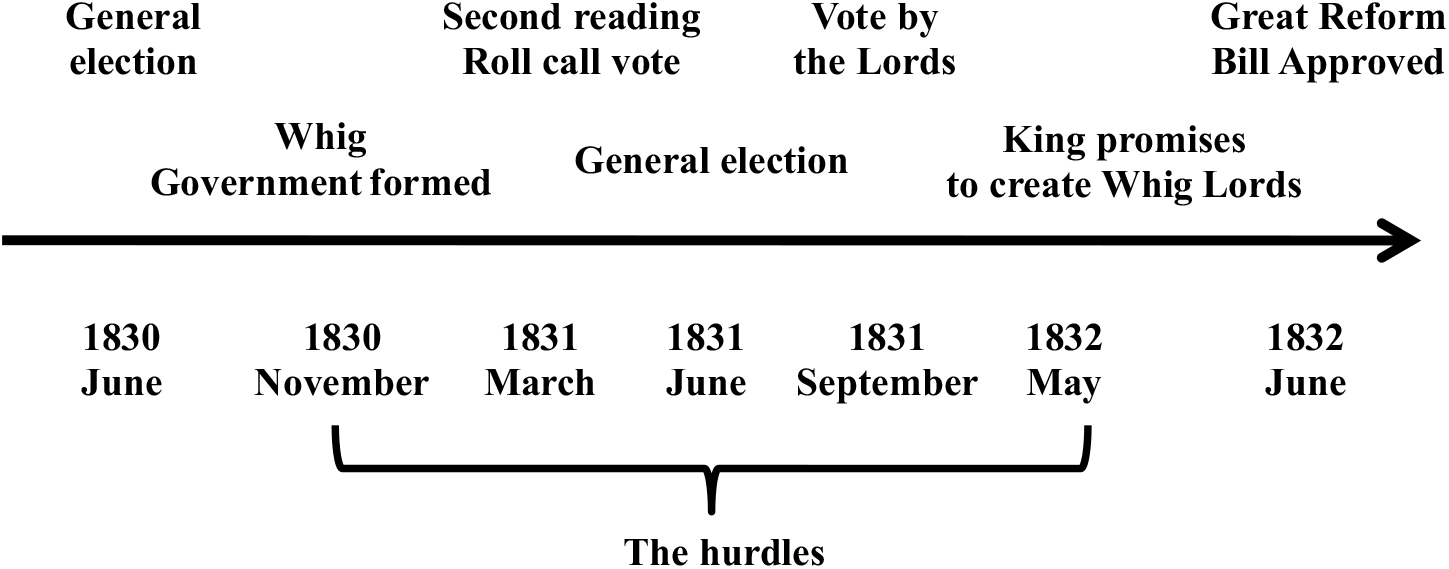
In Figure 1, we present a timeline of the main events related to the reform bill based on Michael Brock (Reference Brock1973). The first major hurdle was the second reading of the bill in the House of Commons on 22 March 1831 where it was approved in a 3 am vote by the slightest of majorities: 302 in favor and 301 against. Prime Minister Grey was keenly aware that a one-vote majority was not sufficient to get the bill through the committee stage and the House of Lords without major concessions and he asked the King to dissolve parliament. The general election in April–June 1831 was the second hurdle and effectively became a referendum on parliamentary reform. Many anti-reform Tories were not returned and the election result gave the pro-reform Whigs the majority they needed to pursue the reform. In particular, in the 513 English and Welsh seats, the number of Whigs and Radicals increased from 220 to 289. In the three subsequent votes in the House of Commons in July, September, and December, the bill was supported by large majorities (Aidt and Franck Reference Aidt and Franck2013, Table 3). The third hurdle occurred in September 1831 when the House of Lords rejected the bill and sent it back to the House of Commons. After the second reading of a revised bill on 17 December 1831, where some concessions to the Lords were made, a frantic period of lobbying of individual Lords followed until the House of Lords approved the bill by a nine-vote-majority in April 1832. Again, this was insufficient to get the bill through the committees, and Grey offered his resignation if the King did not promise to create enough new Lords, if needed, to carry the bill. The King eventually made that promise and the bill passed as the Tory opposition did not wish to risk losing their majority in the House of Lords. The bill received royal assent on 7 June 1832. These hurdles were not only significant but the way each of them was overcome can also provide important insights into the mechanisms of democratization. In this study, we focus on the first hurdle, in other words, the second reading of the bill in the House of Commons, while Aidt and Franck (Reference Aidt and Franck2015) study the second hurdle, in other words, the election in 1831.
THE TIMELINE OF THE MAIN EVENTS AS THE BILL PASSES THROUGH THE POLITICAL PROCESS

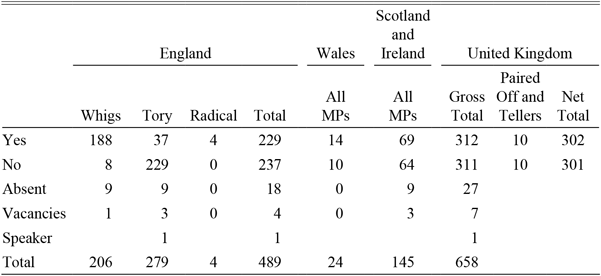
Out of the 658 MPs elected to the House of Commons from across the United Kingdom, only 27 (including 18 from England) were not present for the second reading on 22 March 1831, with a further seven seats unfilled on the day. This was an abnormally large turnout. The net result, after 20 MPs including the four Tellers were paired off and the Speaker of the House followed tradition and abstained, was a one-vote majority (302 vs. 301). Table 1 shows for the English seats the breakdown of the vote for the Tories, Whigs, and the four Radical MPs, along with the vote totals for Wales, Scotland, and Ireland. The majority of the 489 English MPs and of the 45 Scottish MPs voted against the bill while the majority of the 100 Irish and of the 24 Welsh MPs supported it. The opposition in England came almost exclusively from the Tories while the Radical MPs and the vast majority of the Whigs voted in favor. However, party discipline was imperfect: the 45 MPs who deviated from the party line were critical for the bill’s success.
THE BREAKDOWN OF THE ROLL CALL VOTE IN THE HOUSE OF COMMONS 22 MARCH 1831, ON THE SECOND READING OF THE REFORM BILL

Note: The category “absent” includes the MPs who could have been present but were not. The category “vacancies” refers to seats where a by-election was due. The seats were Evenham (both seats vacant due to bribery), Colchester (one ineligible elected) and Durham City (one ineligible elected), Nairnshire in Scotland (vacated), and Clare (one ineligible elected) and Londonderry (one ineligible elected) in Ireland. The party affiliation refers to the MPs elected in 1830. The Speaker (a Tory, elected in Scarborough) abstained. Eight MPs were paired off and two MPs were appointed Tellers on each side of the issue.
Source: Hansard (1831, vol. 2, pp. 719–826) contains the division list reporting all votes cast. The party affiliations of the English MPs are constructed from information in Dod and Dod (1832), Namier and Brooke (Reference Namier and Brooke1964), Stooks Smith (Reference Stooks Smith1973), Thorne (Reference Thorne1986), and Fisher (Reference Fisher2009).
Social Tension in 1830-1831
In the years that preceded the royal assent of the Great Reform Act, social tension was high in Britain and took many forms. Some of the protest was organized, peaceful, and directed at the question of parliamentary reform, but some of it was violent and not, in most cases, directly related to parliamentary reform. Those differences could not have eluded the MPs who read newspapers, communicated with associates in their constituencies and, in some cases, had access to Home Office reports. Before laying out our hypotheses in the next sub-section, we provide a typology of protests during the period.
Social unrest and mass protest in Great Britain reached very high levels in the early 1830s (Stevenson Reference Stevenson1992; Bohstedt Reference Bohstedt2010). Charles Tilly (Reference Tilly1995, p. 97 and Table 2.2) estimates that at least 91 individuals were killed, more than 2,000 arrested and several million individuals were involved in various types of public protest. Some unrest was violent and had to be put down by force. We make a distinction between violent unrest in rural and urban areas. The largest wave of rural violent unrest was the Swing riots that took place between August 1830 and March 1831 when landless agricultural laborers in London’s hinterland burned hayricks, smashed threshing machines, and demanded higher wages (Hobsbawm and Rudé Reference Hobsbawm and Rudé1973). Urban violent unrest included instances of violent street confrontations, for example, in Derby in 1830 and in Bristol in 1831, as well as turbulent strikes, for example, in Barnsley, Bethnal Green, Coventry, Manchester, and Spitalfields in 1829 (Tilly Reference Tilly1995). Such major events were widely reported in the local and national newspapers, but even what appears in hindsight to be some instance of minor street violence would be known to the MPs. For instance, the Morning Chronicle and the The Times reported in the 10 November 1830 edition that after a meeting near radical activist Richard Carlisle’s ramshackle building (the Blackfriars Rotunda) on 9 November 1830, about 1,000–1,500 people confronted a detachment of the police with cries of “Down with the police!,” “No Wellington,” and “No Peel!” Home Secretary Robert Peel described it in the House of Commons as “some unpleasant collisions between the police and the mob at Temple Bar, and other parts of the Strand” (Mirror of Parliament, 10 November 1830, cited by Tilly (Reference Tilly1995, p.314)). Hallmarks of violent unrest during the period were that it, on the one hand, was not (in most cases) related to parliamentary reform but to a variety of special economic and social demands and that it, on the other, helped steer up fears of a revolution.
However, most of the protest was peaceful expressions of public opinion. Partly due to less blatant government repression of organizations in the late 1820s, urban political associations, such as the Birmingham Political Union or the National Association for the Protection of the Workers, had become sufficiently organized to mobilize peaceful mass protest (Thompson Reference Thompson1963, Ch. 14). In the lead-up to the roll call vote in March 1831, they organized public meetings in support of the reform which, on occasion, attracted thousands of participants. In other instances, freeholders, parishioners or religious congregations met publicly to express their views on the reform question (Tilly Reference Tilly1995, Table 7.3). These events were announced in the local newspapers and often reported in the London-based national newspapers after the fact. For instance, a large peaceful demonstration in favor of reform was held in London on 12 October 1831. The following day, the Morning Chronicle described it as “about 300,000 inhabitants of the metropolis—chiefly tradespeople and industrial artisans, with the Parochial Officers at their head—walked in procession from their respective parishes to St. James’s Palace” (Tilly Reference Tilly1995, p. 329). Unlike violent unrest, much of the peaceful protest that took place during the period was directly linked to agitation for or against parliamentary reform.
Individuals, groups, or organizations could also petition Parliament directly (Jupp Reference Jupp1998). According to the record in the Journals of the House of Commons, more than 3,000 petitions related to parliamentary reform were received between November 1830 and June 1832. These petitions were addressed to particular MPs and presented in Parliament. Some of them were signed by thousands of people, such as one received by the MP John Savile Lumley in March 1831 from “2500 most respectable persons” (Hansard HC Deb 22 March 1831, vol. 3, c705) among the freeholders of the county of Nottingham petitioning in favor of the reform. Others represented the view of smaller and more select groups such as the petition from the University of Cambridge against the reform (Hansard HC Deb 22 March 1831, vol. 3, c706). The petition system allowed organized groups outside the ruling elite to lobby by making their views on the reform question known directly to the MPs.
Hypotheses
The second reading of the Great Reform Act of 1832 provides a unique opportunity for testing three competing theories of democratization within a common framework. The first theory maintains that autocratic politicians accept democratic reform because they fear a revolution. The Whig school of Victorian historians (e.g., McCarthy Reference McCarthy1852; Trevelyan Reference Trevelyan1920, Reference Trevelyan1937, pp. 635–36) emphasized this theory in relation to the Great Reform Act and the threat of revolution is central to Acemoglu and Robinson (Reference Acemoglu and Robinson2000, Reference Acemoglu and Robinson2006)’s theory of franchise extension. How threatening the MPs perceived the situation to be was a function of the actual level of violent unrest that came to their attention during the period before the second reading. The MPs would learn about violent unrest in the areas where they were elected through their networks of contacts or through direct observation, and would learn about major events across the country through the national newspapers. To a first approximation, the MPs had access to the same nation-wide information on violence, so the variation is their perception of the threat would primarily come from variation in violent unrest in their “local” area. We can formulate this as the first testable hypothesis:
The Threat of Revolution Hypothesis:
MPs who were elected in areas exposed to violent unrest perceived a greater threat of revolution and were more likely to vote in favor of the reform.
The literature on informational lobbying and persuasion, for example, David Austen-Smith (Reference Austen-Smith1994), Susanne Lohmann (Reference Lohmann1995), Gene M. Grossman and Elhanan Helpman (Reference Grossman and Helpman2001), Morten Bennedsen and Sven E. Feldmann (Reference Bennedsen and Feldmann2006), shows how interest groups, by sending costly signals through, for example, large demonstrations or petitions, can convey credible information about the intensity with which they care about an issue.Footnote 9 Insofar as the policymakers are uncertain about the merits of a particular reform, they may in that way be influenced by agitation and lobbying and change their mind. This second theory of political reform argues that MPs who were unsure about the value of reform would take a clue from public expressions of reform support or targeted petitions related to the reform question. The key difference between the violent unrest that fuels fears of a revolution and peaceful reform agitation (besides the fact that one is violent and the other is peaceful) is that threat perceptions are governed by observations of violent unrest, whether directly related to the reform question or not, while reform agitation must be related directly to the reform question and thus must be specific. We can thus formulate the second testable hypothesis as
The Public Opinion Hypothesis:
MPs who were elected in areas with large-scale public demonstrations of reform support or who were lobbied by reform-supporting constituency interest groups were more likely to vote in favor of the reform.
The third theory maintains that politicians implement major political reforms because they expect to benefit, politically and/or personally, from the new constitutional framework and the new policies that it enables. For the elite or subsets thereof, the prospective gain from reform might be expected changes in post-reform policy (e.g., Lizzeri and Persico Reference Lizzeri and Persico2004; Llavador and Oxoby Reference Llavador and Oxoby2005; Aidt, Daunton, and Dutta Reference Aidt, Daunton and Dutta2010) or in electoral support (e.g., Himmelfarb Reference Himmelfarb1966). However, for individual politicians, the most immediate consideration relates to their chances of keeping their seat under the new rules. We formulate this as the third testable hypothesis:
The Political Expedience Hypothesis:
The MPs followed their own narrow self-interest and voted against (for) the bill if they expected that the proposed allocation of seats or the new voting rules would make is harder (easier) for them to gain election.
DATA
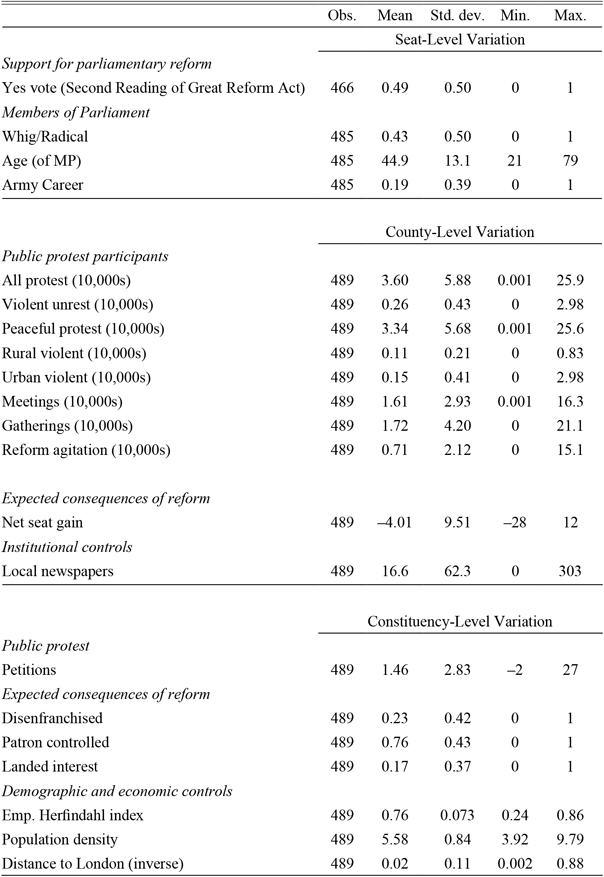
We draw our data from a variety of primary and secondary sources. The unit of analysis of the main cross-sectional dataset is a parliamentary seat in the House of Commons during the session which lasted from 26 October 1830 to 22 April 1831. Table 2 provides descriptive statistics for the variables used in the main analysis. The full dataset is deposited with the variables used in the main analysis. The full dataset is deposited with the Inter-university Consortium for Political and Social Research (Aidt and Franck Reference Aidt and Franck2019).
DESCRIPTIVE STATISTICS FOR THE VARIABLES USED IN THE MAIN ANALYSIS

Note: The sample is restricted to the 489 English seats. The statistics for the MPs exclude the four unrepresented seats.
Source: Definitions and sources of the variables are provided in the text and in Online Appendix A10.
We note that 658 MPs were elected in constituencies in Scotland, Ireland, Wales, and England. However, we do not include the Scottish or Irish MPs in the analysis because we do not have data on social unrest and mass mobilization in Scotland and Ireland. In fact, the Great Reform Act did not affect Scotland or Ireland. In the subsequent Scottish Reform Act and Irish Reform Act, however, Scotland obtained eight additional seats and Ireland obtained five. No constituency was disenfranchised in either Scotland or Ireland. As in England and Wales, voter qualifications were standardized and the electorate was expanded (see Evans Reference Evans2000, Appendix I).
Reform Support in the House of Commons
Our main analysis relates to the 489 English MPs elected in 244 constituencies,Footnote 10 466 of whom were present and voted on 22 March 1831 (9 Tories and 9 Whigs were absent, four English seats were vacant and the speaker, traditionally, abstained). For each of these 466 English MPs, we create the variable yes vote which is equal to one if the MP supported the bill and equal to zero if he voted no (excluding the Speaker). For the sample of the 489 English seats, we also create the variable present which is equal to one if the MP elected to a seat was present in the House of Commons for the vote and zero if not (excluding the four vacant English seats and the Speaker).Footnote 11 In the statistical analysis presented later, we discuss reasons which might explain the absence of the 18 MPs from the second reading of the bill and we also extend the sample with the 24 Welsh MPs, who all attended the vote.
Public Opinion and the Threat of Revolution
To test the Public Opinion Hypothesis, we need to quantify the MPs’ exposure to public opinion, agitation, and mass mobilization. We draw on two sources to do this. First, we construct a new constituency-level measure of lobbying from primary sources. As we noted earlier, it was common for constituency-based lobby groups to send petitions to Parliament either in support of or in opposition to specific bills or issues. These petitions are recorded in the Journals of the House of Commons (1828–1831, vol. 83–86). Based on word searches on the names of the 244 English constituencies, we count the number of petitions related to the reform campaign which originated from each constituency between 1 January 1828 and 22 March 1831.Footnote 12 We code the variable petitions as the difference between the number of petitions for and against parliamentary reform. This measures constituency-level lobbying in favor of reform and enables us to test if the MPs were influenced by the views of the people living in the constituencies in which they were elected. Second, to quantify the broader patterns of agitation and mass mobilization, we draw on the studies of Nancy Horn and Tilly (Reference Horn and Tilly1988) and Tilly (Reference Tilly1995) who collected information on various forms of “popular protest” in England between 1828 and 1834 from textual analysis of eight London-based periodicals (Annual Register, Gentleman’s Magazine, Hansard’s Parliamentary Debates, London Chronicle, Mirror of Parliament, Morning Chronicle, The Times and Votes and Proceedings of Parliament). Tilly (Reference Tilly1995, p. 63) defines “popular protest” as an event where “10 or more people gather in a publicly accessible place and make claims on other people, including holders of power, claims which if realized would affect the interests of their object.” Each event is characterized by several elements describing date and location (usually, the county), an estimate of the number of people involved, who was making the claim, and against whom the claim was directed. We use three types of peaceful protest that happened between 1 January 1828 and 22 March 1831 as proxies for agitation and mass mobilization. Meetings involved organized events where a group of individuals congregated with prior notice, while gatherings were more spontaneous and included street protests of various sorts, including demonstrations, which remained peaceful and non-violent.Footnote 13 While meetings and gatherings enable us to study different types of peaceful protest, some of these meetings and gatherings were not related to the reform question. Our third and main proxy reform agitation uses the classification of Horn and Tilly (Reference Horn and Tilly1988) to single out the subset of peaceful meetings and gatherings which were related to the reform question.Footnote 14 This provides us with a direct measure of reform agitation.
To test the Threat of Revolution Hypothesis, we also draw on Horn and Tilly (Reference Horn and Tilly1988). We single out the events between 1 January 1828 and 22 March 1831 that involved violent unrest which we contend can be used as a proxy for the MPs’ perceptions of the threat of revolution. We further sub-divide violent unrest into unrest that took place in rural (rural violent) and urban (urban violent) areas.Footnote 15 Violent unrest in urban areas might have been perceived as being more threatening than unrest in the countryside (Do and Campante Reference Do and Campante2009).
Over the period from 1 January 1828 to 22 March 1831, Horn and Tilly (Reference Horn and Tilly1988) record 2,726 protest events.Footnote 16 For many of the events, they give an estimate of the number of individuals involved and for each type of protest, we calculate the number of individuals involved in the events in each county. It is important to consider, as a small protest (e.g., a meeting) with 10 individuals involved would have been perceived very differently from a large public demonstration with thousands of participants, such as the reform support meeting in Manchester on 8 March 1831, which according to the The Times was attended by 3,000 people.Footnote 17 We consider that each MP was influenced by the scale of the events which occurred in the county where his constituency was located. This is reasonable because counties were natural information hubs for the constituencies and each county had a newspaper which reported local news and those from London (see the discussion of newspaper circulation).Footnote 18 For each type of protest, we thus attribute to each constituency the total number of participants in public protest events which occurred in its county. We define the variable all protest as the aggregate of all types of protest. While we use the number of participants in protests (in 10,000s) in the main analysis, we show in Table A1 in the Online Appendix that normalizing this number by the total population or by the number of adult males does not affect the results. We also report in Table A2 in the Online Appendix a replication of the results with the protest variables coded by summing up the number of events by county, irrespective of the number of people involved.
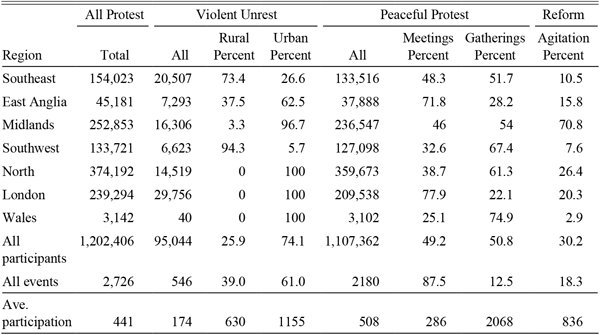
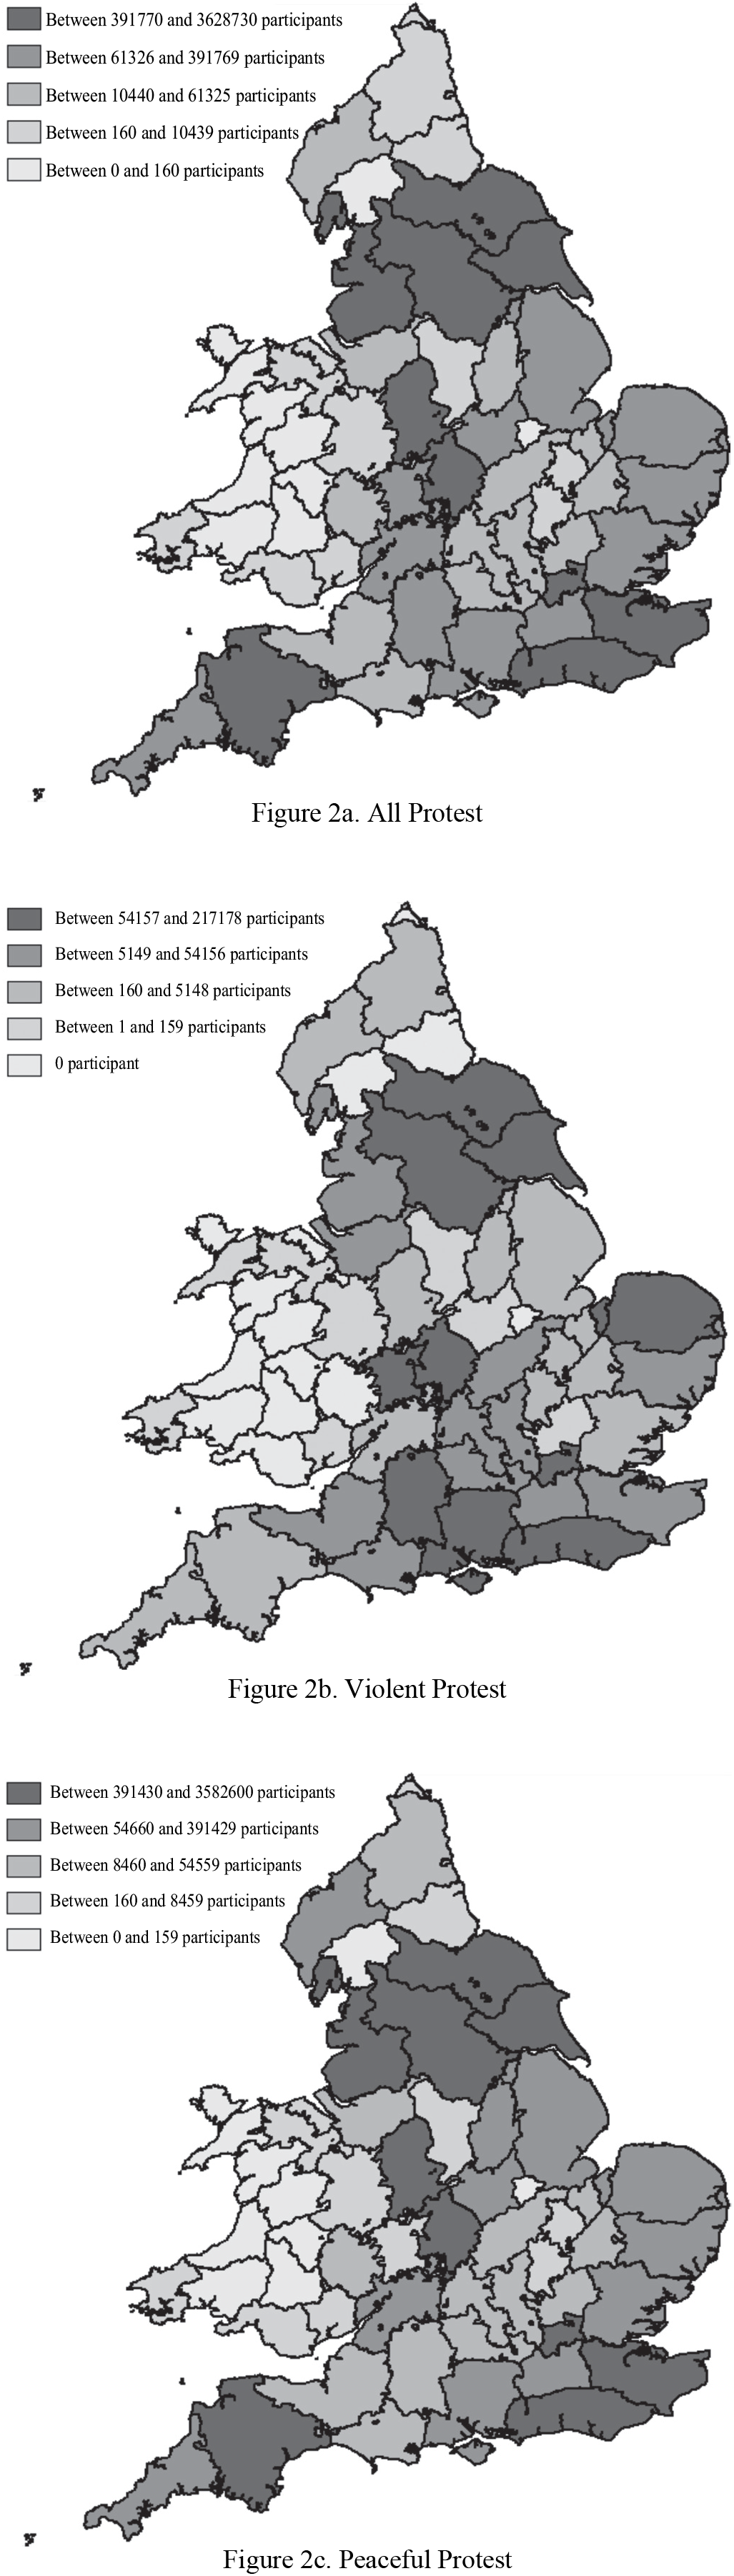
In Table 3, we list the distribution of public protests recorded between 1 January 1828 and 22 March 1831, classified by the type of protest and disaggregated within the six main regions of England and Wales. Most of the protest was peaceful, but 20 percent of the events did involve violence. The average number of participants was 441. Violent events in rural areas involved fewer individuals than violent events in urban areas. While there were many more meetings than gatherings, gatherings had much larger average participation (2,068 compared to 286). Reform supporting meetings and gatherings constituted 18.3 percent of all peaceful protest with participation of 30.2 percent of all individuals involved in these activities. In Figure 2a, we map the geographical distribution of participants in all types of protest across England by county, and further distinguish between peaceful protest and violent unrest in Figures 2b and 2c.Footnote 19 Peaceful protests took place in the industrial towns in the North and Midlands and in and around London. Violent protest was concentrated in the hinterland of London (mostly rural unrest) and in the North of England (mostly urban unrest).
THE NUMBER OF PARTICIPANTS INVOLVED IN DIFFERENT TYPES OF PROTEST BY MAJOR REGIONS, 1 JANUARY 1828–22 MARCH 1831

Note: Southeast includes Berkshire, Buckinghamshire, Hampshire, Kent, Oxfordshire, Surrey, and Sussex; Southwest includes Cornwall, Devon, Dorset, Gloucestershire, Somerset, Wiltshire, and Monmouthshire; East Anglia includes Bedfordshire, Cambridgeshire, Essex, Hertfordshire, Huntingdonshire, Norfolk and Suffolk; Midlands includes Derbyshire, Herefordshire, Leicestershire, Lincolnshire, Northamptonshire, Nottinghamshire, Rutland, Salop, Staffordshire, Warwickshire, and Worcestershire; North includes Cheshire, Cumberland, Durham, Lancashire, Northumberland, Westmorland, and Yorkshire; London includes the City of London, Westminster, and Middlesex; Wales includes all the counties of Wales. All protest is equal to violent unrest plus peaceful protest; meetings and gatherings sum to peaceful protest and rural and urban violent sum to violent unrest. Reform agitation is reform-related peaceful events (and expressed in percentage of peaceful protest). All events record the number of protest events and ave. participation is the number of participants per protest. The number of participants involved in the protest is calculated from Horn and Tilly (Reference Horn and Tilly1988)’s best estimate and for those protests where they do not have an estimate, we assume that 10 people were involved (this is the cut-off for being included in their database).
Source: Horn and Tilly (Reference Horn and Tilly1988).
PUBLIC PROTEST IN ENGLISH AND WELSH COUNTIES BY NUMBER OF PARTICIPANTS, 1 JANUARY 1828–1822 MARCH 1831

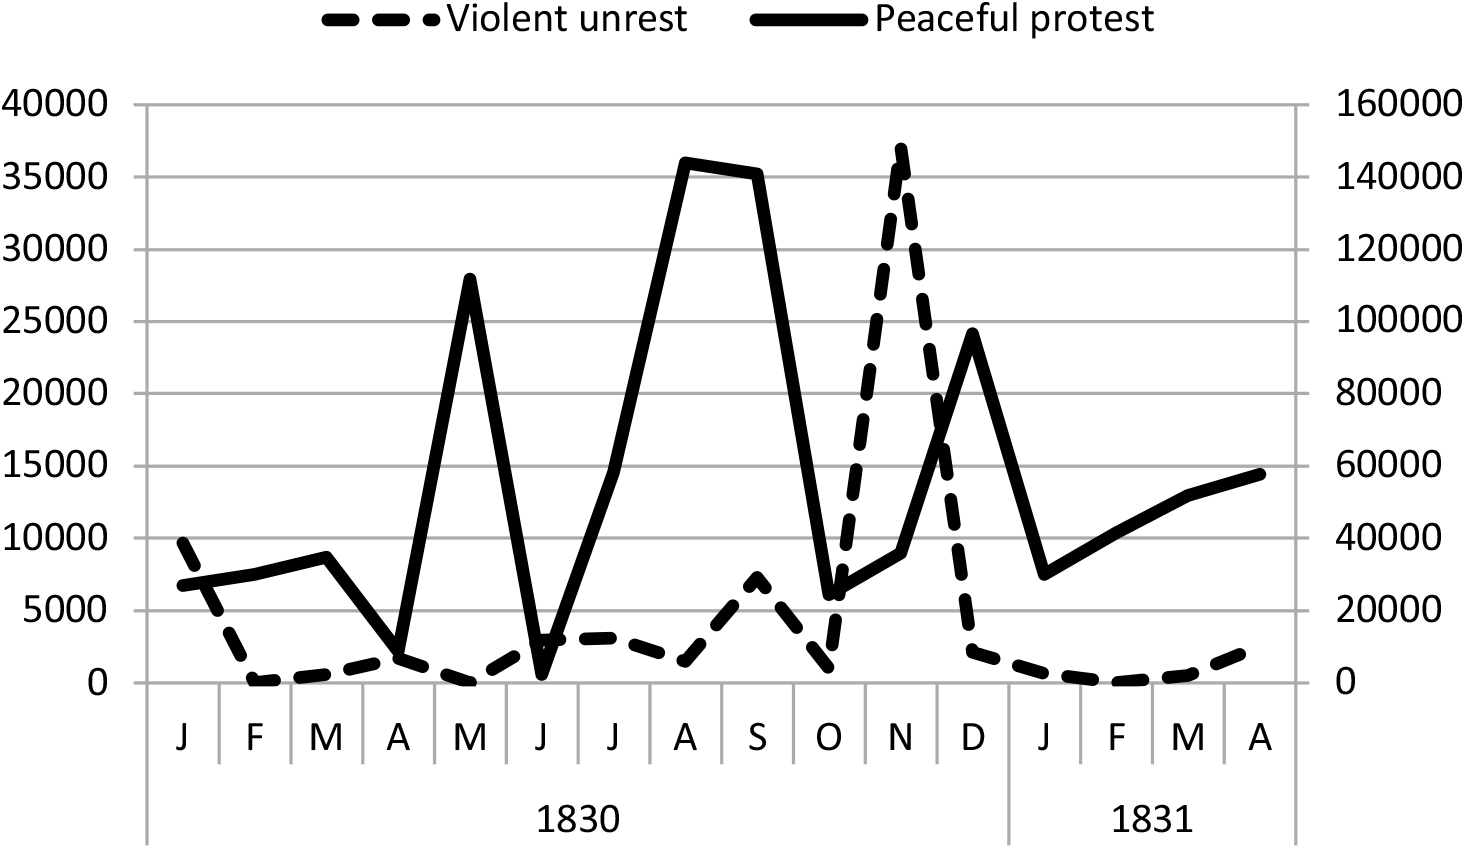
Figure 3 plots the monthly series of participation in peaceful protest (measured on the right-hand y-axis) and violent unrest (measured on the left-hand y-axis) in England between 1 January 1830 and 1 April 1831. We note that the number of peaceful protests grew in the period leading up to the vote on the reform bill. The peak in May 1830 was a large meeting with more than 100,000 participants in Warwickshire and the high level of protest during the summer corresponds to the polling period of the 1830 general election. Violent protests were more concentrated in time. The spike in violence, which occurred in November and December 1830, corresponds to the peak of the violent riots instigated by landless agricultural laborers (the Swing riots).
VIOLENT UNREST AND PEACEFUL PROTEST, 1830-1831

Political Expedience
To test the Political Expedience Hypothesis, the details of the draft bill enable us to identify prospective winners and losers. Obviously, the MPs elected in the constituencies which were scheduled to be disenfranchised had a personal reason to vote against the bill. We code the indicator variable disenfranchised as equal to one if the constituency that a MP represented was scheduled in the draft bill to lose all seats and zero otherwise.
Patronage played an important role in the Unreformed Parliament. The MPs elected in the borough constituencies controlled by patrons might have been under pressure to oppose reform because the new rules would undermine the old system of patronage even if the constituency continued to exist. Based on the contextual information about each constituency provided by J. Holladay Philbin (Reference Philbin1965) and the complete record of contested and uncontested elections provided by John A. Cannon (Reference Cannon1973), we construct the variable patron controlled, which is coded as one if the constituency was under full or partial control of a local patron or by the Treasury or if no contested election had taken place since 1802, and zero otherwise. Out of the 244 English constituencies, 188 were controlled by patrons.Footnote 20 While the patrons controlled who represented the constituencies, they did not necessarily control how the selected MPs voted on each piece of legislation, but could certainly exert pressure on specific votes, for example, by threatening not to select the MP at the next election, and had a strong incentive to do so with regard to the reform bill.Footnote 21
The reform bill was a threat to the political influence of the landed elite by redistributing seats from the small “rotten” borough constituencies in the countryside to the expanding industrial cities in the North of England and in the Midlands. At the same time, the draft bill sought to extend the existing voting franchise in the counties to include £10 copyholders and various types of leaseholders and increased the number of county seats from 80 to 144. These new voters owed their livelihood to the local landlords and their vote could be influenced by the landed elite. As such, this franchise extension was seen as an attempt to compensate the landed interest for the loss of their influence in the disenfranchised rural boroughs (Brock Reference Brock1973, p. 222). We code the indicator variable landed interest as one if a MP was elected to a county seat and zero if he was elected to either a borough or to one of the university seats.
As a more general measure of the expected benefit of seat redistribution, we construct the variable net seat gain. It codes the difference between the number of seats allocated to each county and to the borough constituencies located within its borders by the reform and the number of seats in the Unreformed Parliament.Footnote 22 MPs elected in a particular county would have a ready-made network of supporters in that area enabling them to take advantage of the new seats to be established post reform. This variable, therefore, measures the extent to which the MPs supported (opposed) the reform because of seat gains (losses) in “their” county.
Political and Economic Control Variables
POLITICAL PARTIES
As noted earlier, “party affiliation” is a strong predictor of how a MP voted. The reform bill was sponsored by the Whig leadership and supported by most Whig MPs (only eight English Whig MPs voted against). It was strongly opposed by the Tory leadership and most backbench Tories, yet 37 English Tory MPs voted for the bill (see Table 1). This reflected the fundamental disagreement about the role of MPs as “trustees,” who saw it as their role to act as they thought to be in the national or wider public interest, or “delegates,” who should act in accordance to the demands of their constituents or broader special interests (see the discussion in the Online Appendix) as well as about the role of landownership as the core constitutional principle. We need to control for “party affiliation” so that our tests can isolate the influence of public opinion, political expedience, and threat of revolution on the 45 MPs who voted against the “party line” and whose votes were pivotal.
It is not a straightforward task to determine the political affiliation of the MPs. The Tory and Whig groups were relatively loose organizations and some MPs changed their allegiance over their political careers. We evaluated and compared the bibliographical information provided by Charles R. Dod and Robert Phipps Dod (1832), Lewis B. Namier and John Brooke (Reference Namier and Brooke1964), Henry Stooks Smith (Reference Stooks Smith1973), R.G. Thorne (Reference Thorne1986), and David Fisher (Reference Fisher2009) to construct a complete record of the political affiliations of all the English MPs elected in 1830. We code the indicator variable Whig/Radical as one if a MP was a Whig or a Radical and as zero if he was a Tory to capture the MPs’ association with political factions in the Unreformed Parliament.
NEWSPAPER CIRCULATION
Newspaper circulation can be used to proxy for the general flow of information. In the 1830s, London was the information hub of England. The MPs had access to the major London newspapers as well as local newspapers from the area from which they were elected, which would often repeat news stories from the London papers (Barker Reference Barker2000). Many of the newspapers were supportive of reform (Jupp Reference Jupp1998) and reported extensively on the proceeding in Parliament. The newspapers were also a major source of information on public protest and the national newspapers often reported on meetings and other reform-related events outside London.Footnote 23 Newspapers were subject to stamp duties on each sheet of paper.Footnote 24 Since the accounts of the Stamp Office report the stamp duties paid by each newspaper, it is possible to estimate newspaper circulation within each county. We code the variable, local newspapers, as the number of newspapers sold per year in each county in 100,000s (see the Online Appendix for details).
ECONOMIC FUNDAMENTALS
Based on the 1831 Census of Great Britain, we consider two aspects of the economic environment: employment concentration and population density. First, we measure employment concentration in each constituency with a Herfindahl index, emp. Herfindahl index. It is computed as the sum of the square of the share of individuals in each census registration district working in agriculture, in trade, as professionals, and in other occupational categories.Footnote 25 Emp. Herfindahl index varies between zero and one: a value closer to one implies that employment is concentrated in fewer sectors. Second, we measure population density as the number of individuals per inhabited house in the constituency, as recorded in the 1831 Census of Great Britain. We conjecture that areas with more concentrated employment structures and higher population density could articulate reform support (or opposition) more effectively.
PERSONAL CHARACTERISTICS OF THE MPS
We account for the possibility that the personal and professional characteristics of the MPs might have influenced their votes. From the bibliographical notices compiled by Fisher (Reference Fisher2009), we obtain information on the MPs’ age, education, and occupation. We record whether a MP attended secondary school and/or university. About 74 percent of the MPs attended secondary school while 66 percent also attended university. At the time, a very small fraction of the population had access to higher education, and as such, the MPs were a highly selected group of educated men. We also build an indicator variable coding whether they carried out a Grand Tour. The Grand Tour was the educational rite of passage for the members of the British aristocracy in their early 20s to get them acquainted with classical and contemporary art and culture in Continental Europe, in particular in France and in Italy (Trease Reference Trease1967; Hibbert Reference Hibbert1987). The Grand Tour might also be viewed as a proxy for some open-mindedness and interest in continental philosophy and political ideas (see in particular, Mitchell (Reference Mitchell2005, Ch. 5) on the Whigs’ bond with France). Almost 10 percent of the MPs had taken the Grand Tour. We also record the number of years that a MP had served in the House of Commons by 1831 which can be interpreted as a measure of experience. The average length of tenure in the 1830–1831 parliament was 11 years. The occupations of the MPs also reflect the aristocratic nature of the pre-1832 Parliament: they were army officers, jurists or lawyers, bankers, industry owners, merchants, or landowners. Some of them were “dynasty heirs,” in other words, MPs who were immediately returned to Parliament when they finished their education and/or reached majority. Finally, many had family members who also held seats.
RELATIONSHIPS AMONG THE CONTROL VARIABLES
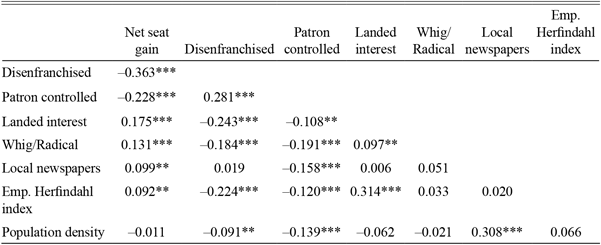
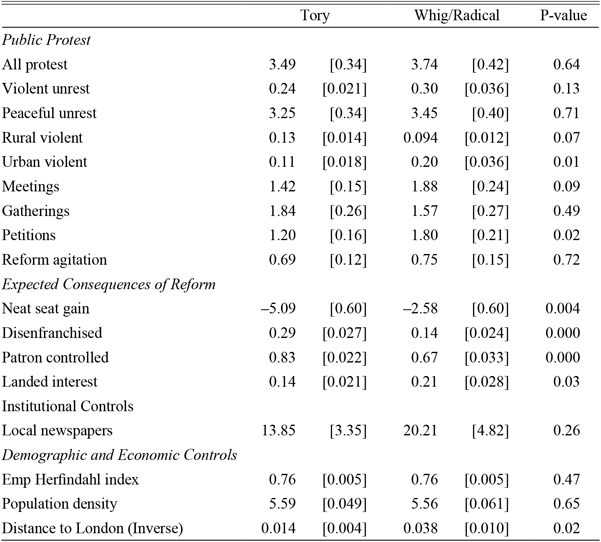
Tables 4 and 5 report descriptive statistics to highlight the relationship among the control variables. In Table 4, we report correlation coefficients between selected explanatory variables along with their significance levels. We notice that the control variables are not particularly highly correlated. The correlation coefficient between Whig/Radical and patron controlled is –0.19 and that between Whig/Radical and disenfranchised is –0.18 (both coefficients are significant at the 1 percent level). In Table 5, we report mean comparisons tests of differences in the constituency characteristics for the sub-samples of constituencies with Whig/Radical and Tory MPs. We find that constituencies which returned Whigs did not, in general, experience significantly more protests than those which returned Tories, but the type of protest did vary. In particular, there were more violent urban unrest, more meetings, and a greater number of pro-reform petitions in constituencies that elected Whigs and more violent rural unrest in constituencies that elected Tories. The two tables confirm that more Tories were returned in rotten boroughs and in constituencies controlled by patrons while more Whigs were elected in urban constituencies where elections were somewhat open.
CORRELATION COEFFICIENTS AMONG SELECTED SOCIO-ECONOMIC AND POLITICAL CHARACTERISTICS

* = Significant at the 10 percent level.
** = Significant at the 5 percent level.
*** = Significant at the 1 percent level.
Note: Calculated for the sample of 489 English constituencies.
Source: Definitions and sources of the variables are provided in the text and in Online Appendix A10.
TEST OF MEANS DIFFERENCES IN CONSTITUENCY CHARACTERISTICS BY PARTY AFFILIATION OF THE ELECTED MPs

Note: The table reports averages and standard errors (in square brackets) for the subsamples of the 489 English seats identifying with the Tory and the Whig/Radical parties, respectively. There were 279 Tories and 210 Whigs/Radicals. The last column reports the p-value associated with a t-test of the null hypothesis that the means of the two subsamples are different.
Source: Definitions and sources of the variables are provided in the text and in Online Appendix A10.
EMPIRICAL STRATEGY
To test the Threat of Revolution, the Public Opinion, and the Political Expedience Hypotheses, we relate violent unrest, peaceful protest and petitions, and political expedience to each MP’s vote for or against reform and estimate the following probit model:
 $$Prob\left( {yes{\rm{}}vot{e_{k,d,c}} = 1} \right){\rm{}} = {\rm{\Phi }}\left( {{\alpha _0} + threa{t_c}{\alpha _1} + opinio{n_{d,c}}{\alpha _2} + expedienc{e_{d,c}}{\alpha _3} + {X_{k,d,c}}{\alpha _4}} \right),$$
(1)
where Ф is the distribution function of the standard normal distribution, yes vote is equal to one if MP k elected in constituency d in county c voted in favor of the bill, and zero if he opposed it. The vector threat represents combinations of the various measures of violent unrest (violent unrest, rural violent, urban violent); the vector opinion collects combinations of the variables that proxy for public opinion (peaceful protest, meetings, gatherings, reform agitation, and petitions); the vector expedience collects the four measures of political expedience (net seat gain, disenfranchised, patron controlled, and landed interest); and the vector X represents the control variables (which are, in the main specification, local newspapers, emp. Herfindahl index, and population density). We control for Whig/Radical in all specifications.
The model is hierarchical: seats belong to constituencies which are located within counties. Since our main explanatory variables are measured at the county or the constituency level, they are perfectly correlated within those clusters. It is also likely that the errors are correlated for seats and constituencies within a given county. To avoid basing inference on standard errors which are likely to be downwards biased, we report standard errors that are clustered at the county level (Cameron and Miller Reference Cameron and Miller2015).
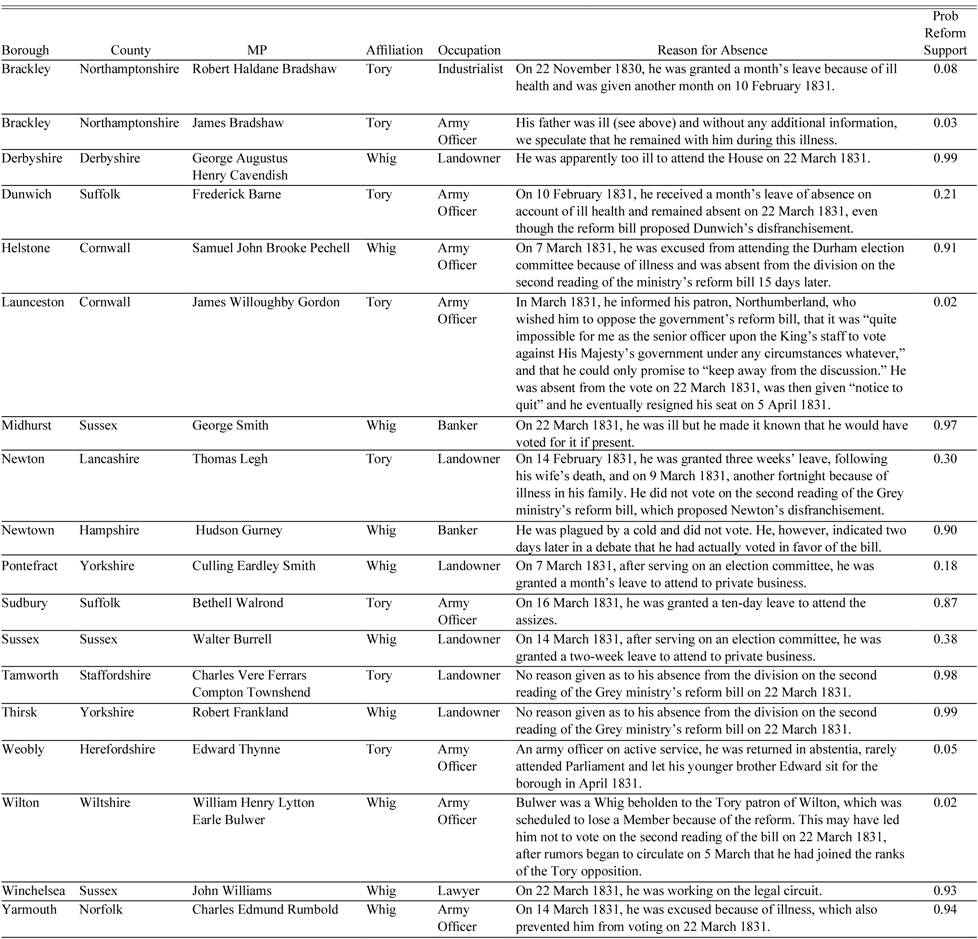
Nine Whigs and nine Tories from England were not present in Parliament for the vote on 22 March 1831. The date for the second reading of the bill was known in advance and the second reading itself followed several days of debates. It is unlikely that any of the absent MPs were unaware of the intensity of the discussions in the House of Commons or that they would be uninformed about when the final vote would approximately take place. Since any one of the absent MPs could have been pivotal in the vote had they been present, it is important to consider their participation decision. For most of them, we know why they were not present, and by far the most common reason was poor health or planned absence to attend to private business (see Table 9). Yet, it is possible that the decisions of some of these MPs (not) to attend Parliament on that day and (not) to vote on the bill were taken jointly. For example, the absent MPs might have decided not to attend because they did not have any personal stake in the reform, or because they, as in the case of William Henry Little Earle Bulwer, did not want to confront their patron, or because they were discouraged from taking the trip to London by fear of social unrest. If this were the case, our estimates of (Equation (1)) would suffer from a selection bias. We can correct for such a bias using a Heckman-Probit model (Van de Ven and van Pragg Reference Van de Ven and Van Praag1981). This entails estimating a selection equation which models the probability of being present for the vote and then adjusting the outcome equation (Equation 1) for the selection effect. We consider that two variables can be excluded from the outcome equation because they explain the MPs’ presence in the House of Commons for the vote, but are (plausibly) unrelated to the MPs’ vote decisions. First, the distance from a MP’s constituency to London directly affected how cumbersome it was to get to London, if he was not residing at the time in his London residence, but arguably did not have any direct impact on the vote decision. Second, the MP’s age would be a factor and it is reasonable to suppose that old age could explain why a MP was not present at 3 am in the morning when the vote was taken. We thus write the selection equation of the Heckman-Probit model as
 $$Prob\left( {presen{t_{k,d,c}} = 1} \right) = {\rm{\Phi }}\left( {{\beta _0} + threa{t_c}{\beta _1} + opinio{n_{d,c}}{\beta _2} + expedienc{e_{d,c}}{\beta _3} + distanc{e_d}{\beta _4} + ag{e_k}{\beta _5} + {X_{k,d,c}}{\beta _6}} \right),$$
(2)
where Ф is the distribution function of the standard normal distribution, present is equal to one if MP k elected in constituency d in county c was present in the House of Commons on 22 March 1831, and equal to zero if he was not. The variable distance is the inverse crow-fly distance (in kilometers) from each constituency to London and age is a second degree polynomial in the age of the MP. The other variables were defined earlier.
ABSENCE FROM THE HOUSE OF COMMONS, 22 MARCH 1831

Note: This table lists the MPs who did not attend the vote on 22 March 1831, along with their affiliation and stated reason of absence based on the information in Fisher (Reference Fisher2009). It also reports a counterfactual analysis where we compute each MP’s predicted probability of voting for reform from the Probit regression in column 3 of Table 6, using the MPs’ observable characteristics and those of their constituencies. Table A7 in the online appendix reports the reason why the four vacant seats were vacant.
Source: Authors’ compilation based on Fischer (2009).
RESULTS
Public Protest Versus Political Expedience
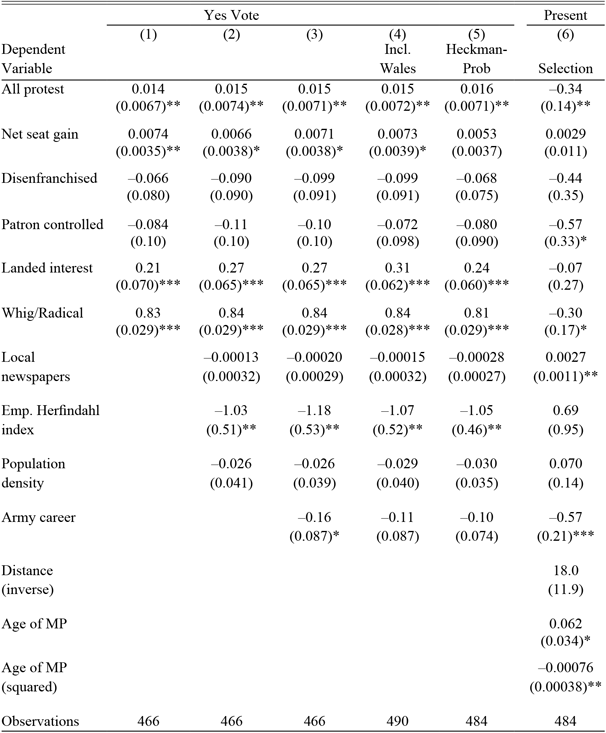
In Table 6, we start by presenting our estimates of the effect of all protest and of the four variables capturing political expedience (net seat gain, disenfranchised, patron controlled, and landed interest) on the probability that the 466 English MPs present voted in favor of the reform bill on 22 March 1831. In this and subsequent tables, we report marginal effects evaluated at the mean of the explanatory variables. Column 1 reports a parsimonious specification, while we progressively add controls in Columns 2 and 3. Column 4 reports the results from a sample which is extended with the seats in Wales. Columns 5 and 6 report results from the Heckman-Probit model.
THE PROBABILITY THAT A MP VOTED IN FAVOR OF THE REFORM BILL ON 22 MARCH 1831: PROBIT AND HECKMAN-PROBIT ESTIMATES

* = Significant at the 10 percent level.
** = Significant at the 5 percent level.
*** = Significant at the 1 percent level.
Note: Cols. (1)–(4) report probit estimates of the probability that a MP voted yes. Marginal effects evaluated at the mean of the explanatory variables are shown. Constant not shown. Standard errors in parentheses are clustered at the county level. In Cols. (1)–(3) the sample is the English MPs who were present in the House of Commons on 22 March 1831, and in Col. (4), the Welsh MPs are included. Col. (5) reports Heckman-Probit estimates for the 484 English MPs who could have voted (marginal effects reported). Col. (6) reports the selection equation; the outcome variable present is coded one if the MP was present and zero otherwise. The Wald test of independence between the selection and outcome equations is associated with a p-value =0.0001. We therefore reject that the two equations are independent and selection may be an issue.
The results show that public protest mattered. The point estimate on all protest is significant at the 5 percent level, the coefficient is stable, and it does not matter if Wales is included in the sample or not. Intuitively, if the home county of a MP had been exposed to an increase of one standard deviation in the number of protest participants (58,000), this would have increased the probability that he voted in favor of the reform bill by 8.7 percentage points (Table 6, Column 3). The regression results also suggest that political expedience, as proxied by the net seat gain, disenfranchised, patron controlled, and landed interest variables, mattered for the MPs’ vote decisions. In the preferred specification in Column 3, MPs representing the landed interest were 27 percentage points more likely to support the bill than other MPs. MPs from constituencies in counties that stood to gain additional representation were also more likely to vote for reform: an increase in net seat gain of one increased a MP’s likelihood of supporting reform by 0.7 percentage points. In contrast, neither the MPs elected in the “rotten” boroughs which stood to lose representation (disenfranchised), nor those elected in constituencies dominated by a local patron (patron controlled) were more likely than the other MPs to oppose the bill.
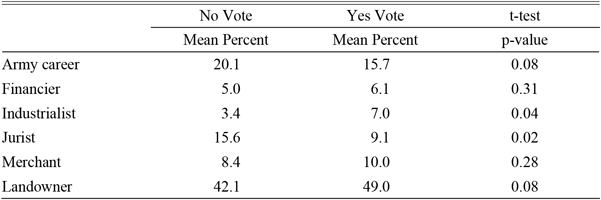
Further inspection of Table 6 confirms that Whig and Radical MPs were much more likely to support reform than Tory MPs, as indicated by the positive and significant sign of Whig/Radical. This variable controls for the ideological predisposition of the MPs and so, the probit regressions estimate how public protest and political expedience caused the MPs to deviate from this pre-disposition or the wishes of the party leaderships. We also observe that MPs from constituencies with a higher employment Herfindahl index, and thus with a more concentrated employment structure, were more likely to oppose parliamentary reform. Local newspapers and population density are negatively correlated with the support for reform, but not significant. Column 3 includes the only personal characteristic that was significantly related to the MP’s vote decision: MPs with an army career were 16 percentage points less likely to support the bill than other MPs.Footnote 26
Table 6, Columns 5 and 6, report the result of the Heckman-Probit model that accounts for self-selection regarding the presence of MPs in the House of Commons on 22 March 1831. The three variables used to identify the selection equation (Column 6) have the expected signs, but the (inverse) distance to London is not significant. The polynomial in age is, however, significant and suggests a sharp decline in the attendance probability around the age of 41 years. The selection correction has little influence on the outcome equation (Column 5) and the results related to protest and political expedience are not modified except for the fact that net seat gain becomes insignificant.
Finally, in Table A1 in the Online Appendix, we reproduce the result of Column 3 in Table 6 but with different coding of the main variables. The results are similar when, instead of the number of participants in protest, we use the number of protests, the number of protesters per capita, and the number of protesters per adult male. Furthermore, net seat gain has a positive and significant effect when we recode it in percent.
Violent Unrest and Peaceful Protest
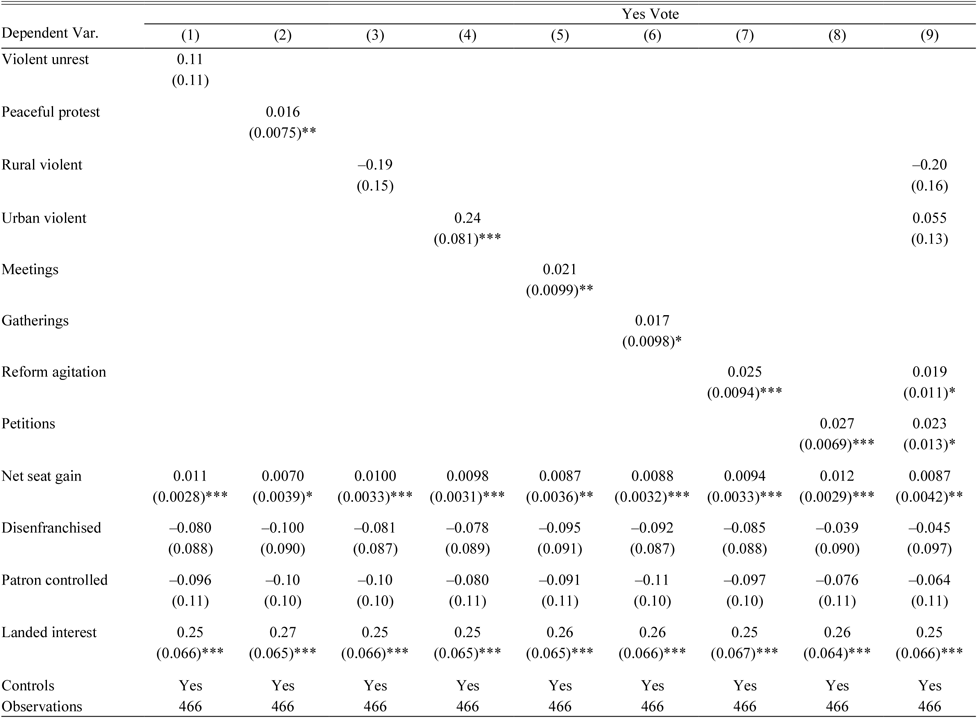
The results reported in Table 6 support the Political Expedience Hypothesis and demonstrate that overall exposure to public protest—a combination of violent unrest and peaceful protest—increased support for the reform bill. In Table 7, we present results related to the Threat of Revolution Hypothesis and the Public Opinion Hypothesis by making a distinction between violent unrest and peaceful protest and by further disaggregating violent unrest into rural and urban violence and peaceful protest into meetings, gatherings, and reform agitation. Since some of these variables are highly correlated (see Table A6 in the Online Appendix), we enter them one by one before presenting a “horse race” regression.
THE EFFECT OF VIOLENT AND DIFFERENT TYPES OF PEACEFUL PROTEST ON A MP’S PROBABILITY OF VOTING IN FAVOR OF THE REFORM BILL: PROBIT ESTIMATES

* = Significant at the 10 percent level.
** = Significant at the 5 percent level.
*** = Significant at the 1 percent level.
Note: Probit estimates. Marginal effects evaluated at the mean of the explanatory variables. Constant not shown. Standard errors in parentheses are clustered at the county level. Sample restricted to the English MPs who were present in the House of Commons on 22 March 1831. Peaceful protest is sum of meetings and gatherings. Violent unrest is the sum of rural violent and urban violent. Controls included are whig/radical, local newspapers, emp. Herfindahl index, population density, and army career. When tested down by a general-to-specific algorithm, petitions is significant at the 1 percent level and reform agitation is significant at the 5 percent level in Col. (9).
Source: Definitions and sources of the variables are provided in the text and in Online Appendix A10.
In Table 7, columns 1 and 2, we disaggregate all protest into violent unrest and peaceful protest. We see that the positive effect of violent unrest is imprecisely estimated while peaceful protest influenced the MPs’ vote decisions, with an extra 10,000 peaceful protesters increasing the MPs’ support for reform by 1.6 percentage points. The further decomposition of violent unrest in Table 7, columns 3 and 4 into rural violent and urban violent, however, shows that urban violent had a significant and large positive effect on the probability of voting yes, while rural violent did not have an effect. We see that an extra 10,000 participants in violent unrest in urban areas increased the MPs’ support for reform by 24 percentage points. These results are consistent with the threat of revolution hypothesis and suggest that what the elite feared most was an urban uprising. It is also consistent with the observation that many MPs did not reside in the countryside for most of the winter months, even if they owed property there (as we noted above). Consequently, many of them had not been directly exposed to the Swing riots (in the winter of 1830–31) which were the largest violent rural revolt in our sample period.
Table 7, Columns 5 and 6 disaggregate peaceful protest into two different types: meetings and gatherings. Both types of protest had a positive effect on the MPs’ votes: they increased the support for reform by 2.1 and 1.7 percentage points, respectively, with an extra 10,000 participants. In Table 7, Column 7, we single out those meetings and gatherings which Horn and Tilly (Reference Horn and Tilly1988) identified as being explicitly related to the reform question and we see a highly significant positive effect of this type of agitation. The point estimate on reform agitation suggests that an extra 10,000 participants in reform-related agitation and mass protest would have increased support for reform by 2.5 percentage points. Furthermore, Table 7, Column 8 shows that petitions in favor of reform originating from a constituency increased the probability of a yes vote from the MPs elected in that constituency by 0.027 percentage points per additional petition. In all these specifications, we consider one (unrest or protest) variable at the time. In Table 7, Column 9, we report the results of a “horse race” specification which pitches the two variables rural violent and urban violent that capture the threat of revolution against the two variables reform agitation and petitions that capture peaceful reform-specific agitation and lobbying. We find that petitions and reform agitation are statistically significant while rural violent and urban violent are not. This suggests that peaceful agitation or lobbying aimed specifically at the reform question had a stronger influence on the MPs than urban unrest and the fears of revolution that such unrest may have conjured up.Footnote 27
Table A3 in the Online Appendix reports additional regression results where we exclude the MPs elected in the City of London, in Westminster, and in the county of Middlesex. The motivation for this robustness check is that London was the capital and was consequently, along with its immediate vicinity, the center of political agitation. The results are less precisely estimated, but otherwise similar to those reported in Table 7.
Two Counterfactual Scenarios
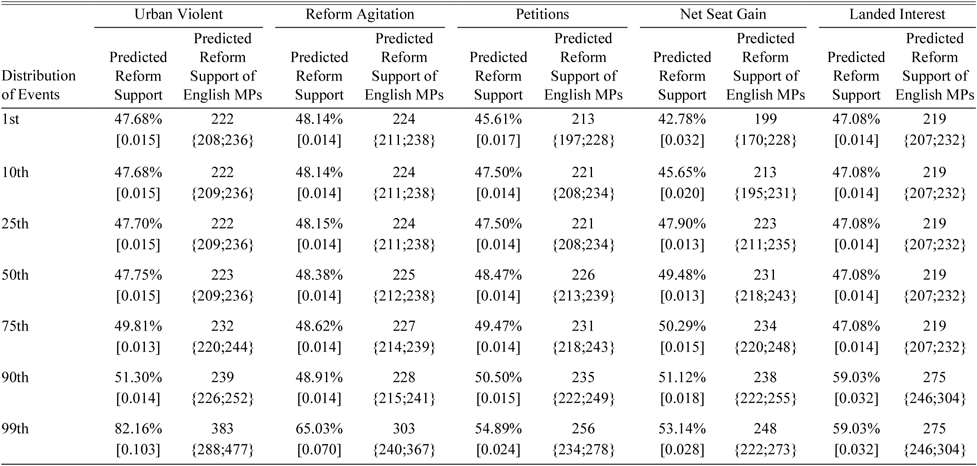
We present two counterfactual scenarios that are designed to assess the magnitude of the estimated effects and to evaluate if the threat of revolution, public opinion, and political expedience exerted a sufficiently powerful effect on the MPs to be considered pivotal in the outcome of the vote. In the first counterfactual scenario, we analyze what would have happened if the MPs who attended the second reading on 22 March 1831 had been exposed to other levels of violent unrest (urban violent) and reform related agitation (reform agitation and petitions) than the actual levels they were exposed to, ranging from the lowest to the highest percentiles of the respective distributions. We also analyze what would have happened if the significant variables related to political expedience (net seat gain and landed interest) had taken different values. For each variable, we determine its value at the 1st, 10th, 25th, 50th, 75th, 90th, and 99th percentile of the distribution and use the relevant probit regression to compute the predicted probability that each MP would have voted for reform.Footnote 28
For each percentile of the distribution and each variable, Table 8 presents two sets of results: (i) the predicted share of English MPs who would have supported reform had they been exposed to various levels of violent urban unrest, reform agitation, and petitions or political expediency and (ii) the predicted number of pro-reform English MPs. For each estimate, we also report 95 percent confidence intervals to quantify the precision of the estimates.Footnote 29 We recall that a minority of 229 (out of 466 present) English MPs actually voted for reform (see Table 1). Table 8, Column 1 shows the results for the proxy for the threat of revolution, urban violent. This counterfactual scenario shows that, had the MPs been exposed to violent urban unrest in the 75th percentile of the distribution rather than in the 25th, this would have persuaded (with 95 percent confidence) between 8 and 11 more of them to support the reform bill and almost created a majority (49.81 percent) in favor of the reform among the English MPs. Table 8, Columns 2 and 3 report the results for reform related agitation and lobbying. For reform agitation and petitions, a move from the 25th percentile to the 75th percentile would have encouraged, on average, 3 and 10 more MPs to support the reform bill, respectively. It is, therefore, clear that urban violent unrest as a proxy for the threat of revolution as well as peaceful reform related agitation and petitioning had a substantive effect on the outcome of the second reading and could have been pivotal.
COUNTERFACTUAL ANALYSIS OF THE LEVELS OF PROTEST AND CONSTITUENCIES’ CHARACTERISTICS ON THE MPS’ VOTES

Note: This table reports results for a counterfactual analysis where we use the results in Cols. 4, 7, and 8 of Table 7 for urban violent, reform agitation, and petitions, and the results in Cols. 3 in Table 6 for net seat gain and landed interest. For each variable, we determine its value at the 1st, 10th, 25th, 50th, 75th, 90th, and 99th percentile of the distribution, and using the relevant regression we report the predicted probability that the 466 MPs would have voted for reform (with 95 percent confidence intervals in curly brackets). Standard errors for the predicted values are reported in square brackets.
Source: Definitions and sources of the variables are provided in the text and in Online Appendix A10.
Table 8, Columns 4 and 5 evaluate the importance of the two (statistically significant) variables, net seat gain and landed interest, related to political expedience. From Table 8, column 4, we see that if all constituencies had been located in a county that were to gain two extra seats (corresponding to the 75th percentile of the distribution of net seat gain), then a majority of 234 English MPs would have voted for the bill. Likewise, in Table 8, Column 5, we see that had all constituencies enjoyed the benefit that the landed interest obtained from the new voting rules in the counties (corresponding to the 90th percentile of the distribution of landed interest), 275 of the English MPs would have voted in favor of reform. Political expedience, thus, also had a substantive effect on the outcome of the vote.
In the second counterfactual scenario, we focus on the 18 absent English MPs and analyze what would have happened to the outcome of the vote if they had attended the second reading and voted on 22 March 1831. Based on the bibliographic information,Footnote 30 we researched the reasons given for each MP’s absence which we summarize in Table 9. The two most frequent reasons were (i) poor health and (ii) planned absence. To undertake the counterfactual calculation, we use the probit regression from Table 6, Column 3 to predict how the 18 MPs, given their observable characteristics and those of their constituencies, would have voted had they been present. The last Column of Table 9 reports for each MP the predicted probability that he would have voted for reform. Eight of the MPs were almost sure to vote yes with a predicted probability of doing so greater than 90 percent and five MPs were almost sure to vote no with a predicted probability of supporting the bill less than 10 percent. Of the remaining five absent MPs, one would in all likelihood have voted yes (with a predicted probability of 87 percent), while the other four would most likely have voted no with probabilities of voting yes between 18 and 38 percent. It, thus, appears that the absent MPs would have split equally between yes and no and that it, therefore, did not matter for the outcome of the vote that they did not attend. It is, however, interesting to observe that out of the nine potentially pro-reform MPs, seven were Whigs and two were Tories. In fact, these two Tories have a high predicted probability of supporting reform: Bethell Walrond has a 87 percent predicted probability of voting yes while that of Charles Vere Ferrars Compton Townshend is 98 percent.Footnote 31 Conversely, one of the Whigs, William Henry Lytton, has a very low predicted probability of voting yes (only 2 percent).
Interpretation
We find strong evidence that the MPs reacted to public expressions of reform support, as suggested by the Public Opinion Hypothesis. Our empirical analysis suggests that two channels connected the MPs to public opinion. The first channel was direct and targeted lobbying via petitions from the MPs’ constituents about the reform question. This suggests that lobbying worked, not on every MP, but on a sufficiently large number to make a difference. The other channel is mass-mobilization for reform. Information about mass-mobilization reached the MPs through their own participation in meetings and through frequent reports in the local and national press about meetings and demonstrations in their home county. Taken together, we conclude that the force of lobbying, agitation, and public expressions of reform support were pivotal in pushing the reform bill over its first hurdle. Interests outside of parliament played a key role.
In contrast and despite the rhetoric used by many MPs in the Parliamentary debate and the subsequent narrative of the Whig historians (e.g., McCarthy Reference McCarthy1852; Trevelyan Reference Trevelyan1920), our “horse race” tests suggest that the threat of revolution played a secondary role compared to public opinion. If anything, it was violent riots and demonstrations in London and in other urban areas rather than the rural Swing riots that made an impression. This does not mean that the threat of revolution was unimportant to the overall reform process: Aidt and Franck (Reference Aidt and Franck2015) show that it did matter in relation to the April–June 1831 general election called shortly after the second reading where exposure to rural riots generated reform support among the electors of the Unreformed Parliament. However, our results suggest that the reform bill passed over its first hurdle, not so much because of fears of revolution, but thanks to the force of peaceful agitation and public expressions of reform support.
The reform process played out against the backdrop of the economic transition to new manufacturing processes that started in the 1760s. In 1830, there was a new industrial elite which was poorly represented in the House of Commons, despite its economic power. This caused tension between the old landed elite and the new industrial elite, not only about political representation (Ansell and Samuels Reference Ansell and Samuels2014) but also about trade and other economic policies (Schonhardt-Bailey Reference Schonhardt-Bailey1991, Reference Schonhardt-Bailey1994). Inside the Unreformed Parliament, however, our results related to political expedience suggest that this issue was resolved by the compromises embedded in the reform bill (in other words, more seats to the counties and new seats to the industrial heartland). This made room for a coalition between the MPs elected in the counties, who represented the landed interest, and the MPs elected in the industrial heartland, who represented the industrial interest. Our estimates show that both groups were more likely to support the second reading of the bill. The inter-sectoral coalition building can also be seen from the occupations of the pro- and anti-reform MPs. Table 10 shows simple mean comparison tests of the proportion of the MPs who voted for and against the bill across different occupational and landownership categories. We see that the proportion of MPs with a background in industry (industrialists) was twice as large among the supporters as among the opponents of the bill. At the same time, the share of landowners was also higher among the bill supporters. The anti-reform bloc, however, had a high proportion of MPs with a career in the army or in law. These results suggest that political expedience partly reflected a direct personal interest in the outcome of the reform process and partly underlying sector interests.
THE OCCUPATIONS OF THE MPS: MEAN COMPARISON TESTS OF THE PROPORTION OF MPS VOTING YES AND NO

Note: The table reports the results of one-sided t-tests for mean differences in the percentage of MPs within different occupational and landownership categories. The p-values are for the test of the larger mean being bigger than the smaller. The sample includes the 466 English MPs who voted. Each MP can belong to more than one category.
Source: Definitions and sources of the variables are provided in the text and in Online Appendix A10.
OMITTED FACTORS AND INDIRECT CHANNELS
Our regression results suggest that public opinion, political expedience and to a lesser extent urban violent unrest directly influenced the MPs’ support for reform. We can plausibly rule out reverse causality since our sample of violent unrest, protests and petitions ends before the MPs voted on the reform, although for petitions there could be, as we discuss later, an anticipation effect. The main concern, therefore, is unobserved factors that could explain, at the same time, the spatial distribution of public protest of various types and petitions as well as the MPs’ position on the reform bill. Table A5 in the Online Appendix shows that including an additional set of potentially confounding factors does not affect our results. In this section, we discuss the possibility of indirect effects, anticipation effects, and conduct a placebo test to bolster the argument that the results are not due to unobserved omitted factors.
Direct and Indirect Influences on the MPs’ Vote Choices
Tables 6 and 7 report estimates of the direct effect of violent unrest, peaceful protest, and political expedience on the MPs’ votes. Support and opposition to the bill split, as previously noted, along party lines, with the Whigs and Radicals being (mostly) in favor and the Tories being (mostly) against. The MPs who voted on the bill were elected in the 1830 general election. Unlike the election in 1831, parliamentary reform was not yet the major issue when the polling period ended in September 1830. It did play, however, some role in the agitation: the radical politician Henry Hunt stood unsuccessfully in Preston on a reform platform and some of the successful candidates, including Whig politician Henry Brougham, were committed to seek reform in the upcoming session (Brock Reference Brock1973, Ch. 3; Tilly Reference Tilly1995, p. 324). It is, therefore, possible that public protest before and during the election campaign induced some voters and patrons in areas strongly affected by protest or agitation to elect candidates from a particular party who subsequently happened to vote in a particular way on the reform bill. If this were the case, public protest exerted an indirect influence on the vote and the evidence on the direct effect of public protest could reflect this.
To investigate whether public protest and/or expectations of eventual gains and losses from parliamentary reform influenced the outcome of the 1830 election, we create the new dependent variable Whig share in 1830. It is equal to the share of seats in each constituency won by the Whigs or Radicals, in other words, the two parties which subsequently supported the reform bill. We also re-compute our measures of public protest so that they only include events which happened before the polling period of the 1830 General Election that started on 29 July 1830. Descriptive statistics are reported in Table A13 in the Online Appendix.
Table 11 shows the results from three linear regressions relating Whig share in 1830 to our recoded measures of protest, as well as to the variables capturing political expedience and the set of control variables. We find that neither violent unrest nor peaceful protest had any effect on the electoral outcome in 1830. With regard to political expedience, we see that net seat gain and disenfranchised are insignificant and landed interest is only marginally significant at the 10 percent level. The variable Patron controlled is, however, significantly and negatively related to the share of elected Whigs. The places that were controlled by patrons tended to elect Tories, as previously noted. Overall, these results reinforce our interpretation of the main results as evidence that protest in its various forms had a direct effect on the vote choices of the MPs.
THE EFFECT OF PROTEST AND POLITICAL EXPEDIENCE ON THE SHARE OF WHIGS AND RADICALS ELECTED IN THE 1830 GENERAL ELECTION: OLS ESTIMATES

* = Significant at the 10 percent level.
** = Significant at the 5 percent level.
*** = Significant at the 1 percent level.
Note: Linear regressions estimated with OLS. Constant not reported. Standard errors in parentheses are clustered at the county level. Sample restricted to the 244 English constituencies.
a The variables are recoded and accumulate protest events before 29 July 1830.
b All but ten petitions were submitted after the 1830 election.
Descriptive statistics are reported in Table A12 in the Online Appendix.
Source: Definitions and sources of the variables are provided in the text and in Online Appendix A10.
Another concern is that petitions were submitted to MPs who were supporting the reform anyway. Since most Whig MPs voted for the reform, we would expect, if this concern is real, a positive correlation between the petitions for reform submitted (largely) after the 1830 election and the likelihood that a Whig (or Radical) candidate was elected in 1830. In Table 11, Column 4, we report that the correlation between petitions and Whig share in 1830 is insignificant, strongly suggesting that this was not the case.
Protest in 1828–1831 and Earlier Reform Attempts
To further check that our results are not driven by omitted factors correlated with the geography of protests and with the general pro-reform attitudes of the patrons, voters, and MPs in each constituency, we propose a falsification test. Its purpose is to assess whether public protests between 1828 and 1831 can predict the roll call votes on two earlier attempts at reform which failed to obtain a majority in the House of Commons. The attempts are the reform bills proposed by Thomas Brand, which was supported by 92 MPs on 21 May 1810 (1807 Parliament), and by Lord John Russell, which was supported by 148 MPs on 25 April 1822 (1820 Parliament). Since protests between 1828 and 1831 had not yet happened, they should not predict whether the MPs in 1810 and 1822 voted for reform.Footnote 32
To carry out the falsification test related to the failed attempts at reform in 1810 and 1822, we estimate probit regressions similar to Equation (1) but with the two new dependent variables yes vote 1810 and yes vote 1822 which are equal to one if the MP elected in a given constituency supported the reform bill in 1810 or 1822, respectively, and zero otherwise. To match the control variables to the relevant time periods, we collect data on the party affiliations of the MPs who represented each English constituency in the 1807 and 1820 Parliaments. We also replace the variable patron controlled with the variable uncontested elections which assesses whether there was an actual contest in the last seven general elections prior to the 1807 or 1822 general election and use information from the 1811 and 1821 Censuses to construct emp. Herfindahl index and population density. Descriptive statistics are reported in Table A14 in the Online Appendix. Table 12 shows the results. It is reassuring to observe that neither public protest between 1828 and 1831, whether violent or not, nor reform petitions predict support for reform among the MPs in 1810 and 1822. These results provide additional support for our interpretation that the effect of public protest on the second reading of the bill is causal rather than coincidental.
FALSIFICATION TEST. THE EFFECT OF PROTEST IN 1828–1831 ON ROLL CALL VOTES RELATED TO THE FAILED REFORM BILLS OF 1810 AND 1822: PROBIT ESTIMATES

* = Significant at the 10 percent level.
** = Significant at the 5 percent level.
*** = Significant at the 1 percent level.
Note: Probit estimator. Marginal effects evaluated at the mean of the explanatory variables. Constants not reported. Standard errors in parentheses are clustered at the county level. Sample restricted to the English MPs. Uncontested elections is coded one if the seven previous elections were uncontested and zero otherwise; emp. Herf. index and population density refer to the nearest census year. Only yes votes recorded. MPs who did not vote are assumed to vote no. Descriptive statistics reported in Table A13 in the Online Appendix.
Source: Definitions and sources of the variables are provided in the text and in Online Appendix A10.
CONCLUSION
Our study of the 22 March 1831 roll call vote on parliamentary reform adds to the understanding of the historical process of democratization in three ways. First, in between the view that democratization was an elite project devised for opportunistic reasons and the view that democracy was unwillingly conceded by the elite to avoid a revolution, there is a third possibility which has received too little attention in the historical discourse on democratization, with the notable exception of the pioneering work by Tilly (Reference Tilly1995, Reference Tilly2007). This possibility is that peaceful protest and demonstrations, agitations, petitioning and other public expressions of opinion might influence the views and attitudes of the elite politicians who contemplate reform without necessarily stoking fears of a violent revolution. In particular, politicians may be influenced by demands from the population at large (e.g., a large peaceful demonstration), from meetings with their constituents, or from organized special interest groups (e.g., lobbying by a reform society) and persuaded that reform is needed and desirable. This sort of mass-led, non-violent mobilization was instrumental in bringing about democratization in several countries in South Asia, Eastern Europe and Sub-Saharan Africa in the last 30 years (e.g., Bunce and Wolchik Reference Bunce and Wolchik2006; Chenoweth and Stephan Reference Chenoweth and Stephan2009, Reference Chenoweth and Stephan2011). However, there is, as far as we know, no quantitative historical evidence on mass-led democratization. Building on the work by Tilly (Reference Tilly1995), our study provides such evidence. We are able to distinguish between peaceful and violent protest and thus between agitation and revolutionary threats. We find that peaceful protest and reform related petitions exerted an important influence on the MPs’ vote, giving reason to reassess the importance of mass mobilization and lobbying for democratic reform. The threat of revolution was stoked by urban (and not rural) social unrest but was less important than peaceful reform related agitation and lobbying for the result of the roll call vote.
Second, the study provides new evidence on the importance of political expedience. We follow the approach pioneered by Ziblatt (Reference Ziblatt2008) and use the details of the reform proposal which disenfranchised many borough constituencies, granted representation to all the large industrial towns, and allocated more seats to the counties to measure the expected gains and losses for individual MPs. We find that MPs elected in borough constituencies located in counties that stood to gain representation as well as those representing the counties and the landed interest supported the bill.
Third, franchise reforms are the outcome of complex political processes and multiple hurdles have to be overcome for success. The Great Reform Act is no exception, as it had to overcome at least five such hurdles at each of which it could have failed (e.g., Brock Reference Brock1973). The fact that there were multiple hurdles points to the possibility that different “causes”—political expedience, agitations, and mass mobilization, or threats of revolution—may all play a role but with different intensities at different points in the process. In this article, we study one of the hurdles that the Great Reform Act had to pass—the roll call vote in March 1831—and find that peaceful reform related agitation and lobbying played a leading role. In contrast, Aidt and Franck (Reference Aidt and Franck2015) study another of these hurdles—the general election in April–June 1831—and find strong causal evidence that the threat of revolution as measured by voters’ exposure to rural riots was instrumental in returning the large Whig majority needed to move the reform process on. This specific example carries with it the more general lesson that different causal mechanisms can be at play at different points during a reform process. This observation not only help resolve why micro-historical studies of the same reform process often arrive at apparently contradicting conclusions, but also explains why particular reforms can deliver case-study evidence in support of very different theories of suffrage reform.
HISTORICAL SOURCES
Census of Great Britain, 1811, 1821, 1831.
Dod, Charles R., and Robert Phipps Dod. Dod’s Parliamentary Companion. Hailsham, England: Dod’s Parliamentary Companion, ltd., 1832.
Hansard, House of Commons (HC), 1831 (vols. 2 and 3)
Hansard, House of Commons (HC), 1822 (vol. 7).
Hansard, House of Commons (HC), 1810 (vol. 15).
Hansard, House of Lords (HL), 1830 (series 3, vol. 1)
Journals of the House of Commons (1828–1831, vols. 83–86).
House of Commons, Parliamentary Papers, A & P. Newspaper stamps, England. Return to an order of the Honourable House of Commons, dated 24 May 1833; —for, an Account of the Number of Stamps Issued to each of the Provincial Newspapers in England, in the Year Ending on 1 April 1833. House of Commons Papers, vol. XXXII (1833a): 613–17.
House of Commons, Parliamentary Papers, A & P. Newspaper Stamps, London. Return of the Number of Stamps issued by the Stamp Office for all the London Newspapers, from the Commencement of the Year 1832 to 31 March 1833, Inclusive. House of Commons Papers Vol XXXII (1833b): 605–607.
Private letter, J. Hume (British Library ADD 35148, LXXIX, 1 November 1830).
The Times (London, England).
The Statutes of the United Kingdom of Great Britain and Ireland. 2 & 3 William IV. London: His Majesty’s statute and law printers. Cap. XLV: “An Act to amend the Representation of the People in England and Wales.” (1832) pp. 154–206.