Introduction
Scholars and journalists have been investigating the role of the voting process in voter disenfranchisement since at least the 2000 election (e.g., California Institute of Technology and The Massachusetts Institute of Technology 2001; Sinclair et al. Reference Sinclair, Mark, Moore, Lavis and Soldat2000). Events surrounding recent elections demonstrate that ongoing investigation is necessary, with continued focus on ballot characteristics (e.g., Bullock and Hood III Reference Bullock and Hood2002; Everett, Byrne, and Greene Reference Everett, Byrne and Greene2006; Greene, Byrne, and Goggin Reference Greene, Byrne and Goggin2013; McCadney and Norden Reference McCadney and Norden2020). Voters who experience long wait times or machinery that breaks down may lose the opportunity to vote (Stein et al. Reference Stein, Mann, Stewart, Birenbaum, Fung, Greenberg and Kawsar2019) or lose faith in the system (Alvarez, Hall, and Llewellyn Reference Alvarez, Hall and Llewellyn2008; Bracken, Eaton, and Throop Reference Bracken, Eaton and Throop2020; Chen et al. Reference Chen, Haggag, Pope and Rohla2020; Pettigrew Reference Pettigrew2017). Long wait times and voter confidence have been associated with administrator decision making (e.g., Pettigrew Reference Pettigrew2017), including the allocation of voting machines and poll workers—generally, more resources improve voters’ experience, fewer resources lead to long lines and less confidence in the system. While scholars have paid significant attention to the administrative reasons for poor voter experiences at the polls, such as the elimination of polling locations, ballots themselves may lead to inter-jurisdictional differences in the voter experience (Herrnson et al. Reference Herrnson, Niemi, Hanmer, Francia, Bederson, Conrad and Traugott2008a, Reference Herrnson, Niemi, Hanmer, Bederson, Conrad and Traugott2008b).
Paper ballots are popular because they give election officials the ability to conduct a hand recount of election results. An additional benefit of paper ballots is the voter’s ability to witness their votes being processed when they feed it into an optical scanner and see that it is accepted. When ballots are collected for scanning later, voters may feel concerned that their votes will fail to be counted, particularly among voters with low trust in the system. The other benefit of scanning ballots on-site is the scanner can alert the voter that there is an error on their ballot and give the voter the chance to correct it. Common errors in paper-based voting systems include the selection of too many candidates (overvote) in an electoral contest and marks on the ballot that cannot be read by the optical scanner.Footnote 1 However, other machine errors include issues, such as feeding two pages at once or trying to feed a folded ballot into the machine.
As a result, when voters submit their ballots using an optical scanner at the polls, there is the potential for a negative impact on the in-person voting experience. While a major benefit is that the voter can correct any ballot mistakes, each scanning issue can increase the time it takes to vote both for the voter and those standing behind them. Lines grow when voters are detained at the optical scanner because of either a human or machine issue or because the scanner jams or breaks down. Both frustration and increased distrust of the process occurs when voters face technical problems casting their ballots. Additionally, voters are disenfranchised by long wait times and technical issues as people are more likely to give up on voting as the time to vote increases (Cassidy, Colleen Long, and Balsamo Reference Cassidy, Colleen Long and Balsamo2018; Jackson Reference Jackson2000; Levine Reference Levine2008). This increase in the time to vote and, particularly, long lines also impact voter confidence. Both King (Reference King2020) and Claassen et al. (Reference Claassen, Magleby, Monson and Patterson2013) identify negative effects on voter confidence when voters experience irregularities and processing delays while voting.
As of 2016, 47% of registered voters throughout the United States live in a precinct that utilizes optical or digital ballot scanners. An additional 19% of voters live in precincts that utilize mixed systems that include ballot scanning devices and other voting machine types (DeSilver Reference DeSilver2016). Every state and all US territories contain at least one jurisdiction that utilizes optical scanning devices (Verified Voting 2019). Many states, including Alabama, Connecticut, Iowa, Maine, and Rhode Island, utilize paper ballots and digital ballot scanning devices exclusively.
From a research perspective, optical scanning logs allow for an assessment of ballot characteristics and the presence of ballot errors. These logs create the potential to use data to prepare for elections in ways that can decrease voter and machine errors and decrease the likelihood of long lines in polling locations or unpleasant voter experiences (Cassidy, Colleen Long, and Balsamo Reference Cassidy, Colleen Long and Balsamo2018; Jackson Reference Jackson2000; Levine Reference Levine2008; Pettigrew Reference Pettigrew2017). In this analysis, we use data generated by optical ballot scanners to understand how ballot characteristics affect the likelihood of voters making ballot marking errors or experiencing a machine–voter interaction error.
The findings indicate that ballot complexity significantly increases the likelihood voters will either make errors on their ballot or experience issues while interacting with the ballot-scanning machine. These results indicate that election administrators need to consider the complexity of the ballots being used in different jurisdictions in addition to the demographics and size of the precinct when allocating scanners and making staffing decisions for Election Day(s). Jurisdictions with longer, more complicated ballots should receive additional staff and scanning machines as administrators should expect an increased number of scanner issues and delays as the ballot becomes more complex. Moreover, districts whose ballots are complex and whose voters have lower socioeconomic status, our results suggest, do particularly require additional resources.
Ballot Characteristics and Voting Errors
Scholarship investigating the relationship between ballot characteristics and overvotes and undervotes (Acemyan et al. Reference Acemyan, Kortum, Byrne and Wallach2015; Acemyan and Kortum Reference Acemyan and Kortum2017; Alvarez, Beckett, and Stewart Reference Alvarez, Beckett and Stewart2011; Ansolabehere and Stewart Reference Ansolabehere and Stewart2005; Brady Reference Brady2000; Bullock and Hood III Reference Bullock and Hood2002; Herrnson, Hanmer, and Niemi Reference Herrnson, Hanmer and Niemi2012; Kimball and Kropf Reference Kimball and Kropf2005; Knack and Kropf Reference Knack and Kropf2003; Reilly and Richey Reference Reilly and Richey2011; Shocket, Heighberger, and Brown Reference Shocket, Heighberger and Brown1992) often finds that ballot design can impact ballot marking behavior. However, other types of errors that voters experience during the voting process have received considerably less attention. While some errors can affect election outcomes, others result in longer lines, voter frustration, and decreased voter efficacy and trust, but not necessarily the election’s result. As a result, limiting the opportunities for voter errors and, subsequently, the quantity of voter errors that occur is critical. For this analysis, we define voting errors as—errors that occur during ballot marking (marking errors), the submission process (human–machine interaction [HMI] errors), and ballot processing (machine errors).
Like voting errors, ballot characteristics have many definitions in the ballot design literature. Studies that investigate ballot characteristics consider the complexity of ballot questions (Milita Reference Milita2017; Niemi and Herrnson Reference Niemi and Herrnson2003; Reilly and Richey Reference Reilly and Richey2011), graphic design principles (e.g., the use of bolding, shading, positioning of questions, and candidates; Kimball and Kropf Reference Kimball and Kropf2005), and ballot format (e.g., bubble ballots, connect the arrow ballots, punch-card ballots, digital ballots; Herrnson, Hanmer, and Niemi Reference Herrnson, Hanmer and Niemi2012; Bullock and Hood III Reference Bullock and Hood2002; Alvarez, Beckett, and Stewart Reference Alvarez, Beckett and Stewart2011; Ansolabehere and Stewart Reference Ansolabehere and Stewart2005; Shocket, Heighberger, and Brown Reference Shocket, Heighberger and Brown1992; Hamilton and Ladd Reference Hamilton and Ladd1996). Here, we consider ballot characteristics that are mainly beyond election administrators’ ability to control—primarily the ballot content that leads to increased complexity and ballot length. Voters in the United States are asked to vote on more offices and on more topics than most other countries, which increases the cost of voting and particularly the cost of gathering information on different offices and ballot questions—a characteristic of US elections that has been attributed to low voter turnout (Lijphart Reference Lijphart1997). Election administrators have little to no administrative discretion over ballot length and complexity, such as the number of offices on which a voter is asked to vote, the wording and length of ballot questions, and how many questions are on the ballot. However, election administrators can plan for variable circumstances and make resource allocations that consider how ballot complexity differs across polls.
The complexity and length of a ballot are likely to lead to increases in errors for several reasons. The simplest reason is that the more questions asked or selections expected, the opportunities for voters to incorrectly mark a ballot or make some sort of error increases. While this is a likely explanation for voting errors, there are also implications regarding the psychological/physiological effects of long ballots on voting error. As Downs (Reference Downs1957) argues, the process of procuring, analyzing, and evaluating information carries a cost. The expected benefit of the time invested in reaching political decisions is minuscule compared with the benefits of spending one’s time doing something more directly related to one’s daily life. In the face of a lengthy and complicated ballot, voters may speed through and decrease the amount of time they spend reading carefully and making sure they select their choices correctly, particularly on races or questions they know little about or have little personal interest (Selb Reference Selb2008).
Seib (Reference Seib2015) finds that “as the length of the ballot increases, voters become frantic, struggling to manage time and using different search and acquisition strategies” (p. 116) and that voters also spent significantly less time researching each candidate as the number of candidates increases. This indicates that the complexities of a ballot, both in length and question type, may also increase voting errors as voters attempt to hurry to get to the end of the ballot.
Survey research also finds the longer the survey, the fewer people complete the questionnaire, and, perhaps more importantly, questions that are positioned later in the survey are answered more quickly and more uniformly per participant (Galesic and Bosnjak Reference Galesic and Bosnjak2009). The notion of “satisficing” was first introduced by Krosnick (Reference Krosnick1999). Krosnick proposed that respondents either devote considerable cognitive effort or little to no effort to answer survey questions. In the latter case, respondents may seek to generate answers quickly based on little thinking or minimal cognitive workload.
Higher education research finds mixed results of accuracy and exam length (Jensen, Berry, and Kummer Reference Jensen, Berry and Kummer2013; Brunello, Crema, and Rocco Reference Brunello, Crema and Rocco2018) in different circumstances. For example, Jensen, Berry, and Kummer (Reference Jensen, Berry and Kummer2013) find no effect in cognitive fatigue due to longer exams, but students perceive subjective fatigue the more prolonged the exam. We expect the process of casting ballots to be more similar to taking a survey than an exam or an incentivized survey due to the optional nature of the environment. Voters are not punished for making mistakes as they are in test environments, and there are no monetary or other external incentives for taking deliberate time to fill out the ballot. Instead, many people vote out of intrinsic motivation, such as civic duty or by a desire to vote on a single race, often at the top of the ticket. Therefore, the longer the ballot, the more likely voters will be asked to vote on issues and candidates they have never heard (Palfrey and Rosenthal Reference Palfrey and Rosenthal1983).
Regardless of the more complex interactions between ballot length and psychological effects on voters, ballot length is inherently expected to relate to voting errors due to the increase in opportunities for errors to occur as length increases (e.g., more questions mean more potential for errors). Despite this expectation or the reason for an increase in errors, the potential effects on the voting system remain; voting errors lead to delays in the ballot scanning process and, therefore, the potential for long voter wait times.
Finally, technical issues are also more likely to arise as the ballot’s complexity and length increase simply because the process leads to more pages being entered into a machine. Thus, we expect that the longer the ballot, the more voters will experience errors when entering their ballots into the ballot-scanning machine.
Data and Methods
Our data offer a unique and novel way to investigate ballot errors. These include three sources: (i) ballot scanner log files from in-person voting in each precinct in Rhode Island,Footnote 2 (ii) the characteristics of the ballot in each jurisdiction, and (iii) demographics from the 2016 five-year American Community Survey (ACS).
We attained the data on ballot errors from the Rhode Island Board of Elections (BOE). We utilize log files from ES&S DS200 optical scanners used in every precinct in Rhode Island for the 2018 RI Midterm election. The RI BOE distributed a total of 555 ballot scanners to 421 precincts statewide, and the RI BOE oversaw all precincts and voting machines.
DS200s record every action that the machine makes while in election mode and stores those actions in a transaction log. Figure 1 presents a sample DS200 log file for illustration purposes. Each data file per DS200 log contains an “event code” (i.e., an identification code that corresponds to an event type and description) for each attempt to use the machine. Each row of data directly corresponds to a recorded event within the machine. We cleaned the transaction log files and imported them into workable Comma Separated Variable (CSV) files from their raw log format for the analysis.
Excerpt raw DS200 ballot scanner log file.
Note. An error-free scanning observation is identified in Lines 6–9. Lines 10 and 11 identify an error that led to a returned ballot. Lines 1–5 indicate a scanning observation that contained an error but was accepted by the voter. The timestamps are used to calculate the duration of the corresponding observation.

Log files record successful scans (i.e., when the scanner accepts a ballot) in the log files by identifying the beginning (i.e., “Vote Session Started”; ballot is inserted into the scanner) and end (i.e., “Voting Session Complete”; when the ballot is counted) of the interaction, as shown in Lines 6 and 9 in Figure 1, respectively. By identifying the starting and ending codes of scanning observations, we identified an event description for each corresponding scanning observation, thus identifying if the scan was error-free or not. Lines 1–5 in Figure 1 are an example of an observation that includes a ballot error. In the example, the voter accepted an overvote error, meaning that the voter was alerted to an overvote error on their ballot, but the voter chose to cast their ballot despite the error. Lines 10 and 11 in Figure 1 highlight an observation that contained an error that resulted in the ballot being returned to the voter. In our analysis, the status of the ballot submission was identified as “Unsuccessful” if the scanner returned the ballot to the voter (Lines 10 and 11 in Figure 1) or “Successful” if the scanner accepted the ballot (Lines 1–5 and Lines 6–9 in Figure 1). A full breakdown of error types are provided in Supplementary Appendix A for all 555 DS200 logs with the number of observations and descriptive statistics on the durations of each observation. Supplementary Appendix B includes the amount of time errors held up the machine. These errors ranged from a single second on the lower bound to 80 minutes on the upper bound. The average delay with each error was 11 seconds. It is important to note that due to the scanning process’s anonymity, the DS200 does not record which sheet of a multi-sheet ballot is processed or where on the ballot the errors occurred. Thus, we cannot investigate if voters are more likely to make errors further along in the voting process (e.g., end of the ballot) or on specific questions, only if the occurrence of errors is correlated with length and complexity. Ballot length and complexity values are, therefore, total per ballot. With this limitation, we define the unit of analysis as the scanning event (i.e., the recorded interaction between the voter and the DS200) due to the lack of differentiation between a voter’s first attempt at scanning and their subsequent attempts in the presence of an error. This unit of analysis is expected to be larger than the number of ballots cast in the election due to the fact that some ballots are scanned more than once before a vote is completed. However, if this limitation affects the statistical analysis of these data, we expect it to bias our results away from finding evidence in favor of our hypothesis.
We used PDFs of the actual ballots for each of the 421 precincts to determine ballot length (an example is provided in Supplementary Appendix C). Finally, we normalized the scanning observation data and sample ballot data into a single database, resulting in the 416,657 scanning observations matched to precinct level ballot characteristics and voter demographics. A sample is available in Supplementary Appendix D. Since ballots are private, we do not have data on individual-level voter demographics; instead, we employ aggregate precinct-level voter demographics to account for variation between precincts that may affect the likelihood of ballot errors.Footnote 3 Demographics include median income (“Median Income”), the percent of the population with a bachelor’s degree or greater (“Percent College-educated”), and the percent of the population that do not identify as non-Hispanic White (“Percent non-White”).
Coding of Ballot Length Measurements
Sample ballots contained a combination of four possible question types: state elected offices, local elected offices, state ballot questions, and local ballot questions. During the RI 2018 Midterm election, the ballots distributed resulted in 39 unique ballots, one for each jurisdiction.
We include several measures of ballot complexity and length, including the number of pages (i.e., sides of a ballot) with questions listed (“Pages”; ranging from 2 to 4 pages with an average of 2.31), the number of office-based questions (e.g., Senate, House, Governor, Statehouse, Town Council; “Office Questions”; ranging from 10 to 18 with an average of 12.30), and the number of local referendums (“Local Questions”; ranging from 0 to 10 with an average of 2.44). We also include the maximum number of candidates a voter is instructed to select (“Candidate Select”; ranging from 10 to 27 with an average from 16.36) to account for races, such as Town Council, in which voters are asked to vote for more than one candidate. We also include a binary variable for if the ballot included more than one language (“Bilingual”).Footnote 4 This is included as it directly impacts Rhode Island’s ballot length and complexity because bilingual ballots contain each question listed in English followed by the Spanish translation, which increases the total word count and total space used on a ballot without additional offices or questions. It also directly increases the complexity since questions appear twice and voters could become confused by this presentation.Footnote 5
Coding of Voting Error Types
We classified errors based on the system elements (i.e., the human and the machine) or their interactions (i.e., HMI) that cause the error to occur (Meadows and Wright Reference Meadows and Wright2015). To classify each DS200 error code, we evaluated the DS200 training manual (Election Systems and Software 2011, p. 7–8) and the observation description generated by the scanner log files. The category of “No Error” contains events that did not contain an error of any type. Any ballot scan that prompted voter interaction with the DS200 beyond the traditional submission process is considered an error due to its potential impact on the voting processes within a polling location (e.g., long lines, voter disenfranchisement, and distrust in the voting system). We classify physical errors that occurred while a voter was interacting with the machine as a “HMI” error, such as “multiple ballots detected” or “ballot was not inserted far enough” (e.g., Belton, Kortum, and Acemyan Reference Belton, Kortum and Acemyan2015). These HMI errors are based on the voter’s actions, for example, trying to insert two sheets together or inserting a folded ballot. We classify errors that occurred due to the programming of the machine or due to the device’s functionality as “Machine” errors (e.g., “ballot jam,” “error scanning ballot,” and “ballot could not be read”; Gautam and Singh Reference Gautam and Singh2015). The final classification is the “Marking” error, which contains events that were caused by inappropriate pen markings. “Marking” errors may be caused by voters creating marks on restricted areas of the ballot (i.e., “unreadable marks”), marking too many selections for a single question (e.g., “voter accepted/rejected an overvote ballot”), or leaving the ballot blank (e.g., “voter accepted/rejected a blank ballot”). The total number of each type of error is included in Supplementary Appendix A.Footnote 6 Ballot characteristics are likely to have the most impact on human errors, here measured as HMI errors and Marking errors. However, we include Machine errors so that we do not exclude a potential area of errors and bias our models toward finding evidence of our hypotheses.
Utilizing these data, we test the following hypotheses:
H1: Longer ballots increase the odds of voting error occurrences.
H2: Ballots with more choices increase the odds of voting error occurrences.
Results
Table 1 presents the error rates observed in the DS200 log files during the RI 2018 Midterm election. While over 90% of scans resulted in “No Error,” there are relatively large error rates (7.10%) given the context of events (29,019 observed errors). The most frequent errors are “Marking” errors (4.31%), followed by “Machine” (1.57%) and “HMI” (1.22%) errors.
Overall error rates by error type in the 2018 RI Midterm election

Note. The number of observations are the number of scanning events. Scans with errors that are subsequently fixed are counted in both the applicable error category and in the No Error category.
Abbreviation: HMI, human–machine interaction.
Table 2 presents the bivariate relationship between the ballot characteristics and the different error types. The bivariate correlations suggest that our hypotheses are correct, in almost every case, our variables measuring the different elements of ballot complexity are positively correlated with ballot error, except in three cases: the number of pages, the number of Office Questions, and the number of candidate selections are negatively correlated with machine errors. To some extent, this is understandable as machine errors are those least likely to be associated with ballot characteristics. In addition, the negative relationship between pages and machine errors may be explained by the low probability of encountering ballot card related machine errors such as jams. This means that, in locations with multiple pages and ballot cards, the opportunity for encountering no error or other error types increases because the denominator increases so drastically.
Effect of ballot characteristics on voting errors (correlation coefficients)

Abbreviation: HMI, human–machine interaction.
* p < 0.0003.
** p < 0.00006.
*** p < 0.000006 (Bonferroni corrected).
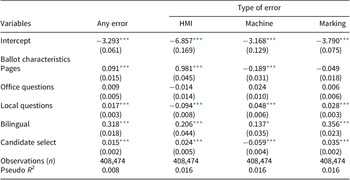
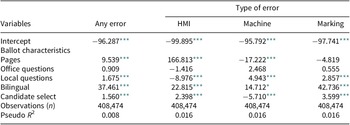
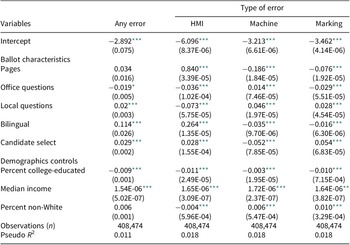
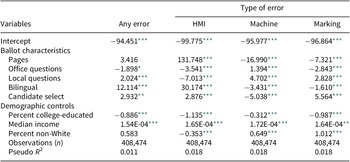
Table 3 presents the models without demographic controls, and Table 4 presents the change in the odds of an error occurring for a one-unit increase in the independent variable to help translate the coefficients into meaningful statistics. Table 5 presents the models with the full set of demographic controls, and Table 6 presents the corresponding predicted change in odds. Tables 3 and 5 define the logistic regression model coefficients as well as the significance and standard error for each value. Effect significance is considered at a Bonferroni corrected α of 0.0003.
Effect of ballot characteristics on the logarithm of the odds of encountering voting errors (logistic regression models)

Abbreviation: HMI, human–machine interaction.
* p < 0.0003.
** p < 0.00006.
*** p < 0.000006 (Bonferroni corrected).
Effect of ballot characteristics in percent change of the odds of encountering voting errors (change in odds)

Note. Coefficients represent the changes in odds for a one-unit increase in the variable. Change in odds is calculated by subtracting one from the exponentiated coefficients and then multiplying by 100 for the models in Table 2.
Abbreviation: HMI, human–machine interaction.
* p < 0.0003.
** p < 0.00006.
*** p < 0.000006 (Bonferroni corrected).
Effect of ballot characteristics on the logarithm of the odds of encountering voting errors with demographic controls (logistic regression models)

Abbreviation: HMI, human–machine interaction.
* p < 0.0003.
** p < 0.00006.
*** p < 0.000006 (Bonferroni corrected).
Effect of ballot characteristics in percent change of the odds of encountering voting errors with demographic controls (change in odds)

Note. Coefficients represent the changes in odds for a one-unit increase in the variable. Change in odds is calculated by subtracting one from the exponentiated coefficients and then multiplying by 100 for the models in Table 2.
Abbreviation: HMI, human–machine interaction.
* p < 0.0003.
** p < 0.00006.
*** p < 0.000006 (Bonferroni corrected).
Because our hypotheses are one-directional, we have no reason to expect an increase in ballot complexity to decrease errors, we focus here only on those items in which the models show a positive and statistically significant effect.
Within the models that do not include demographic variables (Tables 3 and 4), the models suggest that once accounting for the other types of ballot complexity characteristics, an increase in ballot pages results in an increased number of overall errors. In addition, an increase in the number of pages also increases the number of HMI errors. An additional ballot page has no significant effect on the probability of marking errors.
Likewise, once we consider the other elements of ballot complexity, additional office questions have no significant effect in any of the models. The addition of local ballot questions is significantly and positively related to an increase in the odds of encountering any error, machine errors, and marking errors. The effect of an additional candidate selection is significant and positively related to the likelihood of any error, specifically HMI and marking errors. Lastly, bilingual ballots are associated with increased errors across error types.
Table 4 helps us understand the magnitude of the results presented in Table 3. The results align with intuition: the number of pages of a ballot greatly increases the odds of experiencing an HMI error,Footnote 7 whereas having a ballot with two languages where questions are repeated dramatically increases the number of marking errors. Some of these increases are quite large: a single page increases the odds of an HMI error by 166%, and a bilingual ballot increases the likelihood of a marking error by 43%. Others are smaller; for example, adding a single local question to the ballot increases the likelihood of experiencing a marking error by 3% and a machine error by 5%.Footnote 8 Likewise, a one-unit increase in the number of candidates a voter is asked to select results in a 2% increase in the odds of experiencing an HMI error and a 4% increase in the odds of experiencing a marking error.Footnote 9 While these numbers may appear small, they are compounded as a ballot adds more local questions or candidate selections. So far, our models suggest that different ballot characteristics have more/less effects on the likelihood of experiencing an error. These somewhat inconsistent and sometimes negative results make sense when one takes the model as a whole: the number of pages is intuitively more likely to increase the rate at which a ballot is incorrectly inserted than the likelihood of making a marking error when controlling for the other elements of the ballot (such as the number of questions and selections). Likewise, the presence of a second language should increase the rate of marking errors more than the likelihood of a machine error when controlling for the number of pages being processed.
Tables 5 and 6 add in our demographic controls to see if any probability of errors based on the ballot characteristics is still present when controlling for population-level variables. This is particularly important for our bilingual ballot variable: since bilingual ballots are only available in areas with larger non-English speaking populations, this coefficient could simply be a product of the population and not the ballot. Similarly, our models could be influenced by voter education levels and income.
Despite the addition of these controls, our models remain relatively consistent.Footnote 10 An increase in the number of pages is positively correlated with HMI errors. Additional local questions are positively associated with an increase in machine errors and marking errors. An increase in candidate selections is positively associated with HMI and marking errors. Finally, bilingual ballots remain significant for HMI errors. However, once we account for population demographics, bilingual ballots no longer have significant correlations with machine or marking errors. Overall, the introduction of controls helps clarify that some errors are more likely in towns with high levels of non-White voters, and higher population-level education is correlated with fewer errors. However, even once we account for these demographic controls, ballot characteristics remain a source of increased scanning errors.
To understand the substantive effect of our findings, from here on we focus only on the results of the model that includes demographic controls (Tables 5 and 6). Figure 2 presents the percentage point increases in errors for a one-unit increase in the significant ballot characteristics compared to the observed percent error (Table 1). We focus here only on those that have a significant increase in the number of errors since we have a one-directional hypothesis, and there is no reason that we would expect a decrease in errors with more ballot complexity.
Effect of ballot length increase on ballot Errors.
Note. Graphs present the change in the percent of errors, out of the total scanning observations, expected with an additional unit of ballot length (and distributing a bilingual ballot as opposed to a monolingual ballot).

Overall, we find that there would be an increase in the percent of any errors occurring by 0.13 percentage points for a single additional local question,Footnote 11 0.79 percentage points if there is a bilingual ballot, and 0.19 percentage points for an additional candidate selection. Substantively, in our sample, an increase of about 545 errors would result for each additional local ballot question, 3,238 more errors when there is a bilingual ballot, and 789 more errors for each additional candidate selection.
Looking specifically at the types of errors, we find that the percent of expected HMI errors increases by 1.56 percentage points for each additional page, which in our data equates to an additional 6,383 HMI errors. Likewise, for an additional candidate selection listed on the ballot, we find a 0.03 increase in the expected percent of HMI errors. Again, in our sample, that would be approximately 142 additional HMI errors. Finally, bilingual ballots increase the percentage of HMI errors by 0.36 percentage points (or an increase of 1,480 errors given our N).
Machine errors increase by 0.02 percentage points for an additional office question on the ballot. Again, using our data, that would be an expected increase of 89 additional machine errors. Furthermore, there is an increase of 0.08 percentage points in the expected percent of machine errors (i.e., an increase of 298 errors) with an additional local question. Finally, marking errors go up by 0.12 percentage points with each additional local question and 0.23 percentage points with each additional candidate selection. In our data, this corresponds to an additional 477 and 936 additional errors, respectively.
While the percentage point changes may appear small, given the number of voters who vote in an election, the percentage point increases are substantively meaningful. Particularly given that errors result in voters having to take between 1 second and 80 minutes longer to vote.Footnote 12 This means that an increase of a few hundred errors can drastically increase the amount of time a voter (and those behind them in line) spends casting their ballot and a meaningful difference in how a voter experiences voting.
Discussion
In this paper, we find that measures of ballot length affect specific types of voting errors (i.e., HMI, Machine, and Marking). Our findings generally align with Selb (Reference Selb2008), even though we approached the research differently: ballot length and complexity affect voting error rates.
The models presented demonstrate that ballot length and ballot complexity affect the odds of experiencing voting errors. The additional significance of demographic variables indicates that, in general, areas of lower educational attainment and median income experienced more voting errors. Communities with larger percentages of non-White voters experienced increases in the odds of machine and marking errors. This information alone is important from a resource planning and voter education perspective. These findings can help identify areas that require additional voter education material, extra personnel to assist voters through the voting processes, and precincts that may benefit from more resources, such as additional scanners. For example, machine errors, such as ballot jams, were correlated with lower education and more non-White voters. These areas may require additional machines and resources so that there are alternative ways to process a ballot when one is out of use due to a machine error.
Further, these findings identify that resource allocation plans should be adjusted to equitably accommodate voters and poll workers at the precinct-level rather than treating all precincts as equal. The number of poll workers and voting equipment are determined frequently only by the number of expected voters. Nevertheless, our models show that in elections with more complex ballots, dealing with machine jams, human–machine errors, and marking errors are likely to cause delays indicating the need for election officials to consider both ballot complexity and precinct-level demographics when preparing for elections. Likewise, and more to the point, with respect to ballot characteristics, our models indicate that increases in the number of ballot pages, local ballot questions, and the number of candidate selection opportunities increase the odds of voting errors. Considering the error rates in Table 1, 1.22% of Rhode Island scans contained a “HMI” error. The models imply that adding a single ballot page across all precincts would increase the odds of “HMI” errors by 131.75%—an increase in the error rate to 2.78% (or an increase of 6,383 errors with 11,366 total “HMI” errors).
Using these data, election officials in jurisdictions that utilize paper ballots can use the characteristics of their ballots to help determine the number of poll workers and machines needed to run Election Day(s) smoothly and efficiently, decrease the amount of time voters spend casting their ballots, and increase the reliability of the results. Signage can be implemented to remind people of how many pages there are and how to fill in a multiple language ballot correctly in locations with complicated ballots. Additionally, the number of poll workers and the amount of voting equipment can be increased to decrease the wait time for those who would otherwise be held up by someone who has made an error on their ballot or jammed the machine.
As with all research, our data had several limitations that future research could improve. Since our data source is an anonymous account of ballot scanning events, it is impossible to determine a voter’s intention. Thus, this methodology considers all blank ballots as errors, regardless of voter intention. Future research could employ experimental designs to investigate and elaborate on this finding further, however, the proportion of this Marking error was relatively small (i.e., 14.4% of Marking errors and <1% of all observations) minimizing the effect of this limitation. Specific voter characteristics, such as their level of experience with the ballot type or ballot scanner, cannot be captured from anonymous data. These factors may affect the odds of experiencing voting errors, although they must be observed via controlled experimentation to protect voter anonymity. Another limitation within this analysis is that the undervote voting error (i.e., when some questions on a ballot are not marked while others are) is unable to be addressed because the scanner does not log a single skipped question as an error.Footnote 13 Future research should assess how a ballot affects the odds of voting errors from a more holistic perspective. Additional research can also be conducted for different types of elections (e.g., midterm elections and primary elections). Additional scanning or ballot marking devices should be included and statistically controlled to further improve this model’s robustness. Including other state/county specific variables would allow for the assessment of a broader range of ballots.
Furthermore, our dataset only contains observations from in-person ballot scanning. Marking errors pose a particular issue to alternative voting methods, such as vote-by-mail and absentee voting, in which ballots are centrally scanned and counted. While an in-person voter has the opportunity to correct errors on their ballot, assuming they cast their ballot into a scanner themselves, a centrally counted ballot with marking errors has little to no opportunity to be corrected (Alvarez, Beckett, and Stewart Reference Alvarez, Beckett and Stewart2011). Given the push toward vote-by-mail/absentee ballots during the 2020 General Election due to the Coronavirus Pandemic (Sepulveda and Jacobson Reference Sepulveda and Jacobson2020), the impact of a voter’s inability to correct ballot errors must be better understood. These research methods can be applied to alternative voting systems, such as central cast (e.g., vote-by-mail and absentee voting), to quantify the effect of errors in an environment where voters do not have the ability to address them.
Overall, however, the “big data” available in ballot scanning logs, such as the 555 logs we utilize here totaling 1,306,378 lines of code, may prove to be a good source for future research on these questions.
Conclusions
Through our analysis, we find further support that there is an effect of ballot length and ballot complexity on voting error. While more complex ballots increase the voter’s ability to participate in democratic governance, one of the consequences is an increase in voting errors, which can lead to long wait times and voter disenfranchisement, and low voter confidence (Ansolabehere and Shaw Reference Ansolabehere and Shaw2016; Everett, Byrne, and Greene Reference Everett, Byrne and Greene2006).
Additionally, we have provided a methodology for processing and analyzing ballot-scanning machine log files and applied statistical methods to assess ballot-scanning and marking errors that others may use in future studies to test these effects under other conditions in different contexts. From a data perspective, we demonstrate the value of log files generated from voting equipment. While difficult to obtain, voting equipment log data provide insight into voting systems, voter behavior, and voter disenfranchisement that would otherwise be challenging or impossible to holistically capture, let alone in observations. Finally, our results suggest that assessing the ballots distributed to voters before an election can provide insight into estimated marking and scanning error behavior, which could assist with effective election preparation.
Supplementary Materials
To view supplementary material for this article, please visit http://doi.org/10.1017/spq.2021.24.
Data Availability Statement
Replication materials are available on SPPQ Dataverse at https://doi.org/10.15139/S3/SIAZLY (Pearson-Merkowitz et al. Reference Pearson-Merkowitz, Bernardo and Macht2021).
Acknowledgments
The authors thank the Rhode Island Department of State, the Rhode Island Board of Elections, the Democracy Fund, and the University of Rhode Island College of Engineering for funding this research. The authors also thank Dr. Rachel Schwartz, Dr. Valerie Maier-Speredelozzi, Rachel Bartels, and James Houghton for their invaluable support throughout this research.
Funding Statement
This research was funded in part by the Democracy Fund (R-201802-02227; R-201903-03975) and the Rhode Island Board of Elections (AWD06649/0007260) in collaboration with the University of Rhode Island Voter OperaTions and Election Systems (URI VOTES) project.
Conflict of Interest
The authors declared no potential conflicts of interest with respect to the research, authorship, and/or publication of this article.