


Shortly after the onset of the financial crisis of 2008–9, the economies of the developed world entered a period of weak demand and rising unemployment broadly known as the great recession. The economies of nearly every member of the Organisation for Economic Co-operation and Development (OECD) contracted between the middle of 2008 and end of 2009, by an average of 1.65%.Footnote 1 During the 18 months from July 2008 to the end of 2009, 16 countries held elections.Footnote 2 Their economic performance was similarly dismal to that experienced by the OECD in general, with every country experiencing at least two quarters of negative growth in this period and 13 of 16 experiencing negative growth in the quarter of or before the election.Footnote 3 If there were a single period in the last half-century in which voters should have uniformly punished their governments, one would expect it to be the great recession of 2008–9. Surprisingly, relative to their performance in the preceding election, the executive's party lost vote share in only 9 of 16 elections.Footnote 4 We argue that this outcome is not a fluke, but rather is evidence that voters or their information sources, contrary to the orthodox assumptions about the economic vote, evaluate national performance with respect to economic outcomes in other countries. Voters, in short, benchmark across borders.
Despite scholarly preconceptions that electoral accountability must exist, empirical studies often reveal a more nuanced and less stable relationship between economic performance and the incumbent vote (Cheibub and Przeworski Reference Cheibub, Przeworski, Przeworski, Stokes and Manin1999; Dorussen and Palmer Reference Dorussen and Palmer2002; Paldam Reference Paldam, Norpoth, Lewis-Beck and Lafay1991). Evidence that voters punish incumbents for poor economic outcomes emerges often but somewhat sporadically, and when it does appear, its magnitude is often weak (Duch and Stevenson Reference Duch and Stevenson2008; Fiorina Reference Fiorina1981). Scholars have been able to show that part of this instability arises from context: Voters, in general, hold governments more accountable for economic outcomes when political and institutional accountability for outcomes is clear (Powell and Whitten Reference Powell and Whitten1993; Whitten and Palmer Reference Whitten and Palmer1999; but also see Samuels and Hellwig Reference Samuels and Hellwig2010; Royed, Leyden, and Borrelli Reference Royed, Leyden and Borrelli2000); when economic shocks are unexpected (Palmer and Whitten Reference Palmer and Whitten1999); when voters’ pre-existing party attachments are weaker (Kayser and Wlezien Reference Kayser and Wlezien2011); and when more of the economy is under the national government's, rather than under the international economy's influence (Duch and Stevenson Reference Duch and Stevenson2008; Hellwig Reference Hellwig2001). Even considering political and institutional context, however, much instability remains (Anderson Reference Anderson2007; Dalton and Anderson Reference Dalton and Anderson2011).
Many scholars circumvent this problem by switching to survey-based subjective perceptions of economic performance that yield a more stable relationship between reported economic perceptions and reported vote or vote intention (Lewis-Beck and Stegmaier Reference Lewis-Beck and Stegmaier2000). Sidestepping questions about the endogeneity of economic perceptions—whether voters’ political preferences color their perception of economic performance depending on whether a co-partisan is in office (Duch, Palmer, and Anderson Reference Duch, Palmer and Anderson2000; Evans and Anderson Reference Evans and Anderson2006; Wlezien, Franklin, and Twiggs Reference Wlezien, Franklin and Twiggs1997)—it remains clear that a relationship between perceived economic performance and the vote is not the same as showing electoral accountability for actual economic outcomes.
We argue that at least some of the varying size and instability of the economic vote emerges from a failure to understand whether and how voters benchmark. For electoral accountability to function properly, it is imperative that voters systematically punish elected officials for those outcomes for which they are responsible or at least potentially responsible. Yet how do voters distinguish a strong from a weak performance? No economic figure is innately high or low; what passes for booming growth in one period or place might be considered sluggish in another. To assess economic performance, voters necessarily must compare an outcome to others, which begs the question of how and against what benchmark they compare. Puzzlingly, evidence of comparative behavior has emerged from work in cognate fields, such as yardstick competition in economics, that shows that local governments are often punished for imposing higher tax rates than those of neighboring jurisdictions; work on electoral accountability in general, however, neglects the question of cross-border comparison.
Implicit in research designs that do not benchmark economic performance at home against that abroad is the assumption that voters do not assess performance relative to period-specific expectations. Thus, to return to our original example, in a model that does not benchmark across borders, zero percent annual growth would be considered low in a year such as 2008, even though, in the international context, it was a strong performance. Likewise, in a cross-section time-series dataset without cross-national benchmarking, the higher growth rates of the 1950s would be expected to provide an advantage to incumbents at the polls, whereas the slower 1980s would hinder them, even for governments that might have exceeded period expectations by the same amount. If voters indeed assess their governments in partial comparison to those abroad, models that neglect cross-border benchmarking may systematically misrepresent voter behavior and incorrectly estimate the economic vote.
Equally worrisome is another implied assumption about how voters attribute responsibility. Designs that predict the economic vote on only past and present domestic economic performance assume that voters hold governments equally accountable for domestic shocks, for which governments may be responsible, and international shocks, for which they clearly are not, because both are components of national economic measures. We make this assumption explicit and demonstrate that voters, or those who provide information to voters, benchmark across borders, not just across time.
Curiously, most research on the economic vote makes no clear assumption about how voters receive and process economic information, restricting itself to noting an empirical relationship between economic outcomes and the incumbent vote.Footnote 5 Research that does delve into the voter's cognitive decision process broadly depicts voters as either sophisticated decision makers who extract a competence signal from a comparison of recent and past outcomes or as blindly retrospective respondents to economic stimuli. A finding, such as ours—that incumbents are held accountable for the deviation from an international benchmark—does not necessarily weigh in on this debate. Benchmarking could suggest that at least some voters are informed and sophisticated. It is also possible, however, that the media or other sources of information already place economic performance in international context when they report it to the public. Thus, when we state that voters benchmark, we do not necessarily imply that they engage in a cognitive comparison. They could simply be responding to pre-benchmarked information.
This article follows a simple conceit. We test for benchmarking in both aggregate- and individual-level samples by decomposing two economic aggregates—growth in real gross domestic product (GDP) and the unemployment rate—into global and local components. The electoral response to these components then supports inferences about benchmarking: If voters do not benchmark, they should respond similarly to the local and global components of the economy; if they do benchmark, they should respond to the local component (i.e., the deviation from the international benchmark) more than to the international component itself; indeed if they benchmark completely they should not respond to the benchmark (i.e., the international component) at all. Our findings reveal strong evidence of cross-national benchmarking on economic growth both at the aggregate and at the individual level, across time periods, and across subsamples. These findings imply that either voters engage in cognitive comparisons themselves or that information sources such as the media and, more opportunistically, politicians place economic information in context when reporting it. We present evidence that economic news is “pre-benchmarked,” suggesting one possible mechanism for our main finding.Footnote 6
Most of the remainder of this article poses and tests hypotheses about cross-national benchmarking in national elections. In addition to addressing several puzzles in the literature, our findings bear on fundamental questions of representation such as how voters evaluate their leaders and hold them accountable. That voters punish or reward incumbents for the deviation from a measure of international performance—and how they do so—is critical to understanding why electoral rewards and punishments vary even for similar economic performance at different times. Models that benchmark across borders should not only provide better estimates but also reveal a fundamental feature of electoral behavior key to our understanding of accountability: Whether an economic outcome is understood as strong or weak depends in no small part on the international context.
The broader significance of our findings is also worth considering. Scholars have often argued that the economic vote is the best argument for democracy, because it demonstrates the control of the governed over those who govern. The instability and sporadic weakness of the economic vote in different contexts and time periods, however, have led some to question whether even this argument for democracy holds (see, for example, Cheibub and Przeworski Reference Cheibub, Przeworski, Przeworski, Stokes and Manin1999). By showing one way in which the effect of the economy on electoral outcomes has been systematically underestimated, we implicitly buttress the argument that the governed can and, indeed, do hold their elected leaders to account. This argument also matters for representation because elected officials who fear removal have been shown to hew closer to their constituents' preferences (Canes-Wrone, Brady, and Cogan Reference Canes-Wrone, Brady and Cogan2002).
Our findings also bear implications for the understanding of autonomy of the nation-state. Contrary to the assumption of much research in comparative politics, states are not fully independent units. The standards by which voters judge their governments, at least with respect to economic growth, are influenced by the performance of governments abroad. What constitutes good performance is a matter of outcomes not only in a given state but also in other states that serve as a benchmark against which local outcomes can be assessed.
The third broad implication of this article is the most tentative. We have only been able to test in a limited fashion the mechanisms by which benchmarking comes about. Nevertheless, if future research does confirm that the media “pre-benchmark” by reporting more positive news when countries outperform their peers, then this result suggests one answer to a key puzzle of democracy: how unsophisticated and poorly informed voters are able to hold their elected officials to account, even in seemingly sophisticated ways.Footnote 7
BENCHMARKING AND ACCOUNTABILITY
Previous Literature
We are not the first to employ comparative economic performance as a predictor of the vote. In fact, the article that first underscored the importance of clarity of governmental responsibility for the economic vote (Powell and Whitten Reference Powell and Whitten1993) used national deviations from an international economic mean as the key independent variable. Although clarity of responsibility, has become a central feature in cross-national studies of the vote, comparative economic performance has been largely ignored. One explanation for this omission might be that benchmarking was only incidental to the Powell and Whitten paper and to those of the small number of subsequent scholars who employed comparative economic measures. No previous work has focused on cross-national benchmarking and the economic vote. A second and related explanation is that neither Powell and Whitten nor any other previous studies explicitly benchmarked.
Consider the difference between two types of cross-national comparison: (1) including only a measure of the deviation in economic performance from an international average and (2) including measures of both the deviation in economic performance and the average performance. Benchmarking, of course, only exists when voters respond to the deviation from the benchmark more than to the benchmark itself, which requires measures of both components. This article is the first to test explicitly for benchmarking in the economic vote, and it is also the first to intend to do so. Powell and Whitten (1993) make no reference to benchmarking and treat their comparative measure much like a national measure. Chappell and Veiga (Reference Chappell and Veiga2000) use, among other alternatives, a comparative measure of economic performance but never in the same model with national measures, precluding any determination of whether relative economic performance differs from possible benchmarks. The two papers that most closely approach ours in explicit intent address different types of comparison: Duch and Stevenson (Reference Duch and Stevenson2010) argue that voters extract competence signals from comparing variances in economic performance across countries, and Palmer and Whitten (Reference Palmer and Whitten1999) implicitly benchmark but across time rather than across countries, showing that unexpected changes in economic aggregates have a larger effect on the incumbent vote. In the present article, we offer the first explicit investigation of benchmarking of economic performance across borders.
Appropriate to an article with this focus, we also offer the first investigation into how voters benchmark. Previous cross-national comparisons of levels, whether incidentally or intentionally comparative, uniformly assume that voters compare national performance to an international mean that weights states equally regardless of size, prominence, or proximity. This article, in contrast, examines three alternative benchmarks and leverages the results to shed light on the heuristics that voters use to punish incumbents: Do voters compare national performance to that of all states, large and proximate states, or economically prominent states?
Voting aside, abundant research in other domains of social science supports the proposition that individuals are sensitive to comparative assessments. At the most fundamental level, research on individual happiness in both economics and social psychology consistently shows that comparisons in economic well-being between individuals exert a strong effect on happiness (Easterlin Reference Easterlin2003; DiTella and MacCulloch Reference DiTella, Robert and MacCulloch2006). The magnitude of this comparative effect is nicely demonstrated by Luttmer (Reference Luttmer2005), who observes that similar decreases in happiness emerge when individual income falls as when neighbors’ income increases. Moreover, as the Easterlin Paradox highlights, mean happiness does not increase over time despite rising incomes—likely because, as Clark, Frijters, and Shields (Reference Clark, Frijters and Shields2008) demonstrate, individual happiness depends on comparisons to others. Keeping up with the neighbors may matter more than improvements in personal income, and comparative assessment may be built into human assessments of subjective well-being.
Moving to a much higher level of aggregation, one again finds evidence that individual utility—and presumably decisions that depend on it such as vote choice—hinges on comparison. Research on yardstick competition, predominantly in economics, is predicated on the idea that voters compare outcomes across jurisdictions (Besley and Case Reference Besley and Case1995). Numerous studies in this field demonstrate that voters systematically compare policy outcomes across districts and/or countries. Most of this literature simply assumes an electoral mechanism and looks for evidence of policy output convergence, most often in tax levels.Footnote 8 If voters compare and hold local governments accountable for differences in tax rates across municipalities, why should they not do so for economic performance across countries?
Indeed, some research at the international level suggests precisely such comparative assessment. Several scholars have demonstrated that voters in more open economies—whether measured in trade or capital flows—hold incumbents less accountable for economic outcomes than do their counter parts in less open economies (Duch and Stevenson Reference Duch and Stevenson2008; Hellwig Reference Hellwig2001; Hellwig and Samuels Reference Hellwig and Samuels2007). Duch and Stevenson assert that when international influences contribute more to national economic performance, voters recognize that the economy is a weaker signal of incumbent competence and hold incumbents less accountable for outcomes. Our benchmarking results suggest a possible alternative explanation for their finding: The larger international component of an open economy leads to smaller deviations from it and, hence, a weaker economic vote (Kayser and Peress Reference Kayser and Peress2012).
How Sophisticated Must Voters Be?
How voters assess incumbent performance is of intrinsic importance to the proper understanding of democratic processes and electoral accountability. In recent years, however, scholars using measures that fail to capture cross-national benchmarking have come to question how systematically voters actually hold governments accountable for poor outcomes and even the existence of electoral accountability itself (Cheibub and Przeworski Reference Cheibub, Przeworski, Przeworski, Stokes and Manin1999). Properly functioning accountability demands voters who consistently, if not always perfectly, identify and punish poorly performing elected officials. Yet researchers have frequently depicted voters as “blindly retrospective” judges of governmental performance who punish subnational politicians for national outcomes (Gelineau and Remmer Reference Gelineau and Remmer2006; Hansen Reference Hansen1999) or other incumbents for acts of God beyond their control such as drought, floods, shark attacks (Achen and Bartels Reference Achen and Bartels2002), or even the outcomes of local athletic contests (Healy, Malhotra, and Mo Reference Healy, Malhotra and Mo2010).
How informed are voters about developments abroad? It surely is not the case that all voters inform themselves of economic outcomes in other countries. In fact, public opinion surveys have long depicted respondents as uninformed about policy outcomes even in their own countries (Campbell et al. Reference Campbell, Converse, Miller and Stokes1960). We do not dispute this finding. We do, however, assert that for benchmarking to emerge only one of two criteria needs to obtain: (1) a minority of voters need to be sufficiently aware of performance abroad, or (2) information on the state of the economy must be placed in international context by the media or rival politicians before it is passed to otherwise unsophisticated voters.
We have known since at least Kinder and Kiewiet (Reference Kinder and Kiewiet1981) that voters respond more to aggregate (sociotropic) economic conditions than to individual (pocketbook) welfare when making their vote decisions. What we know less about is how sociotropic voting occurs. One literature that lends credence to the possibility that at least some voters may be sufficiently sophisticated to draw cross-border comparisons emerges from both formal and empirical work. Ferejohn (Reference Ferejohn1986) has developed an iconic model of electoral accountability in which voters evaluate their governments compared to expectations. Duch and Stevenson (Reference Duch and Stevenson2008) model and find empirical support for even more sophisticated voters who can compare the variance of economic outcomes across countries to extract a signal about incumbent competence that then influences their vote. Most recently, Gasper and Reeves (Reference Gasper and Reeves2011) ingeniously use U.S. county-level data to demonstrate that voters are sufficiently sophisticated to allocate electoral accountability correctly to the president when he rejects governors’ request for federal assistance to respond to natural disasters. Such results contrast sharply with the naive depiction of voters in Campbell, Converse, Miller and Stokes (Reference Campbell, Converse, Miller and Stokes1960) and elsewhere.
It is also possible that voters are naive and that benchmarking emerges from the media's pre-benchmarking economic information by reporting it in context. This could take the form of media reports making explicit comparisons such as “German growth is the slowest among developed large countries,” or noncomparative reports about economic outcomes that simply show less enthusiasm for, say, 2% growth when other states are growing faster. Few studies have directly examined the media's role in the sociotropic vote. Ansolabehere, Meredith, and Snowberg (Reference Ansolabehere, Meredith and Snowberg2008), however, find that information about unemployment comes primarily from media sources. Unlike gasoline prices, the other variable they examine, unemployment rates are abstract and infrequently observed, so voters are more dependent on the media. By this logic, voters’ information about economic growth is likely also media driven because it is even less directly observable than unemployment. Other work by Hetherington (Reference Hetherington1996) finds that media effects can strongly influence voters' understanding of the economy; indeed the author finds that media effects shifted the electorate's perception of the economy sufficiently far to cost George H. W. Bush the 1992 election. Even the sophisticated allocation of blame by voters for the response to natural disasters documented by Gasper and Reeves (Reference Gasper and Reeves2011) must be transmitted by the media.
We remain theoretically agnostic throughout much of this article. With aggregate-level data, both mechanisms—an internationally informed minority of voters and information sources that pre-benchmark economic information—could yield observationally equivalent results. Nor are they mutually exclusive. We address the mechanisms for benchmarking by incorporating media coverage of economic news. Our findings lend some support to the pre-benchmarking mechanism—media reports of economic conditions are more positive in times of high benchmarked growth. Results in the supplemental Online Appendix (available at http://www.journals.cambridge.org/psr2012013) also cast doubt on the sophisticated voter mechanism by showing that high-information voters benchmark no more than than their less-informed counterparts.
Decomposition and Benchmarking
We decomposed economic variation into local and global (a.k.a. international) components in three ways, each with distinct implications for how voters compare performance across countries. In all three decompositions we simply subtracted international economic performance—growth and unemployment—from the respective measure of national economic performance such that

where c indexes country and t time. Voters who compare their country's growth to that abroad should reward incumbents when ylocal c,t is positive—that is, when national growth exceeds global growth—and punish them when it is negative. Local unemployment, in contrast, should decrease the incumbent's vote when positive and increase it when it is negative. The international component of real growth, yglobal c,t, should have no effect on the vote if all voters benchmark fully or if all economic information is pre-benchmarked by the media. If some but not all voters benchmark, or if all voters partially benchmark, or if some economic information is contextualized by the media, we expect the international component to have an effect on the vote but a smaller one than the local component.
Of course, voters and the media can compare national performance to numerous international measures. Are they more likely to compare local performance to that of larger (and more visible) countries? Are neighboring countries, more prominent countries, or more internationally economically integrated countries more frequent or influential benchmarks than distant ones? The design of the international component will affect what type of benchmarking is captured. An international component that poorly matches the benchmark that voters use, if any, will deliver weak results and run the risk of type II error: the absence of evidence might be understood as evidence of absence. Accordingly, we designed the international component, yglobal c,t, in three distinct ways, each intended to capture one plausible comparison group for voters.
Median Performance
When yglobal c,t is defined as the sample median for the year in which each given election took place, the international and national components of growth test whether voters compare national performance to an international performance measure that disregards the size, economic integration, or distance of other other states. This is the simplest measure and is intended as a baseline. Although it may be a priori improbable that voters weight all foreign states equally, this measure of yglobal c,t has the advantage of obvious and strong exogeneity: Domestic economy policy and outcomes cannot have much effect, if any, on median international performance.
It is interesting to note that the local component derived from this international measure is most similar to the difference from the international mean used in Powell and Whitten (1993). However, by also including the international component in our regression models, we are able to test whether voters benchmark. Powell and Whitten could make no such judgment, which possibly explains why their improved results over previous research were solely attributed to their other innovation: clarity of governmental responsibility.
Principal Components
The use of the median as the international benchmark makes two assumptions that we now relax. First, the measure assumes that there is a single global component that drives the correlation in economic performance across countries. Second, the measure assumes that all countries are equally affected by this global component. Voters may have the capacity to discern multiple global components that drive international correlations in economic performance. For example, Asian economies may operate relatively independently from those of the United States and its major trading partners. Moreover, voters may have the capacity to discern that certain countries are more or less sensitive to these global components. Certain countries and regions are more integrated into the international economy than others. The principal components decomposition offers a means of empirically identifying which countries’ and regions’ economies covary the most.
More specifically, let Fac1t and Fac2t be the factors that drive voters' expectations for the economy. Voters in country c form expectations that are linear in Fac1t and Fac2t, but voters in different countries place different weights on these two factors. We denote these weights by FacLoad1c and FacLoad2c. We assume that economic growth (for example) is governed by

where εc,t is an unexpected shock to the economy due to incumbent performance. Assuming that εc,t is mean zero, we can estimate this model by applying the principal components decomposition to the matrix of economic data. Global growth, the voters’ expectation for growth, then becomes

The Appendix provides the full details, but a few facts suffice to convey what the principal components measure of the international economy captures. Two dimensions capture 41% and 13% of the variance in growth, respectively. Factor loadings identify the first as countries’ integration into the international economy (factor 1) and the second as regional differences between clusters in North America and Europe on one hand and East Asia on the other. The global economic component for each country accounts for its integration into the international and regional economies. The local component of growth in a fully autarkic state (with FacLoad1c = FacLoad2c = 0) would therefore be the same as non decomposed national growth. This measure offers the advantage of capturing international and regional economic covariation with other economies depending solely on their integration into the world economy. Those countries at the core of the world economy will covary more and hence contribute more to the international benchmark.
Trade Weighting
It is also quite plausible that voters compare their national economies to larger and more proximate countries rather than to those that are more integrated into the international and regional economy (principal components) or to the international median. Neighboring countries are more likely to share a common language, culture, and history. Size and proximity may also contribute to media coverage. It is more likely that voters and the media know more about large neighboring states than small distant ones. It is also more likely that (sm)all countries compare themselves to large countries than vice versa.
Rather helpfully, both proximity and size are key elements of the common gravity model of international trade and allow us to capture both effects through trade weighting. The influence of each foreign country on the international economic component is weighted by the proportion of exports from a given country that are sent to it. As such, countries that import more from a given country—most often larger and more proximate countries—figure more heavily in its international component (benchmark). This is an imperfect measure but one that captures complex relationships quite well.
Estimating this trade-weighted measure required collecting economic data not only from the sample countries—22 OECD countries for the aggregate analysis and 17 CSES (Comparative Study of Electocal Systems) countries for the individual-level analysis—but from their trading partners as well. To limit data collection to a manageable size, we used only the top five export markets for each country-year to construct the trade-weighted international economic component. Even with this constraint, the set of countries that contributed data to the international component—including all three international components—expanded substantially.
Combined with the other two types of decomposition, we are now prepared to test for three distinct and plausible types of benchmarking, each of which varies the set of countries against which voters wittingly or unwittingly compare their national economic performance. We do this first with aggregate-level data to maximize the number of country-year observations and then at the individual level to control for attributes of voters and parties and to investigate how benchmarking comes about.
AGGREGATE-LEVEL EMPIRICS
Data and Method
We begin our analysis of economic voting with an aggregate-level analysis. Our dataset covers 22 OECD countries and 385 elections ranging from 1948 to the present.Footnote 9 It builds on a dataset used in Urquizu-Sancho (Reference Urquizu-Sancho, Schofield and Caballero2011), which included elections until 2004. We expanded the dataset and filled in missing values using several sources, including Adams Carr's Election Archive, the Inter-Parliamentary Union, and various government websites.
Our main dependent variable is the vote share of the leader party, which we define as the party of the prime minister for parliamentary democracies and the party of the president in presidential democracies. To construct this variable, for each election, we considered the prime minister corresponding to the most recent noncaretaker government before the election. A small number of missing values were generated because of nonpartisan prime ministers. One consistent finding in the literature on cross-national economic voting has been that not all governing parties share the same electoral fate. Researchers have found that voters may focus more on the party of the prime minister than on the other parties (Stevenson, Reference Stevenson1997) and that minor coalition members can sometimes even increase their vote share when that of the larger members decline (Duch and Stevenson Reference Duch and Stevenson2008). This motivates our use of the leader party's vote share as the dependent variable.
Our main independent variables are growth in real GDP, unemployment rate, and versions of these variables decomposed into local and global components. For each country in our dataset, we collected economic data even for years for which we did not observe elections. Collecting these data was necessary for constructing the benchmark levels of growth and unemployment. We also collected economic data for countries not in our dataset. This was necessary for forming the trade decomposition, which is based on the (weighted) growth and unemployment of each country's trading partners. Growth is measured relative to the prior year, and unemployment is measured as the mean harmonized quarterly unemployment rate in the election quarter and the previous three quarters. Both the growth and unemployment data were obtained from the OECD, which provides data for OECD countries as well as some non-OECD countries. In cases where the OECD did not provide the data, we turned to the International Monetary Fund's International Financial Statistics database.
Aggregate-level Results
If voters sanction incumbents for poor economic performance, regardless of whether this poor performance is of local or international origin, then global recessions should lead to massive electoral turnover, as incumbents are punished for events beyond their control. Incumbents should be punished regardless of whether their economies performed “less abysmally” than others. As we discussed in the introduction, the electoral consequences of the great recession contradict this expectation. Yet what occurs in other periods? Do economic outcomes relative to those abroad matter for the electoral success of incumbents, or do voters respond to economic outcomes regardless of source? In Figure 1, we report simple bivariate scatterplots with vote for the leader party on the y-axis and the local and global components of growth and unemployment on the four x-axes.Footnote 10
Scatterplot of Economic Conditions and Vote for the Leader Party

The figure demonstrates that high levels of local growth and low levels of local unemployment are associated with high vote shares for the leader party, whereas global growth and global unemployment have little effect on the vote share of the leader party. Consistent with the example of the recession of 2008–9 that we provided in the introduction, incumbents are not uniformly punished during global downturns (i.e., periods of low global growth and high global unemployment), but are punished for poor performance relative to international economic conditions. Moreover, this relationship emerges in even the most simple models.
Table 1 adds more variables and explores this relationship further. Column (1) employs nondecomposed growth and unemployment as independent variables to replicate a common economic voting model without benchmarking. The results, in line with expectations from the literature, indicate that growth increases and unemployment decreases the vote share of the leader's party, although the coefficient for unemployment is not statistically significant. Substantively, a 1% increase in growth leads to a 0.604% increase in the leader party's vote share, and 1% increase in unemployment corresponds to a 0.248% decrease in the leader party's vote share.
Aggregate-level Results for Benchmarking in the Economic Vote

Notes: Heteroskedasticity robust standard errors in parentheses. All results are restricted to OECD countries. We obtained nearly identical results when standard errors were clustered by country.
*5.0% significance level; **1.0% significance level; ***0.1% significance level.
Columns (2) to (4) investigate our benchmarking hypothesis. We depart from the conventional specification in column (1) and decompose growth and unemployment into local and global components. Although our favored model of economic voting would have voters responding only to local growth and local unemployment, we include both local and global components to allow us to test several of hypotheses of interest. Consider first economic growth. If voters focus only on total growth (that is, they do not benchmark across borders), we would expect the coefficients of local and global growth to be equal. If voters fully benchmark, we would expect the coefficient on local growth to be positive and the coefficient on global growth to be zero. In this case, voters would be responding not to growth, but the extent to which growth in their country outperformed or underperformed the international benchmark. If voters partially benchmark, or if some voters benchmark and others do not, we would expect the coefficient on local growth to be greater than the coefficient on global growth. Finally, if voters do not consider growth in voting decisions, then we would expect the coefficients on both local and global growth to be zero. Similar expectations would exist for the coefficients on local and global unemployment, except that the signs of the coefficients would be reversed.
The results in all three models (2 to 4) indicate that voters, in fact, benchmark on economic growth. For all three decomposition methods, we find that local growth has a positive and statistically significant effect, whereas global growth has a statistically insignificant effect.Footnote 11 This strongly suggests that voters respond to their country's deviation from various measures of average international performance, but not to the international benchmark itself. Thus, our results are consistent with benchmarking and are clearly inconsistent with no benchmarking. The global component of growth is, in fact, statistically indistinguishable from zero.
In the same table, we report the results of a Wald test for the joint hypothesis that the coefficients on local growth and global growth are equal. In the case of the principal components decomposition, we can reject this null hypothesis at the 1% level. This demonstrates that the different estimated coefficients on local growth and global growth are highly unlikely to have emerged by chance. Voters indeed benchmark on economic growth. Similar Wald tests on the local and global components of unemployment, however, show that they are statistically indistinguishable from each other, suggesting that voters do not seem to benchmark on unemployment. This outcome is consistent with the argument by Palmer and Whitten (Reference Palmer and Whitten1999, 627) that the unemployment rate does not lend itself to comparison but rather there is only a bloc of potential voters who are dissatisfied with the macroeconomic policies and performance of the government. A higher or lower domestic unemployment rate simply changes the size of this bloc regardless of what happens abroad.Footnote 12
Returning to our growth results, it is interesting that the benchmarking evidence is strongest for the principal components decompositions, because this suggests how cross-national comparisons are formed. Although the results for the local growth measure based on the median and trade decompositions in models (2) and (4) are also both statistically and substantively significant, the principal components decomposition yields clearly stronger results that seem to better capture voter behavior. Voters or the media that provide information to voters seem to compare national performance not primarily to the performance of large and proximate countries (trade decomposition) or to that of all countries (median decomposition), but to a set of the most economically integrated states, both internationally and regionally (principal components decomposition).Footnote 13
Model Fit
The results in columns (2), (3), and (4) in Table 1 are fairly consistent across the three benchmarking models, but we have somewhat stronger evidence of benchmarking in the case of the principal components decomposition. For this reason, we then wanted to determine which of the models fits the data best. We compared various models based on the adjusted R 2, the Bayesian Information Criterion (BIC), and the Akaike Information Criterion (AIC). Because of missing data for the trade decomposition, the sample sizes for the three decompositions methods differed, so we performed the model comparison on a common sample for which all three benchmarks are observed. Because the ranking according to the three measures was identical, we only report the BIC for the various models in Table 2. The single best fitting model (lowest BIC) includes local growth and local unemployment, and it uses the principal components decomposition. For any subset of variables included, the principal components decomposition performs the best. Moreover, moving from the baseline model with growth and unemployment to the model with only local growth and unemployment, decomposed using the principal components decomposition, the R 2 more than doubles and the adjusted R 2 almost quadruples. We take these results as evidence that voters benchmark on growth and that the principal components decomposition provides the best representation of this benchmarking. Substantively, this suggests that voters compare national performance to that in a set of countries that are most economically integrated, both internationally and regionally. We stop short of claiming that voters benchmark on unemployment, because although the benchmarked model for unemployment provides a slightly better fit, as measured using the BIC, R 2, or adjusted R 2, we did not find a statistically significant effect from unemployment and we earlier failed to reject the null hypothesis that the coefficients on local and global unemployment were equal.
Comparison of Model Fit

Notes: Bayesian Information Criterion computed for different models on the sample sample. The best fitting model BIC, which includes local growth and local unemployment and relies on the principal components decomposition, is highlighted in bold.
Returning to the results in Table 1, the difference in the effect sizes between column (1) and column (3) (our preferred benchmarking model) is worth noting. According to model (1), a 1% increase in growth is associated with a 0.604% increase in the leader party's vote share. According to model (3), a 1% increase in local growth is associated with a 1.261% increase in the leader party's vote share. The estimated effect size therefore more than doubles when moving from the conventional model to the benchmarked model.
Robustness
Because the models we estimated were fairly sparse specifications, we added several variables to the specification to see if the results are robust. First, we added controls for the size of the incumbent governing coalition, the effective number of parties, the population of the country, and a time trend. In countries with larger governing coalitions, we expect to see a smaller lead-party vote. Similarly, in countries with many (effective) parties, we also expect to see a smaller vote for the leader's party. We included the population of a country because we expect that larger countries will pose a greater challenge for opposition parties and will therefore see higher incumbent voting. Finally, we allowed for a time trend. We present these results in columns (1), (2), and (3) of Table 3. In columns (4), (5), and (6), we add vote share in the previous election to the specification. In columns (7), (8), and (9), we add country fixed effects to the specification. Our main results are not altered—we find strong evidence for benchmarking. Local growth is statistically significant for all three measures, whereas global growth is not statistically significant. The coefficients on local growth are uniformly larger than the coefficients on global growth. More robustness tests are available in the supplemental Online Appendix.
Robustness Checks for Aggregate-level Models

Notes: Heteroskedasticity robust standard errors in parentheses.
*5% significance level; **1% significance level; ***0.1% significance; + 10% significance.
Stability
As encouraging as our initial results appear, the literature on the economic vote is replete with studies that find relationships that cannot be replicated in other time periods, samples, or model specifications. Harking back to Paldam (1991), this is often referred to as the “stability” problem. We have already addressed the question of robustness to specification by showing that the effect of local growth and local unemployment materializes in even the simplest bivariate regressions (Figure 1) and in various specifications (Table 2). We now address the question of robustness over time and across (sub)samples.
To test the stability of the coefficient estimates over time, we regressed the share of the vote going to the executive's party on both benchmarked and non-benchmarked growth, controlling for unemployment in all models, in every 10-year window that hosts 50 or more elections. In practice, this captures every decade window between 1980 and 2010. To strengthen the comparison, we employed non-benchmarked unemployment as a control in all models so that the only item that varies in the specifications is the inclusion of benchmarked or non-benchmarked growth. Figure 2 plots the coefficients on benchmarked (dotted line) and non-benchmarked (solid line) growth over 20 10-year periods as the decade window shifts from 1980–90 to 2000–10. Benchmarked growth, the local component from the principal components decomposition, remains uniformly stronger than non-benchmarked growth in every 10-year time period between 1980 and 2010.Footnote 14 Moreover, benchmarked growth, in contrast to non-benchmarked growth, never loses statistical significance.
The Magnitude of the Benchmarked and Non-benchmarked Economic Vote over Time

Yet what about robustness to different (sub)samples? One other dispute in the research on comparative economic voting concerns the importance of institutional and political context. As mentioned earlier, Powell and Whitten (1993) initially solved the instability puzzle by showing that clarity of governmental responsibility for economic outcomes mattered. Although evidence of electoral accountability for the economy may not emerge where responsibility for policy making is not clearly linked to a specific party—for example, in minority or coalition governments in which multiple parties influence outcomes—voters should hold incumbents accountable where clarity of responsibility is high. This literature offers us an obvious set of subsamples on which to check the robustness of our estimates.
We separated our sample into three levels of clarity of responsibility. Numerous clarity measures have emerged since 1993, however, which complicated our choice. We chose to construct a simple measure that focuses on the institutional determinants of clarity in the order of importance given by Powell (Reference Powell2000, chapter 3). Consequently, we sorted all observations into one of three categories in increasing levels of institutional clarity of responsibility: minority governments (whether single or multiparty), coalition governments, and single-party majority governments.
Table 4 presents our results and, like Figure 2, uses nondecomposed unemployment as a control in all models to enable clearer comparison of benchmarked and non-benchmarked growth. The coefficient on (non-benchmarked) growth varies dramatically across categories, showing its strongest effect, contrary to theory, for minority governments. Local (benchmarked) growth, in contrast, demonstrates a strong and notably stable effect across all three clarity subsamples. Indeed, the coefficient on local growth varies very little across types of government. This finding suggests considerable stability in the effect of benchmarked growth. The contrast with the expectations for the conditioning effect of government type is interesting, but perhaps not surprising. Recall that our dependent variable is the vote share going to the executive's party, not the whole government. The results therefore suggest that voters can identify the prime minister's party quite well regardless of government type and hold it responsible for national economic performance relative to an international benchmark.
Non-benchmarked and Benchmarked Growth across Government Types

Notes: Robust standard errors in parentheses. All results are restricted to OECD countries.
*10% significance; **5% significance; ***1% significance.
In summary, when paired with the stability-over-time results in Figure 2, we find that benchmarked growth is generally a better predictor of the vote than non-benchmarked growth, regardless of the time period or the institutional context. In the government type subsamples, benchmarked growth also proves much more stable than non-benchmarked growth.Footnote 15
INDIVIDUAL-LEVEL EMPIRICS
Our analysis until now has relied on aggregate-level data. Modeling individual level voting behavior with aggregate-level data is not ideal, but is necessary to capture a large number of elections. The aggregate-level data, however, raise several challenges. Not only do they pose the usual ecological inference problems but they also offer little opportunity for us to investigate precisely how benchmarking comes about.
The Comparative Study of Electoral Systems (CSES) project, to our great fortune, has been steadily expanding its individual-level coverage of elections, which we employ here to investigate benchmarking at the individual level and to explore the means by which it occurs. Our individual-level model has several advantages over our aggregate-level model. The aggregate-level analysis treats vote choice in a multiparty system as a binary choice, where voters either select the leader party or the opposition. It is in principle possible to use party-level election results in an aggregate analysis,Footnote 16 but existing approaches are not well suited to handle data that pool elections with different party systems, as is the case in our data. Because we have individual level data and because we can directly model a voter's utility for voting for an individual party (as opposed to agglomerating all opposition parties into a single option), we can include covariates built on party characteristics and interactions between individual and party characteristics. In addition, the fact that we can model parties individually means that we can account for the fact that voters are less likely to select the incumbent party when many alternatives exist and when many of those alternatives have attractive attributes.
Data
Our approach follows recent work by Duch and Stevenson (Reference Duch and Stevenson2008) and by van der Brug, van der Eijk, and Franklin (Reference van der Brug, Eijk and Franklin2007) in that we pool multiple individual-level surveys. We follow van der Brug, van der Eijk, and Franklin (Reference van der Brug, Eijk and Franklin2007) more closely in that we study the effect of the real economy, rather than economic perceptions, on the vote shares of leader parties. Unlike economic perceptions, national economic conditions are constant across a single election, so to study the effect of national economic conditions using individual level data, we must pool across multiple elections.Footnote 17
To take full advantage of individual-level data, it is necessary that the multiple surveys we pool contain common survey items. In our analysis, we employ the first two modules of the CSES. The first and second modules amalgamate 39 and 40 election studies, respectively, with one of these studies being common to both modules. Combined, we observe individual-level results for 78 elections across 43 countries. We focus on developed states with a stable party system, omitting Switzerland and the United States for the reasons previously discussed. The remaining 18 countries offer 34 election studies that form our individual-level sample.Footnote 18 In each module there was a comparable battery of survey items present among each of the election surveys, and the project collected additional data on the electoral institutions and political parties in each of the studied elections. Because many of the survey items and coded items were common across the two modules, we were able to merge the two modules into one dataset. In a few cases, items were not available in the CSES dataset, but were available in the original country surveys. We were able to fill in missing survey items by obtaining the original election studies from the project websites.
The dependent variable in the analysis is the reported vote of the respondent. The CSES provided us with the respondents’ vote for the president, the lower house, and the upper house, when they were available in the country surveys. In countries with mixed electoral systems, it was possible for individuals to cast both a proportional representation (PR) ballot and a single-member district (SMD) ballot, and both of these ballots were potentially available in the CSES. Creating the dependent variable therefore demanded several coding decisions. We relied on the following rule:
1. If a directly elected president or prime minister was on the ballot, we considered him or her to be the leader.
2. If two chambers were on the legislative ballot, we used the lower house.
3. If two tiers were on the ballot for the legislature, we selected the the PR tier over the SMD tier, unless more than half of the allocation of seats to parties depended on the SMD tier.
Our choice to use the vote for the president, when available, was based on the expectation that economic voting would be most relevant for the most visible office in the political system. In the case of presidential and semi-presidential systems, the most visible office was likely to be the president. Our choice of the PR vote over the SMD vote for mixed-party systems was based on our expectation that voters would view parties rather than individual legislators as responsible for economic conditions in those countries where the president is not directly elected. Note that under this rule a mixed-member proportional system such as Germany or New Zealand would be coded with the PR ballot because that ballot governs the allocation of seats to parties in such a system, despite the fact that the SMD ballot often selects which individuals fill these seats. Our choice to use the lower house in favor of the upper house was based on a prevailing pattern in most countries in which the lower house is more powerful than the upper house.Footnote 19 Because of the prevalence of parliamentary systems among the countries in our study and the general availability of the lower house vote, the dependent variable was most often constructed based on the vote for the lower house.
To study economic benchmarking, we once again had to collect economic data. Because we had a much shorter time series, we wanted to ensure that we had sufficient variation in the economic variables. This was particularly a concern when measuring global growth and global unemployment using the median. In this case, global growth and global unemployment take on the same value for all countries in a given time period. Had we used yearly economic data, we would have had only 12 distinct values for global growth and global unemployment. For this reason, we relied on quarterly economic data. We calculated GDP growth as the percentage change in GDP between the quarter of the election and the same quarter in the previous year. Similarly, unemployment is the mean unemployment in the election quarter and the three preceding quarters. In our aggregate-level analysis, we did not use quarterly data because this information was available only for more recent time periods. Because using the CSES already constrained us to the more recent time period, using quarterly data here was more appropriate and allowed us to increase the number of independent observations while simultaneously reducing measurement error.
As before, we used the OECD as our main source for the economic variables. Our economic variables were taken mostly from the OECD Quarterly National Accounts and supplemented with data from the OECD's Main Economic Indicators, the IMF's International Financial Statistics series, the Penn World Tables, and, where necessary, national sources. In a small proportion of cases we imputed quarterly data from annual data by assuming a constant rate of growth over the year.Footnote 20 This was done mostly to support the principal components analysis used as one of three methods for decomposing the global and local components of the economic variables.
The CSES provided us with additional characteristics for the respondents and the parties. Characteristics of the parties were coded by the principal investigators (PIs) of the participating election studies. Expert placements of major political parties (reported by the PIs themselves) were reported on a 0 through 10 ideological scale. These placements, in conjunction with the respondent self-placements, enabled the construction of a measure of policy distance between each respondent and each party.Footnote 21 We constructed the policy distance as Distnj=|PartyIdeologyj−ResponmdentIdeologyn|.Footnote 22 The CSES provided various other characteristics for the parties. The two that we found most useful were the ideological family of the party and the year that the party was founded. The ideological family variable included codes for the following party families: ecology, socialist, social democratic, left liberal, right liberal, Christian democratic, conservative, national, and regional. The remaining parties and the outside option became the excluded category. The ideological family of the party allowed us to separate mainstream parties from niche parties (Meguid Reference Meguid2008), and the year founded allowed us to separate established parties from newly founded parties. We view both variables as potentially capturing quality differences between the parties that would otherwise be unmeasured. In addition, interactions between these variables and individual-level characteristics may uncover important demographic effects in the patterns of support for certain types of parties.
In addition to the party-level information, the CSES provided us with individual-level characteristics. We focused on the set of individual-level variables that could be most readily compared across countries. These variables included gender, age, and education. The coding of gender and age is self-explanatory. Education was coded in eight categories that we treated as an interval scale to avoid introducing a very large number of dummy variables. The CSES provided us with respondent self-placements on a 0 to 10 ideological scale.
Method
We analyzed our individual level data using a conditional logit model (McFadden Reference McFadden and Zarembka1974) grouped by individual. In election study s, our dependent variable takes on the values, 0, 1, 2, . . ., Js. Here, 1 though Js denote the modeled parties, and 0 denotes voting for one of the unmodeled parties.Footnote 23 The parties that we included in the analysis as choices were those for which we observed estimates of the parties’ placements. These, in turn, corresponded to the parties judged by the PIs for each election study to be “important” and generally included incumbent parties, parties that were expected to receive large vote shares, and new parties affiliated with a major political figure. The remaining parties were grouped together as option 0. Note that the choice set (i.e., the parties that the voters are able to vote for plus the outside option) varies across elections and that the size of the choice set (i.e. the number of “important” parties) differs across election studies. We note that this is consistent with McFadden's description of the conditional logit model and that standard statistical software accommodates this feature.Footnote 24
To develop the conditional logit model, we assume that the utility individual n receives from voting for option j is given by

where εnj are distributed i.i.d. extreme value. The dependent variables here, xnj, are allowed to vary over both individuals and choices. In fact, only variables that vary over choices can meaningfully enter into the utility function. A demographic characteristic, such as age, cannot be included as a covariate because it will equally shift the utilities of all choices and therefore will not affect the choice of the individual.
Based on the conditional logit framework, we can determine that

for j ∈ (0, 1, . . ., Js). In our framework, we can include several different types of variables for xnj. The economic variables can enter into the utilities after they are interacted with the lead party dummy. We can control for policy distance between the individual and the party, and we can include dummies for the party family. Additionally, we can interact various demographics such as gender, age, and education with the lead party dummy and the party family dummies to account for the fact that demographic groups may differ in their relative preference for incumbent parties and their relative preferences for the attributes captured by the party family dummies.
Our approach in this section has several advantages over employing aggregate data. First, it more closely approximates the behavioral mechanism that the voters use—the voters will compare the attributes of the various parties and select the party that receives the highest evaluation. Second, by considering an individual-level model, we are able to control for a host of factors that we cannot control for in the aggregate-level analysis. We can control for policy distance between the voter and both incumbent and non-incumbent parties. We can also control for the number of competing parties and the characteristics of competing parties (for example, we can take into account the fact that a newly formed religious party will probably be less of a threat to other parties than an established Christian Democratic party).
It is instructive to compare our approach to the approaches of Duch and Stevenson (Reference Duch and Stevenson2008) and van der Brug, van der Eijk, and Franklin (Reference van der Brug, Eijk and Franklin2007). Duch and Stevenson (Reference Duch and Stevenson2008) apply both one-step and two-step estimators. In their one-step estimation approach, the dependent variable is binary, taking on a value of 1 if the voter votes for an incumbent party and 0 otherwise. Their analysis groups together various non-incumbent parties into a single alternative (a “0” vote in this case). A limitation of their approach is that it does not fully take advantage of the ability to control for the degree of competition using individual level data. In our analysis, we can control for the number of competing parties (a voter with more non-incumbent choices is less likely to vote for the incumbent party) and the characteristics of competing parties (a voter with more attractive non-incumbent choices, is less likely to vote for the incumbent party). Duch and Stevenson (Reference Duch and Stevenson2008) also employ a two-step estimation approach where the dependent variable is not binary. They estimate a multinomial logit model separately for each election and then regress the estimated economic voting coefficients on election study and party-level controls in a second stage. This approach allows them to include party-level characteristics in their analysis, but their two-step approach can only be used when economic voting is measured using economic perceptions—because economic conditions do not vary within a single election, the first step of their two-step procedure could not be estimated if economic conditions were substituted for economic perceptions.
Van der Brug, van der Eijk, and Franklin (Reference van der Brug, Eijk and Franklin2007) claim that the conditional logit is unsatisfactory for their purposes because the set of choices available to the voters in various elections varies across countries and across time. For this reason, they instead use thermometer scores for the parties as their dependent variable and apply a linear model. Although their approach is appropriate, their dismissal of the conditional logit model is based on a more restrictive definition of the conditional logit model than McFadden (Reference McFadden and Zarembka1974) developed, and as we argued earlier, standard statistical packages (e.g., Stata and R) accommodate the less restrictive model.Footnote 25 Our approach offers two advantages. First, individuals may not report their utility levels on the same scales. This fact can be dealt with,Footnote 26 but by employing the conditional logit model, we avoid needing to deal with it. Second, it is not easy (though still possible) to generate substantive effects when the utility level is the dependent variable. In our framework, it is easier (though still not easy) to generate substantive effects as reported in the bottom section of Table 5.
Individual-level Results for Benchmarking in the Economic Vote

Note: Standard errors clustered by elections study in parentheses. Marginal effects are reported only for statistically significant economic variables. 95% confidence intervals for the marginal effects, calculated using the bootstrap, are reported in parentheses. All results are restricted to OECD countries. We obtained nearly identical results when standard errors were clustered by country.
*5% significance; **1% significance; ***0.1% significance.
Results
In Table 5, we report the results of the individual-level analysis. Throughout this section, the standard errors we report are clustered by election study, which accounts for the possibility that the error terms are correlated across individuals in the same election study. Such correlation is likely to be present if there are candidate attributes, unobserved to us, that the voters consider in their voting decisions. The conditional logit estimates remain consistent if such correlation is present, but the standard errors need to be corrected in some way. Clustering provides one such correction method.Footnote 27
We begin with a rather simple specification, controlling for incumbency status and policy distance, but omitting the remaining control variables. Column (1) first confirms the expected effect of nondecomposed real GDP growth and unemployment on vote choice. Both variables must be interacted with the leader party dummy variable to account for the fact that economic performance alters the voters’ relative assessments of incumbent parties. No non-interacted economic variables are included because economic conditions do not vary over party. Including variables that vary only over the individual only affects the scale of utilities, and observed choices are invariant to the scale of utilities.
As expected, growth shows a positive effect and unemployment a negative effect, though only growth is statistically significant. Also, as expected, the ideological distance between voters and parties proves strongly negative and statistically significant. Voters unsurprisingly are less likely to vote for parties with ideological positions far away from their own. The coefficient on leader party can be interpreted as the advantage of incumbency, when growth and unemployment are held at zero. Because these values for growth and unemployment are not especially relevant, we instead report the incumbency advantage when growth and unemployment are held at their mean values. The mean values for growth and unemployment in our sample are 3.467% and 7.005%, respectively, so we can calculate the incumbency advantage as 0.671+0.101*3.467−0.008*7.005=0.965. This means that incumbency status during average economic conditions is worth approximately as much (in utility scale) as two units of policy distance (because 0.965 is about two times as large as 0.498). One unit of policy distance is worth about as much as 5% economic growth because 0.498 is about five times as large as 0.101. These results demonstrate the magnitude of these effects on voter utility. Later we consider substantive effect sizes.
The remainder of Table 5 focuses on benchmarking. Columns (2) through (4) model party utility as a function of the local and global components of growth and unemployment. All three benchmarking models show a considerably stronger effect for the local component of growth than for the global component. This suggests that voters benchmark on growth, voting more often for the leader's party when national conditions are good relative to international conditions. In contrast to the growth results, unemployment shows no evidence of benchmarking. The coefficients on local unemployment are negative, but the effect sizes are small and do not achieve statistical significance. As in model (1), in models (2), (3), and (4), policy distance remains statistically significant and incumbency status remains worth about four units of policy distance when the economic variables are held at their mean levels.
In the bottom of Table 5, we report substantive effect sizes for the statistically significant economic variables. Typically, presenting substantive effects sizes would involve varying one of the variables (e.g., economic growth) and observing the effect on the dependent variable. The difficulty with applying this approach here is that because there are many parties and the choice set differs across countries and time, the dependent variable takes on thousands of values. Our main independent variables (i.e., the economic ones) are all interacted with a leader party dummy. It thus makes sense to observe the effect of the economic variables on the vote share of leader parties.
We started by computing a baseline estimate of the leader parties’ vote shares by averaging the predicted probability of voting for the leader party across all individuals in our sample. This baseline level was 32.6%. We then held all other variables at their observed values and changed one of the economic variables (for example, we increased growth by 1%) and observed the effect on the average probability of voting for the leader party. We subtracted the baseline level from this to obtain our estimate of the effect size. Starting with the model in column (1), we find that an increase (decrease) of 1% in growth increases (decreases) the predicted probability of voting for the incumbent party by 1.95% (1.89%). This is larger than the difference we found in the aggregate level analysis (which was 0.6%), but is still a plausible value. Various factors may account for the difference—heterogeneous effects across time, differences in methodology, or other sources.
Studying the remaining models, we find that a 1% increase in local growth leads to a 2.23% increase in the probability of voting for the incumbent party. These results suggest that economic performance that is worse than expected (where expectations are formed based on the performance of other countries) can lead to substantial reductions in the probability of voting for the incumbent party.
In Table 6, we considered a number of robustness checks on the model. The fact that we relied on an individual level model where the choice of party is the dependent variable means that many additional control variables were available to us. We started by adding controls for party characteristics. We included 11 dummy variables for the party family, and we differentiated new parties from established parties using the year the party was founded and its squared term. The results are reported in columns (1), (2), and (3). In columns (4), (5), and (6), we added interactions between the demographics of the voters and whether the party was a leader party. These variables thus can be interpreted as differences in the tendency of different demographic groups to prefer incumbent parties. In columns (7), (8), and (9), we controlled for interactions between the party characteristics and the demographic variables. These coefficients can thus be interpreted as the demographic differences in the tendency to vote for certain party families and the tendency to vote for established parties. As we can see, the main results of the article are robust to increasing the number of controls we include in the model. The coefficients on the economic variables do not change much in magnitude, and their statistical significance is not affected. The main differences between Table 5 and Table 6 are that the standard errors on the economic variables become somewhat larger when a large number of controls are added, but the local growth coefficients retain their signs and statistical significance.
Robustness Checks for Individual-level Models

Note: Standard errors clustered by elections study in parentheses. Party characteristics include year founded, year founded squared, and dummy variables for the following party families: ecology, socialist, social democratic, left liberal, right liberal, Christian democratic, conservative, national, and regional. The excluded category consists of all other parties and the outside option. Individual level demographics include gender, age, and education.
*5% significance; **1% significance; ***0.1% significance; + 10% significance.
We do not report the estimates for the controls because there are a very large number of them, but we summarize the results here. Most of the coefficients on party characteristics were statistically significant, the interactions between demographics and leader party were rarely statistically significant, and the interactions between party characteristics and demographics were often statistically significant. The coefficient estimates in columns (1), (2), and (3) accurately captured the fact that mainstream party families provided higher voting utility than fringe party families, and that newly formed parties provided less voting utility. The remaining variables in columns (4) through (9) are too numerous to describe here.
THE MEDIA AS A MECHANISM FOR BENCHMARKING
Our findings suggest that voters benchmark their economic growth. One mechanism that could explain this finding is that voters are sophisticated collectors of economic news: They gather information on economic conditions at home and abroad and form their economic vote based on a comparison between these two. Alternatively, voters may rely on heuristics in determining their “correct” vote, and these heuristics may allow them to approximate benchmarking. Voters may base their votes on trusted experts, who based their recommendations partially on benchmarked economic conditions. Alternatively, voters may base their vote on economic news obtained from more knowledgeable individuals in their social network, and these knowledgeable individuals may practice benchmarking. Or voters may obtain information from the media, which may report economic news in a benchmarked fashion. We provide some evidence for this last mechanism here.
Specifically, the media do not limit reporting of economic news to hard-to-interpret economic indicators. Instead, they describe the everyday economy using simple adjectives; for-example, they describe the economy as “good” or “bad,” which can be interpreted more easily than “growth was 3.2% last quarter.” The media may apply the adjectives “good” and “bad” not based on the absolute level of growth, but instead on growth relative to the world economy—that is, they “pre-benchmark” their reporting of economic news. Voters relying on such information will behave as though they are benchmarking their economic vote.
Testing this hypothesis requires coding economic news as good or bad and investigating the relationship between the tone of media reports and economic indicators. To test our hypothesis, we rely on data collected and investigated in Soroka (Reference Soroka2006), which were very generously made available to us by the author. Soroka (Reference Soroka2006) coded articles appearing in The Times (London) from July 1986 through December 2000 as positive, negative, or neutral in their coverage. An advantage of employing this dataset is that, because the coding was not done by us, there is no chance that it would have been contaminated by our hypothesis (i.e., it is highly unlikely that the coders built benchmarking into their coding).
We constructed our dependent variable based on the number of positive articles as a proportion of all economic news articles in each quarter. We merged this dependent variable with our measure of quarterly growth, local growth, and global growth (using all three forms of benchmarking). In column (1) of Table 7, we report the results of a regression where the proportion of positive economic news is the dependent variable and growth is the independent variable. We see the expected relationship here—positive economic conditions (high growth) are associated with positive economic news coverage. In particular, each 1% increase in growth leads to a 1.8% increase in positive news coverage of the economy.
Benchmarking of Economic News in The Times

Note: Heteroskedasticity consistent standard errors in parentheses.
*5% significance; **1% significance; ***0.1% significance; + 10% significance.
In columns (2), (3), and (4) of Table 7, we report the results of regressions where the fraction of positive economic news is the dependent variable and local and global growth (using all three measures) are the independent variables. Here, a few important patterns emerge. First, the coefficient on local growth is uniformly larger than the coefficient on global growth—the coefficient on global growth is negative in one case and less than half the magnitude of local growth in the other two cases. The coefficient on local growth is statistically significant in all three cases, whereas the coefficient on global growth is only statistically significant in one of the three cases. The difference between local and global growth is statistically significant at the 10% level for the principal components decomposition and statistically significant at the 0.1% level for the trade decomposition. In all three cases, the coefficient on local growth is about twice as large as the coefficient on nondecomposed growth in column (1), and the R 2 increases substantially in each of these regressions. Based on the results for the principal components decomposition, a 1% increase in local growth leads to a 3.9% increase in the fraction of positive news coverage of the economy.
The results we find here are surprisingly strong given that we only have access to a short time series from a single country. Our results are consistent with benchmarking, but could also be argued to be consistent with partial benchmarking—it is possible that economic news in the United Kingdom is partially benchmarked because the UK economy is large enough that UK policies may exert some impact on the global economy. Future work could consider more countries, both to increase sample size and to examine smaller economies where the prediction of benchmarking is starker. Such work would have to overcome the difficulty of coding economic news across multiple countries and multiple languages.
CONCLUSION
Electoral accountability is a keystone of democracy. Governments that are subject to periodic popular elections govern both better and more in the interest of the governed when their tenure depends on the approval of the electorate. Although broad evidence of the greater fidelity of democratic governments to the well-being of their citizens exists in areas as disparate as life expectancy (Besley and Kudamatsu Reference Besley and Kudamatsu2006), rural electrification (Min Reference Min2008), corruption (Montinola and Jackman Reference Montinola and Jackman2002), and the material welfare of the poor (Blaydes and Kayser Reference Blaydes and Kayser2011), the most direct evidence that elected officials are subordinate to voters in democracies is the economic vote. Voters, subject to a long list of conditioning variables, often punish incumbent governments that preside over a poorly performing economy. This relationship, when it exists, is as reassuring to democratic theorists as it is worrisome to incumbents, because it demonstrates responsible evaluation and control of the governing by the governed. Its absence, which is not infrequent, and its magnitude, which is often modest, can raise concern about even the existence of democratic electoral accountability (Cheibub and Przeworski Reference Cheibub, Przeworski, Przeworski, Stokes and Manin1999).
We argue that previous research has fundamentally misunderstood and hence incorrectly estimated how economic assessments are made. Implicit in most research designs in economic voting is an assumption of voter parochialism. That is, researchers presume that voter behavior is limited to the national environment without a comparative international context. Researchers test for whether voters compare current outcomes to previous outcomes, but they very rarely test for voter responses to cross-national differences. Yet, no rate of economic growth is innately high or low. What may be considered weak growth in an international context in the 1990s might pass for stellar growth during the global recession of 2008–9. We posit that voters—or, more specifically the media that provide information to voters—benchmark. That is, after consuming media information, voters respond more to national deviations from an international average rate of growth than to the growth rate itself. We test this proposition by decomposing national growth in real GDP and the unemployment rate into local (i.e., the deviation) and global (i.e., the benchmark) components and find that voters indeed respond to the deviation from the international growth benchmark, that they do not respond to the international benchmark itself, and that the magnitude of the effect of the local deviation is roughly twice that of the effect of non-benchmarked growth on the incumbent vote. We also find that benchmarking occurs exclusively on growth—possibly because information about growth, relative to unemployment, depends more on media reports than personal networks and observation – and is strongest when the international benchmark is calculated with a principal components decomposition that captures the degree to which potential comparison countries are integrated into the international and regional economies.
We are careful to establish the robustness of our results. Indeed, we demonstrate that benchmarking obtains across two datasets; on the aggregate and individual levels; with three types of benchmarking; in each of the 20 10-year spans between 1980 and 2010; in minority and majority governments; in single-party and coalition governments; and controlling, among other measures, for party characteristics, ideological distance between individuals and parties, and several demographic variables. Our goal here has been to establish the basic result. New findings, however, often engender new questions, and many arise from this article that promise fruitful ground for future research. Are benchmark effects constant, or do they vary across different benchmark levels and deviations? Do countries use more specific sets of comparison countries than those identified here? Do countries with cultural, linguistic, and historical similarities benchmark against each other more? Might larger countries benchmark less than smaller countries? How much does cross-national benchmarking matter relative to within-country over-time comparisons (Palmer and Whitten Reference Palmer and Whitten1999), and under what circumstances does this relationship change? By necessity, we leave all of these questions open for future research.
This article began with a puzzle founded on a different sample—the set of countries that held elections during the financial crisis of mid-2008 to 2009. Does the argument we develop here explain the puzzle in this third dataset: the surprising fact that a sizable minority of incumbent parties actually increased their vote share during a severe global economic contraction? We now conclude where we began, by examining these cases.
Figure 3 shows average GDP growth in the two quarters preceding an election quarter for 14 of the 16 countries that held elections during the financial crisis.Footnote 28 Panel (a) marks countries in which the executive's party increased its vote share with triangles and reserves circles for the others. The panel shows that, although almost all countries had weak or negative growth in this period, the leader's party increased its vote share in four of seven countries in which the economy outperformed the OECD mean; where countries underperformed the OECD mean, this figure falls to one of seven. Panel (b) offers an explanation in the stronger electoral response to benchmarked growth (diamonds) than to non-benchmarked growth (circles).Footnote 29 Where growth is weak or even negative, incumbent parties can still do well when they outperform their peers. Every unit increase in growth beyond the OECD average is rewarded with more electoral support than a unit increase in growth alone. Indeed, those countries that most outstripped the OECD average also host most of the leading parties that were able to increase their vote share. The election prospects looked dim for the parties of nearly all leaders facing elections during the financial crisis, but rather surprisingly a substantial minority managed to increase their party's vote share. As with our previous results, benchmarked growth in this third, albeit tiny, dataset again proves a better predictor of electoral support than nonbenchmarked growth.Footnote 30 In a field in which the size and even presence of the economic vote have been questioned, and electoral accountability along with it, we offer a possible explanation for past instability in cross-national studies of how the economy affects vote choice: Voters benchmark across borders.
Growth, Benchmarked Growth, and Election Results in Countries that Held Elections during the Financial Crisis

APPENDIX: ADDITIONAL DETAILS ON THE PRINCIPAL COMPONENTS DECOMPOSITION
Here we provide additional detail on the principal components decomposition. We present the results for the decomposition performed on growth that we used for the individual-level analysis. The other decompositions produced similar results.
The first task was to choose the number of components to include in the analysis. We found that the first dimension explained 41% of the variance and the second dimension explained 13% of the variance. From the third dimension on, the proportion of variance explained decreased gradually. The “elbow rule” thus suggested that a two-dimensional model be employed.
Figure 4 reports the factor loadings for the first two dimensions. The first factor captures the common trend of growth rates across countries. Almost all countries have positive loadings on the first factor, indicating that growth rates tend to move together. Some countries load higher on the first factor, however. This can be interpreted as measuring the country's level of integration with the global economy. Countries such as the United States, United Kingdom, Spain, Canada, and Sweden are highly integrated with the global economy, whereas countries such as Kyrgyzstan, Ukraine, Albania, Peru, and the Philippines have growth rates that do not closely follow the global trend.
Factor Loadings for Principal Components Decomposition of Growth

The second factor captures regional differences between North American and Western Europe on the one hand and Eastern Europe and Asia on the other hand. Countries such as Portugal, Canada, the United States, United Kingdom, and Mexico have positive values on the second factor. Countries such as Thailand, the Philippines, Russia, China, and Peru have negative values on the second factor. The second factor allows us to capture the fact that growth rates covary more strongly within these broad regions than between these regions.
Our estimate of global growth is based on the first two factors of the principal components decomposition. Specifically, we computed global growth in country c at quarter t using

This amounted to assuming that, when voters benchmark, they account for global economic growth (through Fac1), the country's integration with the global economy (through FacLoad1), the broad regional trend in growth (through Fac2), and the country's integration with the broad regional economy (through FacLoad2).
 .
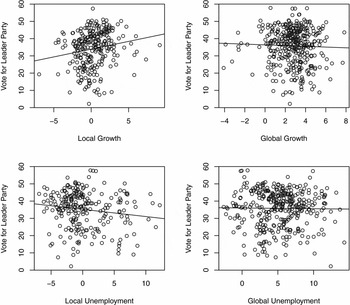
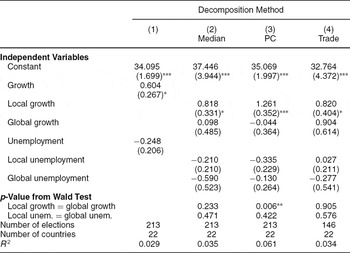
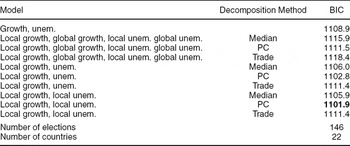
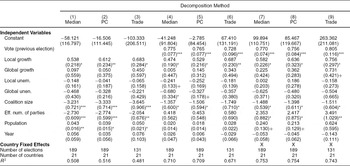
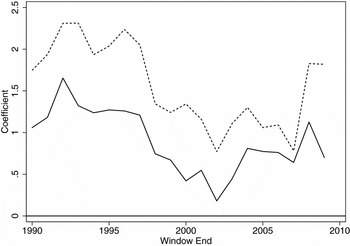
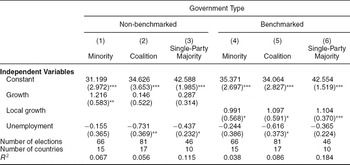
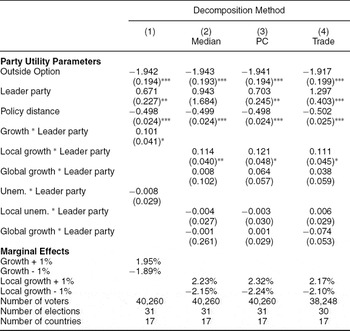
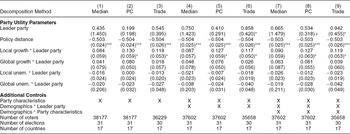
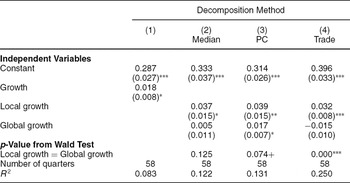
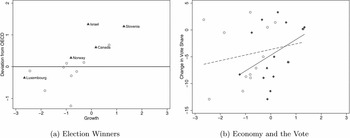
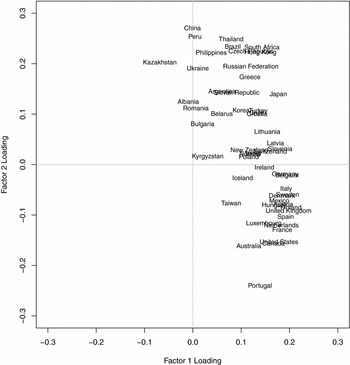




Comments
No Comments have been published for this article.