Autism spectrum disorder (ASD) is a disorder of social communication (American Psychiatric Association [APA], 2000) that affects approximately 1 in 110 children (Kogan et al., Reference Kogan, Blumberg, Schieve, Boyle, Perrin and Ghandour2009). The “autism spectrum” refers to several disorders, including autism, Asperger syndrome, and pervasive developmental disorder—not otherwise specified (PDD-NOS). Autistic disorder is defined by primary deficits in social interaction, communication, and repetitive behaviors/stereotyped interests. Asperger syndrome also has primary deficits in social interaction and repetitive behaviors/stereotyped interests, but individuals in this group show no early language delays, although they do exhibit difficulties in the pragmatic use of language. Individuals with PDD-NOS have difficulties with one or more of the areas described above, but do not meet full criteria for autistic disorder or Asperger syndrome. Research suggests that current definitions do not create reliable categorical differentiations between these closely related conditions (Howlin, Reference Howlin2003; Miller & Ozonoff, Reference Miller and Ozonoff2000; Volkmar, Lord, Bailey, Schultz, & Klin, Reference Volkmar, Lord, Bailey, Schultz and Klin2004), and therefore they are often grouped together as ASD.
Deficits in the pragmatic use of language are a hallmark characteristic of ASD (Paul, Orlovski, Marcinko, & Volkmar, Reference Paul, Orlovski, Marcinko and Volkmar2009; Tager-Flusberg, Paul, & Lord, Reference Tager-Flusberg, Paul, Lord, Volkmar, Paul, Klin and Cohen2005; Young, Diehl, Morris, Hyman, & Bennetto, Reference Young, Diehl, Morris, Hyman and Bennetto2005). Atypicalities in prosody production, including rhythm, rate, and intonation patterns, are some of the most commonly reported social–communicative features of the disorder (McCann & Peppé, Reference McCann and Peppé2003; Paul, Augustyn, Klin, & Volkmar, Reference Paul, Shriberg, McSweeny, Cicchetti, Klin and Volkmar2005; Shriberg et al., Reference Shriberg, Paul, McSweeny, Klin, Cohen and Volkmar2001) and also some of the earliest characteristics to appear (Schoen, Paul, & Chawarska, Reference Schoen, Paul, Chawarska, Paul and Flipsen2010; Werner, Dawson, & Osterling, Reference Werner, Dawson and Osterling2000; Wetherby et al., Reference Wetherby, Woods, Allen, Cleary, Dickinson and Lord2004). Prosodic atypicalities have been reported clinically and in research at all levels of ability in ASD, including Asperger syndrome (Shriberg et al., Reference Shriberg, Paul, McSweeny, Klin, Cohen and Volkmar2001), and high-functioningFootnote 1 autism (Diehl, Watson, Bennetto, McDonough, & Gunlogson, Reference Diehl, Watson, Bennetto, McDonough and Gunlogson2009; Peppé, McCann, Gibbon, O'Hare, & Rutherford, Reference Peppé, McCann, Gibbon, O'Hare and Rutherford2007). Prosody production has been shown to be related to measures of general social–communicative functioning in ASD (Paul, Shriberg, et al., Reference Paul, Shriberg, McSweeny, Cicchetti, Klin and Volkmar2005) and it has been suggested that it is a “bellwether” behavior (i.e., microcosm) that is indicative of the specific cognitive and social functioning profile of an individual with the disorder (Diehl & Berkovits, Reference Diehl, Berkovits and Harrison2010). The perceived differences in prosodic patterns is considered to be one of the most stigmatizing aspects of the disorder (Shriberg et al., Reference Shriberg, Paul, McSweeny, Klin, Cohen and Volkmar2001). Nevertheless, research has not provided detailed characterization of these deficits that goes beyond the subjective impressions observed clinically. In this paper, we examine acoustic characteristics of prosody in children with ASD in order to identify these subtle, but clinically relevant characteristics of speech. Furthermore, we attempt to investigate the specificity of these deficits in comparison to individuals with learning disabilities (LDs) and typically developing (TD) peers.
PROSODY PRODUCTION IN AUTISM AND RELATED DISORDERS
Studies of prosody production have had mixed findings, and most studies focus on the functional use of prosody, rather than the “fine details” of the acoustic output that could identify subtle (but perceivable) group differences. For example, prosody serves many functions in speech, including (but not limited to) the communication of affect, the structuring of discourse, or the clarification of syntactic structure. In addition, prosodic patterns could be exaggerated or monotone, fast or slow, and although they are functionally correct, these “fine details” of the acoustic output can provide the signature, or “idiolect,” of an individual's speech.
A review of early research on prosody performance found that few studies had sufficient sample sizes for groupwise comparisons, and those that had sample sizes greater than 20 tended to have wide age ranges and/or inconsistent diagnostic criteria (McCann & Peppé, Reference McCann and Peppé2003). Paul, Augustyn, and colleagues (Reference Paul, Augustyn, Klin and Volkmar2005) recently used an experimental paradigm to address some of these issues and found that children with ASD showed deficits in stress production, particularly in using stress at the lexical level (e.g., RE-call vs. re-CALL) and at the phrasal level (e.g., CHOCOLATE ice cream vs. chocolate ICE CREAM) to communicate meaning. The group with ASD, however, performed similar to that of typical peers on several measures, including the grammatical and pragmatic/affective production of intonation and phrase breaks.
Another series of studies used a test of prosodic abilities, the Profiling Elements of Prosodic Systems in Children (PEPS-C; Peppé & McCann, Reference Peppé and McCann2003) to examine prosodic performance in ASD. One study found that all participating children with ASD had difficulty in at least one aspect of prosodic ability (McCann, Peppé, Gibbon, O'Hare, & Rutherford, Reference McCann, Peppé, Gibbon, O'Hare and Rutherford2007). Another study showed group differences in specific aspects of the PEPS-C (Peppé et al., Reference Peppé, McCann, Gibbon, O'Hare and Rutherford2007). Peppé and colleagues (Reference Peppé, McCann, Gibbon, O'Hare and Rutherford2007) found that children with ASD had more difficulty using prosody to show affect or phrasal level stress (similar to Paul et al., Reference Paul, Bianchi, Augustyn, Klin and Volkmar2007) when compared to typical comparisons matched on verbal mental age. Still, many individuals with ASD did very well on these tasks and the lack of group differences in multiple areas was more surprising than the few subtests that found group differences.
Although some recent studies have found prosody production atypicalities in children with ASD, these studies do not appear to fully capture the extent of prosody production deficits in this population. A surprising finding in many of these studies is that individuals with ASD, especially those considered high functioning, have performed well on many of the tasks. Moreover, there is evidence that speakers with other language-related disabilities also exhibit difficulties in the prosody performance (Catterall, Howard, Stojanovik, Szcerbinski, & Well, Reference Catterall, Howard, Stojanovik, Szczerbinski and Wells2006; Marshall, Harcourt-Brown, Ramus, & van der Lely, Reference Marshall, Harcourt-Brown, Ramus and van der Lely2009; Stojanovik, Setter, & van Weijk, Reference Stojanovik, Setter and van Ewijk2007; Wells & Peppé, Reference Wells and Peppé2003), although these are less commonly reported and the investigation of their characteristics is less detailed. Because of these issues, many studies have noted the importance of using acoustic analysis, rather than behavioral observation/judgment, in order to measure more subtle prosodic differences that may be missed by other techniques (Diehl et al., Reference Diehl, Watson, Bennetto, McDonough and Gunlogson2009; McCann & Peppé, Reference McCann and Peppé2003; Paul, Augustyn, et al., Reference Paul, Shriberg, McSweeny, Cicchetti, Klin and Volkmar2005).
ACOUSTIC ANALYSIS OF PROSODY PRODUCTION IN ASD
Several studies have used acoustic measures to create experimental stimuli in studies of prosody comprehension in ASD (Chevallier, Noveck, Happé, & Wilson, Reference Chevallier, Noveck, Happé and Wilson2008; Järvinen-Pasley, Paisley, & Heaton, Reference Järvinen-Pasley, Paisley and Heaton2008), but only a handful of peer-reviewed published studies have acoustically examined prosody production in this population. The use of acoustic analysis to understand prosodic deficits in impaired populations is both important and challenging (Green & Tobin, Reference Green and Tobin2009; Peppé, Reference Peppé2009). One issue is that the coding and analysis of prosody is more difficult than other linguistic devices, and many of the available techniques are very time consuming. Still, the availability of automated computer software programs, such as PRAAT (Boersma & Weenink, Reference Boersma and Weenink2009), has allowed for more complex analyses of speech in disordered populations.
Acoustic analyses are important for several reasons. First, they afford an objective measure of speech performance that does not rely on the subjective judgments of raters. Second, acoustic analysis might allow for a more fine-grained sensitivity to group differences. Third, acoustic analysis allows the researcher to examine the details of elements of production rather than forcing an assignment of each production to a binary category. Fourth and finally, acoustic analysis of prosody has the potential for the automated processing and classification of the speech signal. This would allow for treatment paradigms in which individuals with speech disorders could receive instrumental (and possibly instantaneous) feedback for speech errors.
Several studies have examined acoustic characteristics of prosody in ASD, but only recently have there been large-scale studies of group differences. Early studies found acoustic properties in echolalic speech in ASD (Loca & Wootton, Reference Loca and Wootton1995; Paccia & Curcio, Reference Paccia and Curcio1982) that were important clues to how children with ASD were using echoed speech to communicate. Two early studies used acoustic measures of prosody in nonecholalic speech (Baltaxe, Reference Baltaxe1984; Fosnot & Jun, Reference Fosnot and Jun1999), but these studies had very small sample sizes (four to five participants) and only provided an initial indication that there were prosodic differences that could be measured instrumentally.
One of the first large-scale studies to acoustic analyses was conducted by Paul and colleagues and examined imitated speech in 44 youth and adults with ASD (ages 7–28) in comparison to 20 individuals with typical development (Paul, Bianchi, Augustyn, Klin, & Volkmar, Reference Paul, Bianchi, Augustyn, Klin and Volkmar2008). Participants listened to and imitated stressed and unstressed nonsense syllables. Paul and colleagues (Reference Paul, Bianchi, Augustyn, Klin and Volkmar2008) found that participants with ASD showed significantly less difference in duration between stressed and unstressed syllables than the TD comparison group. They also found a tendency for pitch range to be larger for participants with ASD for both stressed and unstressed syllables, although this difference failed to reach statistical significance.
A second study (Green & Tobin, Reference Green and Tobin2009) with a much smaller sample size examined spontaneous speech from elicited conversations and speech collected from paragraphs that were read aloud. This study compared children 10 Hebrew-speaking children with high-functioning ASD between the ages of 9 and 13 and 10 typical peers matched on chronological age and language level. The authors concluded that children with ASD could produce a wide range of prosodic contours, but chose a limited repertoire that were repeatedly used in conversations.
Diehl and colleagues (Reference Diehl, Watson, Bennetto, McDonough and Gunlogson2009) examined aspects of spontaneous prosodic production in narratives in two samples of individuals with ASD: one with children and one with adolescents. They found increased fundamental frequency (f0) variance in the groups with ASD when compared to typical comparison groups matched on chronological age, IQ, and measures of verbal abilities. Moreover, acoustic measures correlated with clinical judgments of autism-specific communication impairments. One drawback to this study is that the narratives were entire story retellings, and it was difficult to compare across specific acoustic characteristics of prosody (e.g., duration, f0 range) because story retellings can differ (sometimes dramatically) in their length, content, and degree of expressed emotion, among other important narrative elements.
In sum, there has been a recent resurgence in the use of acoustic measurement to understand prosodic performance in ASD. Studies have acoustically analyzed echolalic, imitative, and spontaneous speech in conversation and narratives. These studies have found important prosodic differences in f0 variance, duration of syllables, and prosodic contours. Still, these studies have examined a limited number of the acoustic features that are involved in prosody production. Moreover, several studies have examined prosodic performance across functions (e.g., to communicate affect, to structure discourse, or to determine syntactic structure), but these have generally not included acoustic measures. Thus, our knowledge of acoustic differences shown by children with ASD across these different functions is limited. Finally, none of these studies have compared individuals with ASD to a clinical comparison group without ASD in order to determine which features are specific to ASD, and which are related to developmental or learning delays.
PURPOSE OF THE STUDY
The purpose of the present study is to investigate prosody in children and adolescents with ASD using acoustic analysis of speech in comparison to a group with typical development and one with LDs. We chose the PEPS-C to elicit speech because (a) it has been used in several studies to examine prosodic performance in ASD as well as in language impairment (Wells & Peppé, Reference Wells and Peppé2003), (b) it provides data on perception and production, (c) it provides probes on several functions of prosody, and (d) the production content is standardized across participants, which allows for comparisons of multiple acoustic characteristics of prosody. In this study, we examine several acoustic characteristics of prosody (pitch range, pitch variance, duration, intensity) in PEPS-C tasks measuring four basic functions of prosody (affect, turn-end type, chunking/syntax, stress). Based on previous studies, we predicted acoustic differences in prosody production between children with ASD and the two comparison groups. Based on previous research, we predict that participants with ASD will have larger pitch ranges and greater pitch variance than both control groups, and that there would be differences in duration, although we did not have a prediction on the direction of duration differences. Based on clinical reports, we also predict acoustic differences in the intensity of speech, although these analyses are exploratory based on the paucity of previous research on this characteristic. We predicted that differences would be present across different functions, and present both for correct and incorrect responses, and that this would indicate differences in the fine details of the acoustic output, whether the function was judged as correct by listeners.
METHODS
Participants
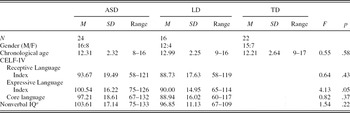
ASDs. Participants in this group were 24 individuals with ASD between the ages of 8 and 16 (see Table 1 for descriptive characteristics). Participants with ASD were selected for the study from a database of children who had participated in either clinical or research activities at the Yale Child Study Center during the 5 years prior to data collection for the present study. Diagnostic characterization included the Autism Diagnostic Interview—Revised (Rutter, Le Couteur, & Lord, Reference Rutter, Couteur and Lord2003) and the Autism Diagnostic Observation Schedule—Generic (Lord et al., Reference Lord, Risi, Lambrecht, Cook, Leventhal and DiLavore2000). Each participant met DSM-IV-TR (APA, 2000) criteria for one of the three ASDs (autistic disorder, Asperger syndrome, or PPD-NOS). Clinical diagnoses were confirmed independently by two experienced clinicians. Interrater reliability between these clinicians for diagnostic assignment was high, with kappa values ranging from 0.80 to 0.95 in related research projects (Klin, Lang, Cicchetti, & Volkmar, Reference Klin, Lang, Cicchetti and Volkmar2000). Children with ASD were given a language evaluation using the Clinical Evaluation of Language Fundamentals—Fourth Edition (CELF-4; Semel, Wiig, & Secord, Reference Semel, Wiig and Secord2003) in order to determine the current level of language functioning. Participants were excluded from this study if had any uncorrected sensory disorders (vision or hearing) or any known neurological conditions.
Descriptive characteristics of the sample

Note: CELF-IV, Clinical Evaluation of Language Fundamentals, Fourth Edition. ASD, autism spectrum disorder; LD, learning disability; TD, typically developing.
a Nonverbal IQ was measured using either the performance IQ scaled score from the Wechsler Abbreviated Scale of Intelligence (Wechsler, Reference Wechsler1999) or the Nonverbal IQ Scale from the Differential Ability Scales (Elliott, Reference Elliott1990). Some nonverbal IQ scores were missing for participants, so for these analyses N = 18 for the ASD group and N = 13 for the LD group.
Learning disabilities. Participants included 16 children between the ages of 9 and 16 (see Table 1 for descriptive characteristics). Participants in this group were recruited through a community speech–language pathologist. For inclusion in the LD group, children needed to have a clinically diagnosed learning disability and needed to be at the appropriate grade level for their chronological age. Per parent report, 5 participants were identified as having a reading disability, and 11 were identified as having a language-based learning impairment, although the type of impairment was not specified. All were screened via clinical interview and found not to exhibit ASD. Family history showed no evidence of a first degree relative with an ASD diagnosis. Children with LD were also given a brief cognitive and language evaluation. The groups were matched on chronological age, and had similar nonverbal IQs, CELF-4 core language and receptive language scores. Because many participants in the group with LD had a language-based LD, the ASD group tended to have higher scores on both measures, and had significantly higher CELF-4 expressive language scores.
TD comparison group. Participants included 22 children between the ages of 8 and 17 (see Table 1 for descriptive characteristics). TD participants were recruited from the community. All participants in this group had typical development as reported by their parents, had no first-degree relatives with an ASD, no previous history of clinical diagnosis or special educational services, and were reported to be in the appropriate grade for their age in school. The TD group was matched to the ASD and LD groups on chronological age.
Procedures
Setup and equipment. Participants were seated at a table on which there was a Dell Inspiron 3900 computer that contained the PEPS-C program. Participants wore a Shure SM10A professional unidirectional head-mounted dynamic microphone, which was connected to a TASCAM US-122 USB Audio/MIDI Interface. The TASCAM connected directly into the Dell computer. Recordings had a sampling rate of 44.1 kHz.
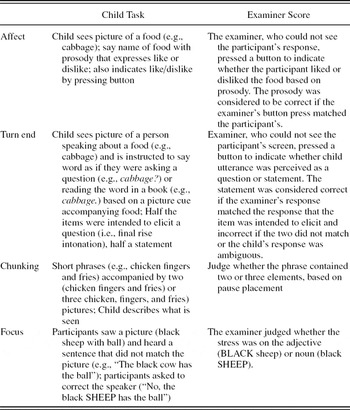
Stimuli. Participants completed the PEPS-C (Peppé & McCann, Reference Peppé and McCann2003), an instrument designed to assess prosody performance in children aged 4–16 (Wells & Peppé, Reference Wells and Peppé2004). This measure contains 12 subtests divided into six categories (affect, turn-end type, chunking, focus, prosody, intonation). For each of the categories, there is an “input” (comprehension) and “output” (production) subtest. Four of the categories (affect, turn-end type, chunking, focus) are “function” categories that test a participants’ ability to understand and use prosody in a way that communicates a specific function, such as an affective state. Two of the categories (prosody, intonation) are “form” categories, and are comprised of simple pitch/melody discrimination and productive imitation. Although comparisons between form and function can elucidate many questions about the nature of prosodic deficits, these comparisons are beyond the scope of this paper and will be addressed in a separate report. The PEPS-C has been used to gather some normative data from TD children (Peppé & McCann, Reference Peppé and McCann2003), and trained listeners’ perceptual judgments of PEPS-C responses have been used in several studies to investigate prosody performance in children with a range of disabilities (e.g., Catterall et al., Reference Catterall, Howard, Stojanovik, Szczerbinski and Wells2006; Marshall et al., Reference Marshall, Harcourt-Brown, Ramus and van der Lely2009; McCann et al., Reference McCann, Peppé, Gibbon, O'Hare and Rutherford2007; Peppé et al., Reference Peppé, McCann, Gibbon, O'Hare and Rutherford2007; Peppé & McCann, Reference Peppé and McCann2003; Stojanovik et al., Reference Stojanovik, Setter and van Ewijk2007; Wells & Peppé, Reference Wells and Peppé2003). The PEPS-C is perhaps the most widely used standard measure of prosodic function in this literature (Peppé, Reference Peppé2009).
Data collection. For each of the subtests, the experimenter demonstrated the correct answer on two training trials in order to explain the task to the participant. The participant then completed two additional practice items, during which the experimenter would correct the participant for incorrect responses in order to ensure that the participant understood the task. Each subtest contained 16 experimental trials. Behavioral data was collected for the input subtests. Participants indicated their response by clicking on one of two possible response choices, and the computer program automatically coded the response as correct or incorrect. For the output subtests reported here (see Table 2), participants’ responses were judged as correct or incorrect by a trained examiner. For all subtests that involved examiner judgment, responses from a randomly selected 10% sample of participants were independently scored by a second examiner. Average point to point reliability for correct/incorrect judgments on each subtest across participants ranged from 0.84 to 0.96, with an average agreement of 0.88 across subtests.
Description of PEPS-C output tasks

Note: PEPS-C, Profiling Elements of Prosodic Systems in Children.
Acoustic analyses. Output responses were audio-recorded, and vocalizations from the critical trials on all of the function output subtests were examined for the following acoustic characteristics of prosody: average f0 across the entire utterance, the difference between maximum and minimum f0, or f0 range (sometimes called accent range; Paul et al., Reference Paul, Bianchi, Augustyn, Klin and Volkmar2008), standard deviation (SD) of f0 (as measured in Diehl, Bennetto, Watson, Gunlogson, & McDonough, 2008), utterance duration, and utterance intensity. We used PRAAT, a program for speech analysis and synthesis (Boersma & Weenink, Reference Boersma and Weenink2009), for acoustic analyses. The computer automatically divided sound files into individual trials. In PRAAT, text grids were created to delineate the beginning and end of each vocalization. PRAAT scripts were created to extract automatically the desired acoustic characteristics for each trial.
RESULTS
Data analysis plan
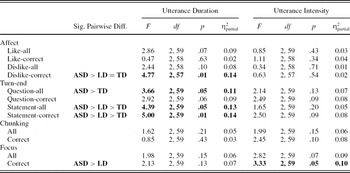
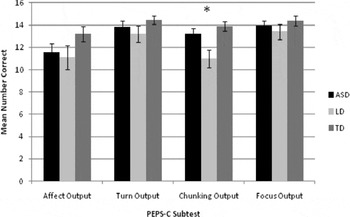
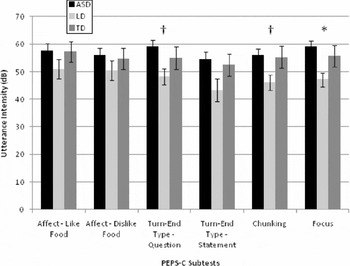
All analyses were conducted using a one-way analysis of variance (ANOVA) with group membership (ASD, LD, TD) as the independent variable and either behavioral response accuracy or one of the five acoustic measures as the dependent variables. An omnibus one-way ANOVA was conducted including all three groups. Because of the large number of measurements, we only conducted paired group comparisons (i.e., ASD vs. LD, ASD vs. TD, LD vs. TD) if the omnibus F was significant (p < .05) in order to reduce the likelihood of Type I error. Effect sizes were calculated as partial eta squared (η2partial), which refers to the proportion of variance attributable to a given effect, after partialing out other nonerror sources of variance (Cohen, Reference Cohen1973). Behavioral response data appear in Figure 1 and Figure 2. Statistical test results on acoustic measures for all subtests appear in Table 3 and Table 4, and means and standard errors appear in Figure 3, Figure 4, Figure 5, Figure 6, and Figure 7.
Analyses of variance on acoustic measures of fundamental frequency

Note: Bold groups are significantly different at p < .05. Pairwise difference between diagnostic groups for significant omnibus F is significant at p < .05. ASD, autism spectrum disorder; TD, typically developing; LD, learning disability.
Analyses of variance on acoustic measures of utterance duration and intensity

Note: Boldface groups are significantly different at p < .05. Pairwise difference between diagnostic groups for significant omnibus F is significant at p < .05. ASD, autism spectrum disorder; LD, learning disability; TD, typically developing.
The mean number correct on behavioral responses from Profiling Elements of Prosodic Systems in Children (PEPS-C; Peppé & McCann, Reference Peppé and McCann2003) input (comprehension) tasks. The statistical tests represent an omnibus analysis of variance for each subtest. †p < .10. *p < .05.

The mean number correct on behavioral responses from Profiling Elements of Prosodic Systems in Children (PEPS-C; Peppé & McCann, Reference Peppé and McCann2003) output (production) tasks. The statistical tests represent an omnibus analysis of variance for each subtest. Error bars represent the standard error of the mean. *p < .05.

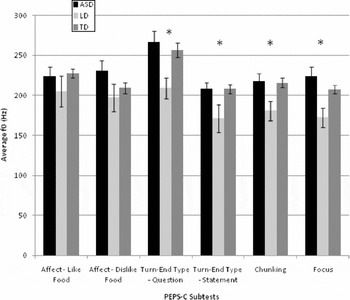
The average fundamental frequency, organized by task, for each participant group. The statistical tests represent an omnibus analysis of variance for each subtest. Error bars represent the standard error of the mean. PEPS-C, Profiling Elements of Prosodic Systems in Children (Peppé & McCann, Reference Peppé and McCann2003). *p < .05.

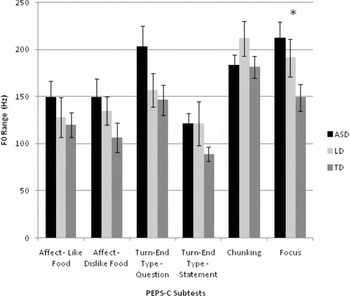
The fundamental frequency range for correct responses, organized by task, for each participant group. The statistical tests represent an omnibus analysis of variance for each subtest. Error bars represent the standard error of the mean. PEPS-C, Profiling Elements of Prosodic Systems in Children (Peppé & McCann, Reference Peppé and McCann2003). *p < .05.

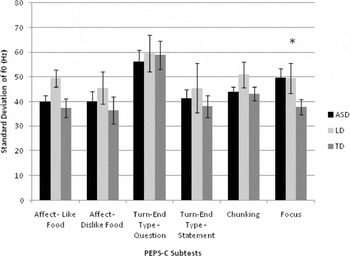
The standard deviation of the fundamental frequency for correct responses, organized by task, for each participant group. The statistical tests represent an omnibus analysis of variance for each subtest. Error bars represent the standard error of the mean. PEPS-C, Profiling Elements of Prosodic Systems in Children (Peppé & McCann, Reference Peppé and McCann2003). *p < .05.

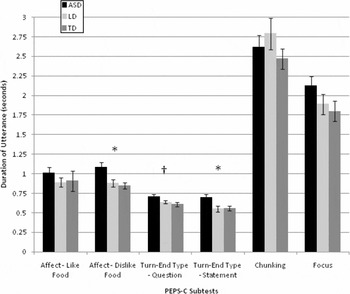
The average utterance duration for correct responses, organized by task, for each participant group. The statistical tests represent an omnibus analysis of variance for each subtest. Error bars represent the standard error of the mean. PEPS-C, Profiling Elements of Prosodic Systems in Children (Peppé & McCann, Reference Peppé and McCann2003). †p < .10. *p < .05.

The average utterance intensity for correct responses, organized by task, for each participant group. The statistical tests represent an omnibus analysis of variance for each subtest. Error bars represent the standard error of the mean. PEPS-C, Profiling Elements of Prosodic Systems in Children (Peppé & McCann, Reference Peppé and McCann2003). †p < .10. *p < .05.

Our original plan was to separately investigate acoustic differences on correct and incorrect responses for each subtest. We were unable to conduct analyses on incorrect responses for any item, however, because a substantial minority of participants in each group did not miss any items on any one particular subtest. This greatly reduced the sample sizes for incorrect responses, and limited our ability to detect even large effect sizes. We instead conducted analyses on all responses (correct and incorrect), and then on only correct responses.
Affect
Affect behavioral findings. In this subtest, we examined the ability of participants to recognize types of affective prosody, and their ability to use prosody to indicate whether they liked or disliked a food item. One-way ANOVAs revealed that the groups differed on the affect input subtest, F (2, 59) = 3.45, p < .05, η2partial = 0.11, but not on the affect output subtest, F (2, 59) = 1.85, p = .17, η2partial = 0.06. On the affect input subtest, the TD group performed significantly better than the group with ASD, F (1, 44) = 5.97, p < .05, η2partial = 0.12, and the group with LD, F (1, 36) = 5.90, p < .05, η2partial = 0.14, but the groups with ASD and LD did not differ in their performance, F (1, 38) = 0.27, p = .61, η2partial = 0.007.
Affect acoustic findings.
LIKE RESPONSES.Footnote 2 For all correctly interpreted items on which participants indicated that they liked the food, one-way ANOVAs revealed no significant group differences in average f0, f0 variability or range, utterance intensity, or utterance duration. We then examined responses that were intended to convey liking by the participant and were correctly interpreted as “like” by raters, and these findings were similar across groups.
DISLIKE RESPONSES.Footnote 3 For all items on which participants indicated that they did not like the food, one-way ANOVAs revealed no significant group differences on any of our acoustic measures. When only utterances that were intended to be and judged to be dislike responses (correct dislike) were analyzed, there was a significant group difference on utterance duration, but no significant group differences on the other acoustic measures. The group with ASD had significantly longer utterance duration on correct dislike responses than did the group with LD, F (1, 36) = 4.00, p < .05, η2partial = 0.10, and the TD group, F (1, 42) = 7.56, p < .01, η2partial = 0.15. The LD and TD groups did not differ on this measure, F (1, 36) = 0.29, p = .60, η2partial = 0.008.
AFFECT SUMMARY. The TD group scored higher than the groups with LD and ASD on the affect input task, but there were no group differences in behavioral responses on the output task. The participants with ASD tended to produce longer utterances than other groups on items for which the participant intended to express dislike for the food and the rater interpreted the response as an expression of dislike (correct dislike responses). No other acoustic differences were observed among groups.
Turn-end type
Turn-end type behavioral findings. In this subtest, we measured participants’ ability understand when prosody was being used to ask a question, and their ability to use prosody to indicate a question or a statement. There was a marginal omnibus effect of group on the input task, F (2, 59) = 2.68, p = .08, η2partial = 0.08. The TD group scored significantly higher than the groups with ASD, F (1, 44) = 4.75, p < .05, η2partial = 0.10, and LD, F (1, 36) = 5.54, p < .05, η2partial = 0.13, but there was no difference in performance between the groups with ASD and LD, F (1, 38) = 0.10, p = .75, η2partial = 0.003. The three groups were not significantly different in their performance on the turn-end type output subtests, F (2, 59) = 1.18, p = .31, η2partial = 0.02.
Turn-end type acoustic findings.
QUESTIONS. For items that were designed to elicit rising intonation contours (questions), one-way ANOVAs revealed significant group differences in average f0 and utterance duration, but no significant differences in f0 range, SD of f0, or intensity. The group with LD had a significantly lower average f0 than the group with ASD, F (1, 38) = 6.52, p < .05, η2partial = 0.15, and TD, F (1, 36) = 8.90, p < .01, η2partial = 0.20. The ASD and TD groups did not significantly differ on average f0, F (1, 44) = 0.11, p = .74, η2partial = 0.003. The ASD group produced utterances that were significantly longer in duration than the TD comparison group, F (1, 44) = 5.58, p < .05, η2partial = 0.12, and marginally longer than the group with LD, F (1, 38) = 2.84, p < .10, η2partial = 0.07. The LD and TD comparison groups were not significantly different on duration, F (1, 36) = 0.73, p = .40, η2partial = 0.02. We also examined vocalizations that were designed to elicit questions and the responses were interpreted as questions by the examiner (correct questions). Here, one-way ANOVAs revealed significant group differences in average f0, but not on any other acoustic measures. The group with LD had a significantly lower average f0 on correct questions than the group with ASD, F (1, 38) = 8.56, p < .01, η2partial = 0.19, as well as the TD comparison group, F (1, 36) = 9.63, p < .01, η2partial = 0.22. The ASD and TD groups did not differ on average f0, F (1, 44) = 0.34, p = .56, η2partial = 0.008.
STATEMENTS. For items that were designed to elicit responses with falling intonation contours (statements), one-way ANOVAs revealed a significant group difference in utterance duration, but not for any other acoustic variable. The group with ASD had significantly longer utterance duration than the group with LD, F (1, 38) = 4.50, p < .05, η2partial = 0.11, and the TD group, F (1, 44) = 6.19, p < .05, η2partial = 0.13. The LD group had a significantly longer duration than the TD group, F (1, 35) = 9.63, p < .01, η2partial = 0.22. For items designed to elicit statements that were interpreted as statements by the raters (correct statements), one-way ANOVAs revealed significant overall group differences in average f0 and utterance duration, but no group differences on the other acoustic measures. On this comparison, the group with LD had a significantly lower average pitch than the group with ASD, F (1, 38) = 4.71, p < .05, η2partial = 0.11, or the TD group, F (1, 36) = 5.15, p < .05, η2partial = 0.13, while the ASD and TD groups did not differ significantly, F (1, 44) = 0.00, p = .97, η2partial = 0.001. For duration of utterance, however, the ASD group had significantly longer utterances than both the group with LD, F (1, 38) = 6.89, p < .01, η2partial = 0.15, and the TD group, F (1, 44) = 6.52, p < .01, η2partial = 0.13, but the LD and TD groups did not significantly differ on this variable, F (1, 35) = 0.15, p = .70, η2partial = 0.004.
Turn-end type summary. Similar to the affect subtests, the groups with ASD and LD had more difficulty on the turn-end type input subtest than the TD group, but there were no group differences on the output subtest. In contrast to the affect subtests, we found fairly consistent group differences in two acoustic measures. Participants with ASD had consistently longer utterances than either group, both for questions and statements. Of interest, their responses were longer even for statements that were judged to be statements with correct prosody. The group with LD had a significantly lower average f0 than the other groups for questions and statements, even when they were judged to be correct in their usage of prosody.
Chunking
Chunking behavioral findings. In this subtest, we examined participants’ ability understand prosodic phrase breaks, and their ability to use them to delineate the syntactic structure and meaning of the utterance. We tested group performance on the PEPS-C chunking input and output subtests using one-way ANOVAs. For chunking input subtests, there were no significant overall group differences, F (2, 59) = 1.61, p = .21, η2partial = 0.05. For output subtests, there were significant group differences, F (2, 59) = 6.12, p < .01, η2partial = 0.17. The LD group performed significantly worse than the group with ASD, F (1, 38) = 5.70, p < .05, η2partial = 0.13, and the TD comparison group, F (1, 36) = 11.73, p < .01, η2partial = 0.25, although there was no significant difference between the ASD and TD comparison group, F (1, 44) = 1.01, p = .32, η2partial = 0.02.
Chunking acoustic findings. Overall, one-way ANOVAs revealed significant group differences in average f0, but not on other acoustic measures. For average f0, the group with LD had a significantly lower average f0 than the group with ASD, F (1, 38) = 5.23, p < .05, η2partial = 0.12, and the TD group, F (1, 36) = 7.68, p < .01, η2partial = 0.18. The ASD and TD groups did not differ on average f0, F (1, 44) = 0.01, p = .91, η2partial = 0.001.
We then analyzed responses on this subtest that were rated as correct by our trained examiners (correct chunking). For these responses, the only significant group difference was in average f0. There were no significant group differences on other acoustic measures. The LD group had a significantly lower average f0 than the groups with TD, F (1, 36) = 7.99, p < .01, η2partial = 0.19, and with ASD, F (1, 38) = 5.54, p < .05, η2partial = 0.13. The ASD and TD groups did not differ significantly in average f0 for correct responses, F (1, 44) = 0.04, p = .84, η2partial = 0.001.
Chunking summary. Overall, the groups performed similarly on the chunking input subtest, but the group with LD had greater difficulty than the other groups on the output subtest. An acoustic analysis of vocalizations on the output subtest revealed that the LD group had a lower average f0 than both groups, even when their responses were correct. There were no significant group differences on other acoustic variables.
Stress (PEPS-C focus subtests)
Focus behavioral findings. In this subtest, we examined participants’ ability to understand sentence stress, and their ability to use it to highlight new information in a statement. We tested group performance on the PEPS-C focus input and output subtests using one-way ANOVAs. There were significant group differences on focus input, F (2, 59) = 4.02, p < .05, η2partial = 0.12, but not focus output, F (2, 59) = 0.83 p = .43, η2partial = 0.03. On the input task, the TD group scored significantly higher than the groups with ASD, F (1, 44) = 4.59, p < .05, η2partial = 0.09, and LD, F (1, 36) = 12.37, p < .001, η2partial = 0.26, but the groups with ASD and LD did not differ significantly from each other, F (1, 38) = 0.42, p = .52, η2partial = 0.01.
Focus acoustic findings. For focus output, one-way ANOVAs revealed significant group differences in average f0, f0 range, and SD of f0, but no differences in utterance intensity or duration. The group with LD had a significantly lower average f0 than the group with ASD, F (1, 38) = 7.04, p < .01, η2partial = 0.16, and TD group, F (1, 36) = 6.64, p < .01, η2partial = 0.16, but the ASD and TD groups did not differ, F (1, 44) = 1.57, p = .22, η2partial = 0.03. For the f0 range, the group with ASD had a significantly higher f0 range than the TD group, F (1, 44) = 9.07, p < .01, η2partial = 0.17, the LD group had a marginally higher f0 range than the TD group, F (1, 36) = 2.99, p = .09, η2partial = 0.08, but the groups with ASD and LD did not differ, F (1, 38) = 1.10, p = .30, η2partial = 0.03. For SD of f0 on the focus output subtest, the groups with ASD and LD had a significantly higher SD of f0 than the TD group, F (1, 44) = 5.95, p < .05, η2partial = 0.12, and F (1, 36) = 4.80, p < .05, η2partial = 0.12, respectively, but again the groups with ASD and LD did not differ significantly from each other, F (1, 38) = 0.10, p = .75, η2partial = 0.003.
We also analyzed focus output responses that were judged by raters to be correct (correct focus). For correct focus responses, there were significant group differences in average f0, f0 range, SD of f0, and utterance intensity, but the difference in utterance duration was not statistically significant. As with overall focus output findings, the group with LD had significantly lower average pitch than the group with ASD, F (1, 38) = 7.76, p < .01, η2partial = 0.17, and TD group, F (1, 36) = 9.26, p < .01, η2partial = 0.21, whereas the ASD and TD groups did not differ significantly, F (1, 44) = 1.27, p = .27, η2partial = 0.03. The findings for f0 range were also nearly identical. The group with ASD had a significantly higher f0 range than the TD group, F (1, 44) = 7.66, p < .01, η2partial = 0.15, the LD group had a marginally higher f0 range than the TD group, F (1, 36) = 3.17, p = .08, η2partial = 0.08, but the groups with ASD and LD did not differ, F (1, 38) = 0.58, p = .45, η2partial = 0.02. For SD of f0, the group with ASD had a significantly higher SD of f0 than the TD group, F (1, 44) = 6.54, p < .01, η2partial = 0.13, the LD group had a marginally higher f0 range than the TD group, F (1, 36) = 3.45, p = .07, η2partial = 0.09, but the groups with ASD and LD did not differ, F (1, 38) = 0.01, p = .94, η2partial = 0.001. For intensity, the group with ASD had a significantly higher intensity than the LD group, F (1, 38) = 11.00, p < .001, η2partial = 0.23, but the TD group did not differ from either the group with ASD, F (1, 44) = 0.56, p = .46, η2partial = 0.01, or the group with LD, F (1, 36) = 2.66, p = .11, η2partial = 0.07.
Focus summary. Overall, the groups with ASD and LD had more difficulty with the input subtest than the TD groups, but there were no differences in performance on the output subtest. On the acoustic measures, the groups with ASD and LD had significantly higher f0 ranges and SD of f0 than the TD group, even for correct responses. Similar to other tasks, the LD group had a lower average f0 than the other two groups. This was the only task that found group differences in utterance intensity. The group with ASD had higher utterance intensity than the group with LD.
DISCUSSION
The purpose of this study was to use acoustic measures in addition to raters’ perception of behavioral responses to investigate prosodic performance in children with ASD in comparison to participants with TD and those with LD. Study stimuli were drawn from the PEPS-C, a measure of prosodic abilities that has been used in several studies to examine prosodic performance in ASD and related disorders. The PEPS-C provided structured samples of speech output in response to prosodic tasks involving several different functions of prosody, which were matched by analogous tasks measuring receptive abilities. Thus, production content was standardized across participants, which allowed for acoustic comparisons of multiple aspects of prosody on similar tokens for all participants. We predicted that there would be differences among diagnostic groups in both raters’ perception of prosodic output in response to these tasks, as well as in the acoustic parameters of their prosodic production.
The findings on the input tasks are consistent with previous research that shows both children with ASD and those with language-based learning difficulties have difficulty accurately interpreting some (but not all) prosodic cues. Children with LD and ASD made more errors than TD children in interpreting prosody marking distinctions between questions and statements. Children with LD and ASD also shared the difficulties in interpreting affect and emphatic stress. These shared difficulties suggest a more pervasive difficulty in making sense of the suprasegmental layer of meaning in discourse. The findings from the LD group should be interpreted with caution, however, because our group with LD was heterogeneous. Although most had language-based deficits, there was a small minority who did not present with language-based disabilities, but had reading problems only.
The only significant behavioral difference in the output tasks was that children with LD were more likely to be misinterpreted on their production of sentence phrasing in the chunking task. These findings could be interpreted several ways. One interpretation might stem from the divergence in findings on input versus output items. That is, for children with both LD and ASD interpreting others’ prosodic productions may require the integration of several levels of information processing (segmental, semantic, syntactic, suprasegmental), and processing prosody in conjunction with the processing of material at other levels that present challenges may be especially difficult. If this were the case, production may be relatively spared because much of the production to be generated was cued by the pictured or written stimuli on the task, leaving processing resources relatively freed up to focus on prosody. If this were the case, it would suggest that, perhaps, it is not prosody per se that presents difficulty, but rather the processing load inherent in the need to interpret multiple levels of linguistic input. This speculation could be tested by further research. These findings do, however, emphasize that other groups with communication disorders are also vulnerable to prosodic problems. Although prosodic deficits have long been associated with ASD, numerous studies (e.g., Catterall et al., Reference Catterall, Howard, Stojanovik, Szczerbinski and Wells2006; Marshal et al., Reference Marshall, Harcourt-Brown, Ramus and van der Lely2009; Stojanovik et al., Reference Stojanovik, Setter and van Ewijk2007; Wells & Peppé, Reference Wells and Peppé2004) have shown them to be present in other populations with communication difficulties, and the present findings lend support to the notion that children with ASD show prosodic difficulties that are not entirely unlike those of other communicatively impaired children.
An additional aim of the present study was to expand the present understanding of findings based on listeners’ perception of prosody by examining the acoustic properties of prosodic output in order to better characterize the prosodic production of children with ASD and LD. Our findings do reveal some acoustic differences between the three comparison groups. In general, the differences for children with ASD tended to be seen in longer durations, particularly on the two tasks that involved only single word productions (affect and turn-end). This finding echoes that of Paul et al. (Reference Paul, Bianchi, Augustyn, Klin and Volkmar2008), who showed that the timing of stressed versus unstressed syllables was less differentiated in speakers with ASD than in those with TD. Taken together, these findings suggest difficulties in the controlling precise temporal aspects of word production. Shriberg, Paul, Black, and van Santen (Reference Shriberg, Paul, Black and van Santen2011) have suggested that one explanation for speech difficulties in speakers with ASD is a difficulty in attunement to ambient conventions for community-acceptable production. That is, speakers with ASD have difficulty “tuning up” their productions to emulate models provided by other speakers, so that subtle differences that are detectable without necessarily affecting category boundaries, are present. Paul et al. (Reference Paul, Bianchi, Augustyn, Klin and Volkmar2008) speculated that these attunement difficulties may be attributable to a dearth of social motivation to “talk just like” other speakers in the community, which can result in a range of subtle differences, including failure to acquire community-appropriate accent or dialect (Baron-Cohen & Staunton, Reference Baron-Cohen and Staunton1995) and persistence of distortions in speech sounds that are “outgrown” by typical speakers (Shriberg et al., Reference Shriberg, Paul, McSweeny, Klin, Cohen and Volkmar2001).
For children with LD, the major differences were seen in terms of average fundamental frequency, but not on all tasks, as would be the case if their voices were simply pitched lower. In addition, both ASD and LD children showed more variable pitch than those with TD when attempting to express emphatic stress (again replicating Paul et al., Reference Paul, Bianchi, Augustyn, Klin and Volkmar2008), and the group with ASD showed significantly increased intensity in this context as well. These acoustic differences were present despite the fact that listeners perceived the children with ASD and LD to be producing acceptable prosody in all the tasks; the only output task to show significant deficit was the production of sentential phrasing on the chunking task by the LD group. Thus, despite difficulties in some aspects of prosody perception, these children are producing more or less acceptable prosodic tokens in this structured assessment, despite subtle differences in the fine details of the acoustic output.
Thus, a second potential explanation for these present findings showing more between group differences in production than in perception is that this IS a structured task. These high-functioning children were given a relatively large number of training items prior to each task. The administration of the test has practice items for which the correct prosody usage is modeled for the participant (Diehl & Paul, Reference Diehl and Paul2009). Second, the large number of trials, and the similar nature of trials within a subtest that are said one after another, limits the ecological validity of the utterances that are produced.
Therefore, participants’ high level of performance on output tasks, despite some difficulties with perception, could be due to their learning the basic rules of each PEPS-C subtest and being able to implement them in this relatively simple task in which they interacted with a computerized interlocutor, rather than a person. Thus, as attractive as a standard task may be for studying prosodic ability, it may have less validity when compared to the kinds of varying, fast-paced, on-line production planning that goes on in spontaneous conversation. Of interest, previous acoustic studies found significant groups differences with more naturalistic tasks such as narratives (Diehl et al., Reference Diehl, Watson, Bennetto, McDonough and Gunlogson2009), but those using prosodic imitation tasks did not find similar differences (Paul et al., Reference Paul, Bianchi, Augustyn, Klin and Volkmar2008).
Limitations and future directions
We were unable to examine incorrect responses because several participants in each group did not miss a single item on each of the subtests. This occurrence resulted in significantly reduced sample sizes in the incorrect conditions that limited our ability to detect very large effect sizes. Future studies should consider using younger children for their sample in order to reduce these ceiling effects.
Although the ASD and LD groups were not significantly different on nonverbal IQ, they were individually matched, and the group with LD, consistent with their diagnosis of language-based learning disability, also had lower CELF scores than the ASD group. Moreover, the group with LD was heterogeneous and included individuals with a range of profiles including both language-based learning disabilities and more specific reading deficits. Nonetheless, the fact that the group with LD performed worse (although not always significantly worse) on the behavioral measures of perception and production of prosody was surprising given prevalence of reports on prosodic deficits in ASD. Although this could be attributed to differences in general verbal ability, Wells and Peppé (Reference Wells and Peppé2003) have argued from data on children with specific language impairments that prosodic ability appears to be relatively discrete from other levels of language functioning in this population, but could be a factor of the lower general language abilities of this group. For this study, we aimed to include a sample of children with high-functioning ASD that was representative of this population, with its generally high levels of formal language skill (Tager-Flusberg et al., Reference Tager-Flusberg, Paul, Lord, Volkmar, Paul, Klin and Cohen2005), rather than one that was specifically selected to match the LD group with its lower verbal abilities. It would be useful in future studies to match contrast groups more closely on verbal and nonverbal IQ in order to determine what prosodic deficits are present beyond general language deficits.
Another important question is that, even though we found acoustic differences, how can we tell whether or not the acoustic differences are within the acceptable range of human speech? One way to examine this question would be to collect subjective ratings of perceived differences in prosody production beyond its functional use. These data could be collected from trained professionals, naïve listeners, or both. Future studies should examine whether the subtle acoustic differences we have observed are related to subjective perception ratings of others.
Finally, the acoustic measures we used were broad and administered across the entire utterance, and did not look at specific functions in areas within the word or utterance. Green and Tobin (Reference Green and Tobin2009) suggested that individuals with ASD use a restricted range of prosodic contours, and McCann and colleagues (Reference McCann, Peppé, Gibbon, O'Hare and Rutherford2007) found that all of their participants with ASD were impaired in one area of prosodic performance, but the area of impairment differed between individuals. Shriberg et al. (Reference Shriberg, Paul, McSweeny, Klin, Cohen and Volkmar2001) reported that only half the adults with high-functioning autism they studied could be said to have any prosodic difficulties. Our measures were not sensitive to these types of individual differences.
Clinical implications
This study has several important clinical implications. First, acoustic analysis of prosody has the potential for providing automatic feedback for children who struggle with prosodic production (Kim, Newland, Paul, Scassellati, & Diehl, Reference Kim, Newland, Paul, Scassellati and Diehl2008). This study suggests that the acoustic differences in utterance duration, pitch range, and perhaps intensity are areas of particular difficulty for individuals with ASD. Several commercial software applications are available that provide visual feedback on these parameters, and these may prove useful in helping to normalize prosodic production in individuals with ASD. Second, the study supports findings of others that individuals with language-based learning disorders are also challenged in prosody performance. As more effective prosodic treatments emerge, LD as well as ASD populations may be considered as candidates for these treatments. Third, our findings emphasize, as earlier studies (e.g., Paul, Augustyn, et al., Reference Paul, Augustyn, Klin and Volkmar2005) have suggested, that it is not only production of prosody that requires intervention. For whatever reason, the participants in this study in both clinical groups experience difficulty in selected aspects of both interpretation and production of prosody. As treatments are developed to address this area of communication disorder, they will need to be focused on both correct interpretation of prosodic input as well as acceptable production. Fourth, prosodic interventions should consider factors beyond the correct linguistic application of prosody and also focus on differences in stylistic presentation of speech (pitch range, intensity, etc.) that go beyond the content of the communication. Fifth and finally, prosodic interventions may benefit from an understanding not only of the degree to which speakers with ASD get prosody “right” or “wrong,” but also of the ways in which their production differ subtly from that of typical speakers even when they are interpreted correctly. This understanding can help to inform interventions aimed at decreasing the perceived “oddity” so often reported for speakers with ASD.
ACKNOWLEDGMENTS
This paper was supported by the NIDCD Grant K24 HD045576 (to R.P.), NICHD Grant P01-HD03008 (Project 3), and the James Hudson Brown and Alexander Brown–Coxe Postdoctoral Fellowship through the Yale School of Medicine. We thank the children and families who made this work possible. We also thank Lauren Berkovits, Daria Diakonova, Casey Dolezal, Kate Elliott, Tracey Gemmell, Allison Lee, Joshua Noffsinger, Beck Roan, Lauren Schmitt, Elizabeth Schoen, Nicole Shea, Kristin Uhland, and Megan Van Ness for their contributions to this project, which included participant recruitment, data collection, and data management.