


NOMENCLATURE
- CFD
-
computational fluid dynamics
- EU FP7
-
European Union Framework Programme 7
- FAA
-
Federal Aviation Administration
- FED
-
fractional effective dose
- FIC
-
fractional irritant concentration
- FIH
-
fractional incapacitating dose of heat
- FIN
-
fractional incapacitating dose of narcotic agents
- HRR
-
heat release rate (kW)
- ROW
-
right over wing
- TSB
-
transportation safety board
1.0 INTRODUCTION
On 22 August 1985, a B737-236 suffered an uncontained engine failure and fire during its take-off roll at Manchester Airport, England(Reference King1). During the accident, the external fuel fire entered the cabin after burn-through of the fuselage via vent grills, cabin walls and window seals assisted by a relatively mild wind. During the fire incident, two of the four cabin crew and 53 of the 131 passengers died, and a further 15 passengers were severely injured by the effects of the fire and toxic gases. The forward left (Exit L1), forward right (Exit R1) and right over-wing (Exit ROW) exits were utilised during the evacuation. From the official accident investigation report, it is suggested that the delay in opening the exit doors was one of the key factors contributing to the high fatality rate in this accident, but how significant this contribution was could not be evaluated. It is also suggested that the right rear exit (Exit R2), opened but not used for evacuation, may have contributed to the high fatality rate by allowing smoke to enter the cabin. Again, how significant this event was to contributing to the number of fatalities could not be assessed. As this fire occurred some 30 years ago, it is also of interest to determine whether improvements in passive fire protection achieved through the development of modern cabin materials since 1985 could have made a significant difference to passenger survivability in this type of accident.
This is an important issue, as unfortunately aircraft fires of this type are not rare. Almost 30 years to the day after the Manchester B737 accident, a B777 aircraft caught fire at McCarran International Airport in Las Vegas, Navada, USA(2). As in the 1985 accident, the B777 fire, which occurred on 9 September 2015, also started from a failed engine and occurred during the take-off phase. In this incident, wind also appears to be blowing the fire plume onto the fuselage and fuselage burn-through occurs. Fortunately, however, all 170 people on board successfully evacuated in this accident. Thus, while this study focuses on the events of 1985, the findings still have important application to modern-day fire safety and the current generation of commercial aircraft.
Since the start of commercial aviation, fire and emergency evacuation have been concerns shared by operators, regulators and the travelling public(Reference Hall, Hammerschmidt, Goglia, Black and Carmody3). The industry has worked hard to reduce the likelihood of fire and, in the event of fire, to reduce the speed of its spread and to ensure that passengers threatened by fire can rapidly and safely evacuate. Most of this development has been supported by full-scale experimental studies to understand the development of aircraft cabin fires and assess passenger survivability(Reference Sarkos4). However, full-scale fire tests are time-consuming and expensive. Thus, the number of fire scenarios that can be practically examined is limited. As a result, studying the impact of a realistic external wind on aircraft fire, as occurred in the 1985 B737 and the 2015 B777 fires, through full-scale fire tests is impractical. This type of analysis must rely on computer simulation.
Fire field modelling using Computational Fluid Dynamics (CFD) has been underway for a number of years and is capable of simulating aircraft cabin fires(Reference Galea and Markatos5,Reference Galea and Markatos6) . Due to the lack of sophistication of early fire models and limitations of computer capability, early modelling applications(Reference Galea and Markatos6-Reference Galea, Markatos and Wakamatsu10) usually treated the fire as a volumetric source of heat or fuel and simulations were generally intended to represent non-spreading fires. In a recent application of fire field modelling to aircraft fire, Jia et al(Reference Jia, Patel, Galea, Grandison and Ewer11,Reference Jia, Patel, Galea, Grandison and Ewer12) used the SMARTFIRE CFD fire simulation tool to assist the Transportation Safety Board (TSB) of Canada, Fire and Explosion Group, in their investigation of the Swissair MD-11 in-flight fire, which resulted in the loss of the aircraft and all passengers and crew. The fire spread model developed by Jia et al was capable of modelling flame spread over combustible interior solid surfaces of the aircraft. This fire spread model has been further validated by simulating one of the Federal Aviation Administration (FAA) post-crash cabin fire experiments(Reference Wang, Jia and Galea13), a full-scale mock-up of Station Nightclub fire(Reference Galea, Wang, Veeraswamy, Jia, Lawrence and Ewer14) and a rail car fire test(Reference Hu, Wang, Jia and Galea15). This model has also been used to investigate post-crash cabin fires of a blended wing-body aircraft with around 1,000 passengers and crew(Reference Galea, Fillippidis, Wang and ewer16).
Aircraft evacuation is typically evaluated through full-scale evacuation trials conducted using real people and actual aircraft. The aircraft evacuation certification protocol(17) is designed around the threat of a post-crash fire and the resulting onset of non-survivable conditions which may develop within the passenger cabin. The certification trial assumes 50% exit availability, with one exit from each pair being used. The trial imposes the performance requirement that the last person must safely evacuate from the aircraft within 90 seconds. In order to limit the likelihood of injury to the test subjects, the nature of the evacuation scenarios investigated is limited. Furthermore, due to high costs associated with undertaking such trials, the number of evacuation trials that are undertaken is also limited. Computer simulation of aircraft evacuation offers a means of circumventing the identified limitations associated with full scale evacuation trials and has been underway since the early 1990s(Reference Galea and Galparsoro18,Reference Galea and Galparsoro19) . An early review of aircraft evacuation models(Reference Court20) identified four models that could potentially be used for evacuation certification, of which airEXODUS(Reference Galea, Fillippidis, Wang and ewer16,Reference Galea and Galparsoro18,Reference Galea and Galparsoro19,Reference BLAKE, Galea, Gwynne, Lawrence and Fillippidis21-Reference Galea, Blake and Lawrence23) is the only model still in common use and development. More recently, other agent-based aircraft evacuation models similar to airEXODUS have been developed(Reference Kirchner, Klüpfel, Nishinari, Schadschneider and Schreckenberg24-Reference Liu, Wang, Huang, Li and Yang30). However, of these, airEXODUS is the most validated aircraft evacuation model (see, e.g., Ref. 23, where the software was validated using data from 90-second certification trials for four wide-body and two narrow-body aircraft) currently available. Furthermore, it is the only aircraft evacuation model that can be easily coupled with CFD fire simulation software to investigate the impact a developing fire can have on passenger survivability and evacuation(Reference Wang, Jia and Galea31).
In this study, the Manchester airport B737 fire is investigated using coupled fire and evacuation computer simulation. In an earlier numerical study of this incident, the external pool fire was simply represented by a rectangle fuel pan adjacent to the burn-through area of the fuselage at the cabin floor level(Reference Wang, Jia and Galea31). This greatly simplified the fire simulation analysis but did not adequately represent the fire plume or the impact of wind on the fire plume. In the current study, the external fire under the left aircraft engine is represented using a pool fire model recently developed as part of the EU FP7 AircraftFire project(32,Reference Galea, Jia, Wang and Ewer33) . The results of the fire simulation are then coupled to an evacuation simulation to address the following questions:
-
• How did the delay in opening the malfunctioning Exit R1 impact passenger survivability?
-
• How did the delay in opening Exit ROW impact passenger survivability?
-
• Did the opening of the unused Exit R2 contribute to the high fatality rate?
-
• What is the critical wind speed beyond which the fuselage would be at high risk of burn-through from the external fuel pool fire?
-
• What would be the expected impact on passenger survivability if modern fire-resistant fuselage insulation materials were used?
-
• What would be the expected impact on passenger survivability if modern fire-resistant cabin interior materials were used?
2.0 COMPUTATIONAL FIRE AND EVACUATION SIMULATION TOOLS
A research version of the SMARTFIRE V4.1 software is used to perform the fire simulations in this study. The SMARTFIRE software has been described in previous publications(Reference Jia, Patel, Galea, Grandison and Ewer11-Reference Galea, Fillippidis, Wang and ewer16,Reference Wang, Jia and Galea31,Reference Ewer, Jia, Grandison, Galea and Patel34) and so is not described in detail in this paper. The CFD engine in SMARTFIRE has many physics features that are required for fire field modelling, such as the multiple ray radiation model, the volumetric heat release model, the gaseous combustion model, smoke model, toxicity model, flame spread model, pool fire model and k-epsilon turbulence model. The flame propagation model(Reference Jia, Patel, Galea, Grandison and Ewer12), which is used to simulate the ignition of interior solid materials in the current analysis, plays an important role in successfully simulating the spread of fire inside the cabin. This model has been recently refined to minimise the mesh dependence of numerical predictions of flame spread over solid burnable surfaces(Reference Hu, Wang, Jia and Galea15). A newly developed pool fire model within SMARTFIRE is used to generate gaseous fuel from pool of liquid kerosene based on vapour equilibrium at the liquid fuel surface and energy balance at the surface(32,Reference Galea, Jia, Wang and Ewer33) . In the fire analysis presented here, the following hazards are predicted: temperature, smoke concentration (extinction coefficient), radiative flux, CO concentration, CO2 concentration and O2 concentration. Note that the generation of irritant fire gases is not included in these simulations.
Because of its extensive validation history and ability to couple with CFD fire simulation, the airEXODUS(Reference Galea, Fillippidis, Wang and ewer16,Reference Galea and Galparsoro18,Reference Galea and Galparsoro19,Reference BLAKE, Galea, Gwynne, Lawrence and Fillippidis21-Reference Galea, Blake and Lawrence23) evacuation model is used to perform the evacuation simulations presented in this paper. airEXODUS is designed for applications in the aviation industry, including aircraft design, compliance with 90-second certification requirements, crew training, development of crew procedures, resolution of operational issues and accident investigation. The software has been used many times in design applications for aircraft manufacturers (e.g. Airbus, Bombardier and Mitsubishi) to de-risk new design concepts (e.g. A380, CSeries, MRJ), to demonstrate compliance with evacuation requirements for VIP configured aircraft (Jet Aviation), to determine the impact of novel cabin layouts (Zodiac Aerospace) and to explore the feasibility of novel aircraft configurations such as Blended Wing Body Aircraft(Reference Galea, Fillippidis, Wang and ewer16).
The EXODUS software takes into consideration people-people, people-fire and people-structure interactions. It comprises five core interacting sub-models: the PASSENGER, MOVEMENT, BEHAVIOUR, TOXICITY and HAZARD sub-models. The PASSENGER sub-model describes an individual as a collection of defining attributes and variables such as name, gender, age, maximum unhindered fast walking speed, maximum unhindered walking speed, response time, agility, etc. The HAZARD sub-model controls the atmospheric and physical environment by importing the predicted fire hazard data, like those generated by the SMARTFIRE CFD fire model. The TOXICITY sub-model determines the physiological effects on an individual exposed to the toxic and thermal environment distributed by the HAZARD sub-model. This is determined using the Fractional Effective Dose (FED) and Fractional Irritant Concentration (FIC) concept(Reference Purser and Dilenno35). Within airEXODUS, two models are provided for the determination of the fractional effective dose of radiative heat: the so-called Pain Threshold model (in which the dose required to cause effect (Dr ) is 80s(kW/m2)4/3, which is the equivalent to an exposure of 2.5kW/m2 for 24 seconds), and the Incapacitation model (in which Dr = 1,000s(kW/m2)4/3, the equivalent to an exposure to 2.6kW/m2 for 5 minutes, which can result in a 1% mortality)(Reference Galea, Wang, Veeraswamy, Jia, Lawrence and Ewer14). The Incapacitation model is used in the calculations in this study. When a passenger moves through a smoke-filled environment, their travel speed is reduced according to the experimental data of Jin(Reference Jin and Yamada36), which relates light extinction coefficient to walking speed. All these effects are communicated to the BEHAVIOUR sub-model, which, in turn, feeds through to the movement of the individual. The behaviours in airEXODUS include crawling, climbing over seats, maintaining target exits, wayfinding, aisle swapping, crew redirection, etc. In the coupled fire and evacuation analysis presented here, the following fire related parameters are considered:
-
• Light extinction coefficient – related to walking speed using the Jin data(Reference Jin and Yamada36) and whether the agent is walking or crawling.
-
• FIH – fractional incapacitating dose of heat, both radiative and convective (based on the Purser model(Reference Purser and Dilenno35)).
-
• FIN – fractional incapacitating dose of narcotic agents, which in this simulation include CO, CO2 and O2 (based on the Purser model(Reference Purser and Dilenno35)).
An agent is considered incapacitated when the FED (either FIN or FIH) is equal to 1. An agent is considered injured if their FED (either or both FIH or FIN) is greater than 0.1.
A technique coupling the fire and evacuation simulation is used in this study. This technique was developed by the authors and has been successfully used in a forensic analysis of the Rhode Island Station Nightclub fire, which resulted in 100 fatalities(Reference Galea, Wang, Veeraswamy, Jia, Lawrence and Ewer14). It has also been used as part of a design evaluation of a Blended Wing Body aircraft concept involving 1,000 passengers and crew(Reference Galea, Fillippidis, Wang and ewer16).
3.0 RECONSTRUCTION OF THE FIRE AND EVACUATION
3.1 The accident
The B737-236 involved in the Manchester disaster is shown in Fig. 1. In the accident, the prevailing wind caused the fire plume from the left engine and pool fire to lean against the aircraft fuselage, resulting in fuselage burn-through via the vent grills, window seals and cabin walls generating a severe interior cabin fire. As seen in Fig. 1, the final burn-through damage to the cabin wall is estimated to be approximately 2m wide. The time for the rear fuselage and tail to collapse was not established but is some time after the last passenger had evacuated. Therefore, this collapse is not considered relevant to passenger evacuation and survivability in the present reconstruction.
Damage to the B737-236 fuselage in the Manchester accident(Reference King1).

In total, the aircraft had three pairs of exits. From front to rear, they were Type I (a floor-level exit sufficiently wide to allow one person to pass through at a time) crew operated exits, Type III (small hatch type exit in which the passenger must climb up into the exit and down to the wing) passenger operated over wing exits and at the rear, Type I crew-operated exits. Of these, only the forward left (Exit L1), forward right (Exit R1) and right over-wing (Exit ROW) exits were utilised during the evacuation – half the number of available exits. During the evacuation, the passengers and cabin crew experienced difficulty in opening most of the exits. Indeed, Exit ROW was opened by passengers approximately 45 seconds after the aircraft had stopped. The front crewmember first attempted to open Exit R1. The exit malfunctioned and the crewmember turned to open Exit L1 and then returned to eventually open Exit R1. As a result, Exit L1 was opened after approximately 25 seconds, and Exit R1 was eventually opened after 70 seconds. From analysis of full-scale certification trials, the front exits should be opened within 8.2 seconds, and the over-wing exit should be opened within 12 seconds(Reference Owen, Galea and Dixon37). Although the aft right exit (R2) was opened before the aircraft completely stopped, it was not used by passengers due to the presence of heavy smoke in the vicinity of the exit.
3.2 Reconstruction methodology
The reconstruction of the accident involves a two-step process: first the fire is simulated and then the coupled fire and evacuation is simulated. The results from the fire simulation are part of the inputs to the evacuation simulation to predict the impact of the fire on the evacuating passengers. The passengers are exposed to the fire hazards determined from the fire simulations, which include temperature, radiative flux, concentrations of toxic gases, low oxygen and smoke obscuration. In these simulations, some identified contributing factors, F1-F7 as stated below, taken from the accident investigation report(Reference King1) are used as input parameters.
-
F1: An external wind of 5-7Kn (2.57-3.60m/s) with an angle of 250° to the north;
-
F2: The external pool fire location and area;
-
F3: The size and location of the cabin burn-through;
-
F4: Fire penetration via floor air-conditioning grills occurred within 20 seconds.
-
F5: Availability of exits for evacuation and opening time for each exit;
-
F6: Seating locations of the passengers.
-
F7: The exit used by each survivor.
However, there are still many uncertain details that have an impact on the fire development and the evacuation dynamics. The key parameters that are required as part of the simulation set-up but cannot be determined from the investigation report include:
-
U1: The rate of smoke entry via the air-conditioning grills before the burn-through of the side cabin wall;
-
U2: An accurate estimation of the start time and duration of the cabin wall burn-through;
-
U3: An accurate estimation of the start time of window burn-through;
-
U4: An accurate estimation of the time of the engine fire being controlled by the fire fighters, after which the external pool fire plume from the left engine was not impinging on the fuselage;
-
U5: An accurate estimation of the fire under the fuselage entering the cabin after the fire under the left engine was brought under control;
-
U6: The burn-through time for the cabin ceiling;
-
U7: Human factors such as passenger response times, exits fatalities intended to use, etc.
Although the smoke entry via the air-conditioning grills (U1) is not considered to be a major contribution to the death toll, it possibly impacts the evacuation behaviour of the passengers, i.e. whether they are considered to be walking or crawling. The parameters U2-U6 relate to the damage of the cabin, the injuries to passengers and the number of fatalities. U7 will impact the overall evacuation time and possibly the number of injuries and fatalities.
To reconstruct the incident, estimations for the unknown quantities (U1-U7) have to be determined. This is achieved by modifying these parameters and comparing the outcomes of the fire and evacuation analysis with the key known outcomes O1-O11, extracted from the investigation report(Reference King1) as follows:
-
O1: The external fire plume covered the cabin wall burn-through location but not Exit R2;
-
O2: Cabin wall burn-through commenced within 1 minute;
-
O3: Smoke began to enter the galley area after Exit R1 was opened at 70 seconds;
-
O4: The locations of the thermally damaged seats;
-
O5: 23 of the 51 passengers exiting via Exit R1 and Exit L1 were not exposed to thick smoke;
-
O6: The usage of exits by the survivors;
-
O7: 46% of the survivors who escaped via Exit ROW climbed over seats;
-
O8: There were a total of 55 fatalities;
-
O9: The seating locations of the fatalities;
-
O10: 86% of fatalities died from inhalation of toxic gases, while 6% died from thermal assault;
-
O11: 15 survivors were severely injured by heat/toxic gases;
Outcomes O10 and O11 are not used in the reconstruction process, but the evacuation outcomes of the finalised reconstruction scenario are compared with them as a way to examine the prediction accuracy of the reconstruction. The methodology used to derive appropriate values for parameters U1-U7 is presented in the flowchart in Fig. 2.
Flowchart for the accident reconstruction.

3.3 Fire simulation set-up
The whole computational domain involves a ground area of 33×30 m2 and a height of 30m, with a total computational mesh of 642,682 cells within the SMARTFIRE simulations. As the computational domain outside the cabin is very large, a relatively coarse mesh is used in this region especially away from the burn-through area (Fig. 3). The B737-236 aircraft cabin is represented using a fine computational mesh, as seen in the monuments and seats, consisting of 119,770 computational cells. The mesh density for this B737 cabin is the same as or higher than that used in the earlier aircraft fire simulations(Reference Wang, Jia and Galea13,Reference Wang, Jia and Galea31) , which has been shown to be appropriate to produce converged numerical solutions and reproduce the experimental results with a high level of precision. The burn-through opening of the cabin wall close to seat rows 17-19 is set to be 2m long and 0.9m high, which is modelled by the removal of the cabin wall patch by patch from the level of the cabin floor. A ceiling burn-through between seat rows 15 and 19 on the top of the fuselage is also represented in the model. Along the two cabin sides, two 0.1-m-wide floor sheets represent the air conditioning grills for smoke to enter before the side cabin wall is burn-through.
Aircraft configuration used in the fire simulations.

The external pool fire has an estimated area of 16m2 and its shape shown in Fig. 3 as the dark area under the left engine is close to the main pool area suggested in the accident report(Reference King1). The pool fire fuel is represented by kerosene with properties shown in Table 1. The properties of the cabin interior materials are identical to those used in the simulation of the C133 fire test(Reference Wang, Jia and Galea13) and in the earlier investigation of the B737 fire(Reference Wang, Jia and Galea31).
Properties of kerosene(Reference Wang and Wang38)

The exit opening times for the R1, L1, ROW and R2 exits are the same as those in the accident, i.e. 70 seconds, 25 seconds, 45 seconds and 0 seconds, respectively. As Exit R1 was not completely open until 70 seconds, only one third of this door is opened between 10 seconds and 70 seconds during the fire simulations. The external wind speed is set to be 2.82 m/s, within the reported range of 2.57-3.60m/s during the incident(Reference King1). The impact of wind speed on the fire development and evacuation will be analysed later.
In order to represent the predicted fire hazards within the cabin, a set of 34 hazard zones are defined in the cabin in both the fire and evacuation model. As shown in Fig. 4, Zone 1 is located adjacent to Exit L1, Zone 14 is located in the aisle near to the over-wing exits, and Zone 22 is located adjacent to the burn-through location. Within each zone, fire hazard values (i.e. temperature, smoke concentration (extinction coefficient), radiative flux, and concentrations of CO, CO2 and O2) predicted in the fire simulations in a layer from 1.5 m to 2.0 m are averaged and taken to represent the hazards at head height, while hazard values from 0.3 m to 0.8 m are averaged and taken to represent the hazards at knee height (for crawling agents). The averages of predicted temperatures, species concentrations (CO, CO2 and O2), radiation fluxes and optical density at the head and knee heights in each zone are output into a data file. This data file is then imported by airEXODUS to produce the atmospheric conditions for evacuation simulations. The time-step size within the fire simulation is 1 second.
Fire hazard zones prescribed within both the fire and evacuation models identified by dashed lines (several key zones are indicated by their zone number).

3.4 Evacuation simulation set-up
The aircraft geometry and the exit opening times used in this analysis are the same as those for the fire simulation. In this study, the fire hazards (as determined by the SMARTFIRE CFD fire simulation) that can affect agent behaviour and survivability are radiative and convective heat (through the FIH parameter), the concentrations of the narcotic gases CO, CO2 and O2 (through the FIN parameter), and smoke concentration (through the light extinction coefficient). The impact of irritant fire gases is not considered in this analysis, as they were not determined in the fire simulation. The evacuation parameters used in the analysis are the default airEXODUS parameter set except those specified here.
Passengers identified as accident survivors have their personal attributes (i.e. age and gender) set using the airEXODUS default certification parameter set, as these details were not provided in the accident report. Passengers identified as accident fatalities are set with their actual ages and genders as reported in the accident report. Among the 131 passengers, one child and two infants, who evacuated in adults’ arms, are not specially taken into account in the reconstruction. Considering the severity of the incident, agents are allowed to undertake extreme behaviours within the model, such as climbing over passenger seats and crawling, behaviours not normally used in certification applications. Agents have the option to climb over seat backs only if their agility attribute is sufficiently large. Initially, the default agility levels for all but the most elderly agents are sufficient to allow them to climb over seats. However, the agility of an agent reduces in response to their exposure to the narcotic and irritant gases. The behaviour sub-model within airEXODUS allows agents to climb over a seat back if they have sufficient agility and if their normal path is blocked or congested. Furthermore, they will only decide to climb over seats once their local patience attribute (default values between 2 and 10 seconds) has expired due to enforced waiting resulting from congestion or if their path is blocked. Passengers are forced to crawl in a prescribed hazard zone when the head-height light extinction coefficient in this zone reaches 0.5/m. All other agent attributes such as walking speeds assume the default airEXODUS values.
In order to generate a similar seating distribution of fatalities and exit usage to those that occurred in the real incident, the following model set-up is imposed on the simulation:
-
• Relatively short response times and low patience values are set for the agents who survived and were located in the aft of the cabin. This enables these agents to start to move early and climb over seats to get to the exits if the aisle is blocked by other passengers. The precise values used for these parameters are determined from the iterative reconstruction analysis (U7 parameter).
-
• Agents representing other survivors are assigned default response times (between 1 and 6 seconds).
-
• Agents representing fatalities are assigned long response times (greater than the default values). The precise values used for these parameters are determined from the iterative reconstruction analysis (U7 parameter).
-
• Each accident survivor will maintain their assigned target exit. This is the exit that was used by the survivor in the actual accident. Thus, the agents are forced to use the exits that they used during the actual accident.
-
• As it is unknown which exit accident fatalities attempted to use, it is assumed that they select their nearest available exit, i.e., the overriding ambition of these passengers is to exit via their nearest exit, rather than to travel further. This assumption is based on data derived from analysis of past accidents(Reference Galea, Togher and Lawrence39-Reference Galea, Finney, Dixon, Siddiqui and Cooney41).
Concerning the impact of behaviours exhibited by socially connected groups (e.g. family groups, close friends) on evacuation performance, such as responding at the same time or moving towards the same exit(Reference Galea, Finney, Dixon, Siddiqui and Cooney41), while linked behaviours such as these can be included in the airEXODUS simulation, this was not explicitly considered but were implicitly represented. This was achieved using several approaches, first the known exit usage of the survivors was imposed on the simulation, thus inevitably, connected social groups who are more likely to use the same exits will use those exits. Furthermore, the iterative process used to undertake the reconstruction analysis resulted in tuning some of the parameters such as passenger response times – delaying or speeding up the start of individual evacuations as may have occurred if socially connected groups were involved.
The evacuation simulations are run until no survivors remain inside the cabin. As the airEXODUS simulation is stochastic in nature, if the simulation is repeated without any changes to the initial or boundary conditions, the results will not be exactly the same. Thus, the evacuation results presented in this paper represent the average values derived from 200 evacuation simulation repetitions.
4.0 RESULTS FROM THE ACCIDENT RECONSTRUCTION
The reconstruction of the fire development and evacuation process for the Manchester aircraft fire accident is considered to be completed when appropriate values for the unknown parameters (U1-U7) are identified. The parameter set with which the simulation produces a reasonable agreement with the known outcomes has the following values. The entry rate of smoke via the air-conditioning grills (U1) is set to be 0.0012kg/s. Smoke starts entering the cabin through different portions of the ventilation grills, from 20 seconds at the aft cabin to 60 seconds at the forward cabin end. Using these times, smoke can move to the front monument area when Exit R1 is open as observed in the accident. The burn-through times (U2) in the reconstruction, represented by the removal of the side wall, patch by patch, with a length of 2m and a height of 0.1m for each patch, are: the first patch (at the floor level) is removed at 75 seconds, second patch (0.1 m above the floor) is removed at 100 seconds, and the last patch (0.9 m above the floor) is removed at 155 seconds (see Fig. 5). The window burn-through time (U3) is at 95 seconds, just 20 seconds after the bottom piece of the burn-through area is removed.
Wall burn-through process in the reconstruction.

According to the official investigation report(Reference King1), the estimated fuel leakage rate from the fuel tank was between 0.062m3/s and 0.0078m3/s in 40 seconds and remained at this level for a few minutes. A fuel rate of 0.0078 m3/s is approximately equivalent to a Heat Release Rate (HRR) of 260MW if the fuel is kerosene. The external HRR from the pool fire in the reconstruction are shown in Fig. 6, which quickly increases to 35MW at 25 seconds and then gradually to 40MW after 80 seconds. Therefore, the burning rate of the pool fire in this accident would be approximately one seventh of its potential value based on the fuel leakage rate from the fuel tank. The relative low fuel burning rate compared with the potential maximum value is the result of firefighting during the incident.
External pool fire HRRs in the reconstruction.

The time for the firefighters to control the fire under the left engine (U4) is estimated at 95 seconds. After 95 seconds, the fire entry into the cabin is mainly from the pool burning underneath the fuselage. The rate of heat entering the cabin through the burn-through area underneath the fuselage (U5) is as high as 3MW at 85 seconds but lasts only around 50 seconds (Fig. 7). The interior cabin fire starts after 75 seconds but quickly increases to 7MW at 120 seconds due to the entry of the external fire. The time to the burn-through of the ceiling (U6) is approximately from 145 seconds to 175 seconds within the reconstruction.
HRRs of the external fire underneath the fuselage and interior cabin materials in the accident reconstruction.

The response times and patience (U7) for those passengers that survived in the aft of the cabin are as small as 0 seconds and 1 second, respectively – indicating that they react quite quickly and take decisive action when confronted with severe congestion. The response times for some fatalities in the accident can be as long as 30 seconds in this reconstruction. The other surviving passengers have default response times (between 1 and 6 seconds) and default patience values (between 2 and 10 seconds).
The comparison between the known outcomes from the accident and those from the reconstruction simulation are summarised in Table 2. Basically, all the 11 accident outcomes are predicted by the reconstruction simulation. The wind was the principal factor controlling the fire's behaviour. It carried the external pool fuel fire against and beneath the rear fuselage. Figure 8(a) demonstrates the impact of the wind on the smoke movement from the pool fire(Reference King1). It is reported that the opened Exit R2 allowed an early entry of smoke and possibly some flame but was not the principal point of entry of the fire into the cabin. As shown in Fig. 8(b), the external flow pattern in the reconstruction follows that described in the accident investigation report and the fire plume leans against the burn-through area and goes under the fuselage; Exit R2 is outside the fire plume but engulfed by heavy smoke (Fig. 8(c)).
Comparison of the outcomes between the accident and reconstruction

(a) Static fire plumes in the accident(Reference King1); (b) external fire plume and wind flow and (c) smoke iso-surface (with light extinction coefficient of 0.5/m) from the reconstruction simulation.

It is estimated that within 1 minute of the aircraft stopping, the fire penetrated the cabin side walls just above floor level adjacent to seats, giving the fire direct access to the cabin interior(Reference King1). The first patch of the side wall at the burn-through area is removed at 75 seconds, approximately 15 seconds later than the estimation from the report (Fig. 9). The burn-through process lasts 80 seconds, to a height of 0.9m above the cabin floor. In the accident, the fire was entrained beneath the rear fuselage by the wind, creating a large area of fire- contact with the fuselage at a high rate of heat transfer into the cabin. This mode of heat transfer is simply represented by an unknown parameter (U5) in the reconstruction.
Start of burn-through at the cabin floor level at 75 seconds in the reconstruction.

As shown in Fig. 8(c), the smoke inside the cabin reaches the galley area along two sides of the cabin walls at 70 seconds, while heavy smoke under the ceiling and overhead bins are seen in the aft cabin. This closely matches O3.
The damaged seats found in the aftermath of the accident are shown in Fig. 10(a). In this figure, both the burnt seats and the degree of damage are presented. The severely burnt seats were mainly located in the rear part of the cabin, in the vicinity of the left aircraft wing and on the right side of the forward cabin. The distribution of the ignited seats in the reconstruction is in reasonably good agreement with the findings in the accident (Fig. 10(b)). Within Fig. 10(b), each dot represents a cell within the computational mesh describing the seat that is predicted to have been consumed by the fire (i.e. burnt out).
(a) Seat damage in the accident (top: below squab level; bottom: squab level and above); (b) ignited seat locations at 180 seconds in the reconstruction.

Among the 51 passengers who exited via the front exits, 23 of them escaped before thick smoke had reached them. In the reconstruction, an average of 18.7 agents escaped from the front exit before the start of burn-through (less smoke inside the cabin) and 37.7 agents without crawling (crawling occurs when the upper layer smoke optical density reaches 0.5/m). Thus, in the reconstruction, the number of agents that escape from the front exits before the heavy smoke has reached them is between 18.7 and 37.7. In the accident, there were 35, 27 and 18 survivors exiting via Exit R1, ROW and L1, respectively. The numbers of survivors using these exits are 32.1, 27.5 and 17.0, respectively, within the reconstruction. Furthermore, 46% of the 27 survivors through Exit ROW were reported to have climbed over seats during their evacuation while in the reconstruction, 48% of the predicted survivors who exit via Exit ROW climb over seats.
There were 54 fatalities on board the aircraft in the actual accident, with one passenger dying later in hospital. Within the reconstruction, an average of 55.5 fatalities is predicted. The predicted fatality seating locations are comparable with those in the accident (see Fig. 11). Of the 54 fatalities on board, 48 (89%) died from toxic fire gases, while 6% died solely from thermal assault. The actual causes of the deaths were determined by medical examination. All of the predicted fatalities are initially incapacitated due to heat exposure, the first cause of an agent losing the ability to move. In the incident, approximately 7 minutes after the aircraft stopped, it became clear that no more passengers were likely to evacuate un-aided. In the evacuation simulations, within 7 minutes from the start of the fire, 41 of the 55.5 predicted fatalities have FIN values of 1.0, indicating the likely final causes of these fatalities are inhalation of toxic fire gases. For example, the first fatality lost the ability to move (incapacitation) at approximately 90.2 seconds due to heat exposure, and the FIN value for this person reaches 1.0 at 117 seconds.
(a) Usage of the exits by survivors and seat locations of the fatalities in the accident(Reference King1) and (b) predicted fatality locations (white seats) resulting from a single simulation.
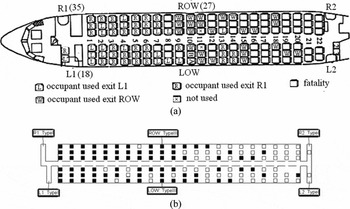
A total of 15 survivors were severely injured due to heat or toxic smoke inhalation in the actual incident. Within the reconstruction, 10.9 agents have FIH, or a FIN value greater than 0.1, suggesting that they were likely to have incurred severe injuries.
The predicted fire hazards in the cabin vary with time and location. Since the main purpose of this study is to demonstrate the reconstruction methodology and examine the impact of time to open the exits, the strength of the external wind, the improvement of cabin materials on the fire development and evacuating passengers, and the fire hazards in the cabin in the reconstruction will be not analysed in detail. Figure 12(a) presents the head-height and knee-height temperatures in the aisle as a function of distance from the front edge of the forward exits. The temperature curves are at 90 seconds (the aviation certification trial requirement), at 105 seconds (last passenger to evacuate via the ROW exit) and at 130 seconds (just before the completion of evacuation) from when the aircraft stopped. At 90 seconds (15 seconds after the start of cabin wall burn-through), the temperatures in the aisle near the forward cabin end are very low (below 30°C). Passengers in this region escape the cabin simply by walking out (Fig. 12(b)). From the forward cabin, the head-height temperatures gradually increase to 340°C at the middle cabin (near the over-wing exits at around 9m) and further to over 1,000°C at the rear of the cabin. Due to the presence of heavy toxic smoke and high temperatures in the upper layer, passengers in the aisle in the middle of the cabin are forced to crawl. The knee-height temperatures in the region closer to the burn-through area are around 170°C. With these high temperatures and radiation fluxes (34 kW/m2), some of the agents in this region are incapacitated at around 90 seconds (Fig. 12(b)). At 105 seconds, the head-height temperatures in the aisle are above 330°C except at the front end. At this time, there are no survivors remaining in the aft cabin. The head-height temperatures further increase to above 530°C at 130 seconds. The knee-height temperatures in the forward cabin aisle are already around 60-100°C. In the reconstruction, all passengers remaining in the cabin after 131.7 seconds are incapacitated.
(a) Predicted head-height and knee-height temperatures in the aisle; (b) evacuating passengers at 90 seconds in one single evacuation simulation (from light to dark colour, the temperature changes from 20°C to 150°C above).

The sensitivity of the predicted simulation outcomes to the various unknown parameters is summarised here. First, among the 11 outcomes (O1-O11) extracted from the fire investigation report, the number of fatalities (O8) and the thermally damaged seats (O4) are most important in deriving the time for the pool fire being brought under control, the wall burn-through period and the amount of heat entering the cabin from the impinging fire underneath the fuselage. Second, the determination of U4 is critical to the correct reconstruction of the incident. The fire simulation results indicate that the flow pattern within the cabin caused by fresh air entering the cabin via the burn-through area is probably the root cause of the observed distribution of the burnt seats (see Fig. 10(a)), in particular there were fewer thermally damaged seats on the left side in the forward cabin compared to the right side. If the external fire covers the whole burn-through area during the entire simulation period, the numerical predictions suggests that the fire front moves forward quite evenly across the cabin from one side to the other. As a result, the ignited seats on both sides of the aisle propagate forward evenly, which clearly contradicts the distribution of the damaged seats as shown in Fig. 10(a). This implies that the airflow pattern inside the cabin within the simulation is incorrect. The fire simulation results show that only with the entry of fresh air from the burn-through area could the cabin flow pattern produce the observed damaged seat distribution. This flow pattern was created after the fire under the left engine was brought under control by the fire fighters (U4), which allowed fresh air to enter the cabin via the burn-through area. Third, the determination of U5 is essential to correctly predict the number of fatalities. As suggested in the investigation report, the fire entering the cabin was mainly from the fire under the fuselage after the fire under the left engine was brought under control. Simulation results show that without the inclusion of this factor of fire development, the number of fatalities (O8) would be greatly under-predicted. Fourth, the setting of the passenger patience and response time parameters are responsible for producing the reasonable agreement between the predicted and observed fatality seating locations.
The results from the reconstruction and sensitivity analysis have demonstrated that with appropriate values for the unknown fire and evacuation model parameters, the coupled fire and evacuation analysis is capable of reproducing the complex fire dynamics and resulting evacuation dynamics involved in the Manchester B737 post-crash fire involving an external pool fire with wind, burn-through of the fuselage, and spread of the fire in the cabin and the impact of fire hazards on evacuating passengers.
5.0 IMPACT OF EXIT OPENING TIMES AND EXTERNAL WIND
5.1 Exit opening times
In this section, the impact of the delay in opening exits on the cabin ventilation and hence the spread of heat, smoke and toxic products throughout the cabin and the subsequent fatalities are investigated. The accident reconstruction identified a set of parameters (U1-U7) with which the fire and evacuation simulations provided a reasonable agreement with the main accident outcomes. Using the values for these parameters, the impact of the exit opening times on the evacuation is now examined.
Four scenarios varying only in the exit opening times are compared with the reconstruction scenario. The exit opening times in the accident all have significant delays compared with the requirement of aviation certification trials. The scenario investigated in the accident reconstruction has Exit R1 opening 70 seconds after the aircraft has completely stopped due to an exit malfunction. This time is much longer than the normal exit opening time of 8.2 seconds derived from industry standard certification trials(Reference Owen, Galea and Dixon37). The impact of this delay on the evacuation and subsequent number of fatalities is examined. Therefore, Scenario 1 has the same set-up as the reconstruction but Exit R1 is opened at 8.2 seconds. The over-wing Type-III exit ROW was opened by passengers at approximately 45 seconds in the accident. The standard opening time for this type of exit is 12 seconds. Scenario 2 is the same as the reconstruction scenario but with an opening time of 12 seconds for Exit ROW. Scenario 3 assumes that all the three exits used for evacuation (i.e. Exit L1, Exit R1 and Exit ROW) are opened at 8.2 seconds, 8.2 seconds and 12 seconds, respectively. The fourth scenario considers what would have happened if the unused Exit R2 was not opened during the incident.
Due to the changes of opening times of some exits, passengers’ behaviour in exit selection during evacuation may be different from that in the reconstruction. As exits become available sooner, passengers have a greater choice of available exits and so may elect to use a different exit to the one that is assigned to them based on the exit that was used in the actual accident. Therefore, the following two assumptions are postulated to guide agent exit selection for the exit opening time analysis:
-
Assumption 1: Agents are assigned target exits as in the reconstruction. However, they are allowed to change their assigned target exits to the nearest available exit, excluding Exit L1, if they become impatient while waiting in the exit queue to their original target exit. This assumption only applies to agents representing the passengers that survived in the actual accident.
-
Assumption 2: All other agents attempt to utilise their nearest exit, excluding Exit L1, and are allowed to change their preferred exit if they become impatient while waiting in the exit queue, again excluding Exit L1.
Thus, with these assumptions, no additional agents will utilise Exit L1, and all additional surviving agents will elect to use either Exit R1 or Exit ROW.
Among the exits, Exit ROW is the nearest to the burn-through location available for evacuation. It is interesting to compare the fire hazards at locations near this exit between the various scenarios. Figure 13 compares the predicted knee-height temperatures in the aisle near the over wing exits. From Fig. 13, the earlier exit opening times contribute negligible temperature difference in this region as the burn-through occurs later than the times to open the exits. Therefore, the exit opening times do not significantly impact the cabin fire development or the survivability within the cabin.
Predicted temperatures at knee height in the aisle near the over-wing exits with different exit opening times.

However, exit opening times are critical for a successful evacuation. Evacuation simulation results from the four scenarios are presented in Table 3. In Scenario 1, even without the malfunction of Exit R1, loss of life could not be completely avoided. However, the fatalities could be significantly reduced from 55.5 in the reconstruction to just 7.0, a reduction of 87%. Furthermore, in this scenario, there is still an average of 6.8 severe injuries. This indicates how essential it is that cabin crew are able to open all the exits as quickly as possible. As demonstrated in this simulation, a delay of about 1 minute in opening an exit can result in a large fatality rate if fire has gained access to the cabin. This result also demonstrates why it is essential to have a cabin crew member available at each floor-level exit that is able to open the exit within seconds. If there is only a single crew member responsible for opening both exits in an exit pair, or should a crew member be injured as a result of the accident and unable to open their exit, this can delay the opening of both exits potentially contributing to loss of life.
Evacuation results for the accident reconstruction and earlier exit opening simulations

Without the delay in opening Exit ROW in Scenario 2, the fatalities could be reduced from 55.5 in the reconstruction to 35.6 a reduction of 36%. This result suggests that it is essential that passengers seated beside over-wing Type III exits are capable of operating the exit in the event of an emergency. As demonstrated in this simulation, a delay of just 30 seconds in opening the over-wing exit resulted in some 20 fatalities. It is thus essential that passengers seated beside manually operated over-wing exits are able to quickly open these exits. In Scenarios 1 and 2, the evacuation times are all around 130 seconds, as in the reconstruction scenario. The earlier opening of the exits does not significantly change the total evacuation time as one may expect due to the additional passengers that survive and hence need to exit the aircraft. Scenario 3 has all the three available exits open within the certification trial times. In this scenario, all the passengers can safely evacuate the cabin without incurring any fatalities or serious injury. The evacuation is completed within 84.4 seconds, close to the time at which the first fatality occurs within the reconstruction (81.8 seconds), Scenario 1 (87.0 seconds) and Scenario 2 (85.1 seconds), respectively.
With additional Assumptions 1 and 2, it is postulated that the earlier opening of exits does not change passengers’ reluctance to evacuate via Exit L1. These assumptions are supported by the actual usages of the exits by passengers in the accident. In the accident, although Exit L1 opened 45 seconds sooner than Exit R1, only 18 passengers evacuate via this exit, just half of those that use Exit R1. This is due to the fact that Exit L1 was on the side of the external pool fire, so passengers were reluctant to use this exit. The influence of this assumption on the evacuation outcomes are examined through two additional scenarios, Scenario 1a and Scenario 3a, in which Assumptions 1 and 2 are relaxed allowing all agents to include exit L1 in their exit selection. Furthermore, the exit opening times in these additional scenarios are the same as those in Scenarios 1 and 3. The purpose of these simulations is to demonstrate how the evacuation may have been improved if more passengers were prepared to utilise Exit L1. The evacuation results with and without the modified assumptions are compared in Table 4.
Evacuation comparison between passengers exit selection with and without modified exit selection assumptions

In Scenario 1a with the modified assumptions, the number of passengers escaping via Exit L1 is greatly increased, being 2.5 times that in Scenario 1 where Assumptions 1 and 2 are strictly enforced. Thus in this scenario better use is made of both the large front exits. The improved use of both exits at the front of the aircraft should result in a substantial reduction in the evacuation time and in the number of fatalities. However, the evacuation time is reduced by only 12%, from 129.7 seconds to 113.5 seconds, and the number of fatalities is reduced from an average of 7 to 5. A similar behaviour is noted in Scenario 3a, where the overall evacuation time has only improved by just 3.6 seconds (4.3%) even though the number of agents using L1 has doubled. The relatively modest improvement in the evacuation time and the number of fatalities is the result of the cabin configuration in the vicinity of Exit L1 and R1. The 0.56-m-wide aisle aperture between the twin forward bulkheads forces the evacuating passengers to form a single-file flow. The resulting flow produced by the single aisle is insufficient to enable both the L1 and R1 exits to operate at their full evacuation flow capability. Thus, while the two exits are available and being used by a large number of agents, they do not produce a marked reduction in evacuation time or the number of fatalities. This result supports earlier observations that two Type I exits within an exit pair being feed by a single narrow aisle does not produce twice the exit flow of a single Type I exit(Reference Galea, Togher and Lawrence39).
The exit opening time analysis has demonstrated that delays of seconds in opening exits can result in a high fatality rate. Had all the viable exits been opened within the time achieved in evacuation certification trials, it is suggested that that all the fatalities in the Manchester B737 accident could have been completely avoided. Therefore, in aircraft accidents involving fire, it is essential that all the viable exits are opened as quickly as possible.
5.2 Impact of Exit R2 opening
Exit R2 was opened before the aircraft completely stopped. While the Exit R2 was not the main point for entry of the fire smoke into the cabin, it was not used by passengers during the evacuation, probably because of the proximity of the external fire. The official investigation report of the accident indicated that the opening of the exit may have contributed to the high fatality rate in the accident. This indication is examined in Scenario 4 in which Exit 2 is closed with all other set-up parameters being the same as the reconstruction. The results of Scenario 4 are presented in Fig. 13 and Table 3. As shonw in Fig. 13, with the closure of Exit R2, the predicted temperatures in the aisle near Exit ROW are lower than those in the reconstruction by approximately 15-50% after 100 seconds. The evacuation results in Table 3 show that had Exit R2 been closed throughout the fire (Scenario 4), there would have been 9 (16%) fewer fatalities than in the reconstruction scenario. Therefore, the opening of exit R2 in the accident seems likely to have been a contributing factor to the high fatality rate in this accident, but not as significant as the failure to open the other exits on time. This result can be explained through the different flow patterns in the two exit opening scenarios. With Exit R2 open, there is a flow path between the burn-through area and Exit R2. As a result, more combustible fuel at the bottom of the burn-through area is blown into the cabin than in the case with Exit R2 closed. This can be seen from the air flow patterns at the burn-through area in Fig. 14 for the two different exit opening scenarios.
Air flows at the cross plane passing through the burn-through area at 100 seconds in (a) the reconstruction and (b) the simulation with Exit R2 closed.

It is surprising that this result contradicts that in the earlier work(Reference Wang, Jia and Galea31), which suggested that 17% more deaths could be expected if Exit R2 was closed. This contradiction arises from the different representation of the external pool fire in the two simulations. The external fire in Ref. 31 is simply modelled as a pan fire next to the burn-through area, an approach developed in the experimental studies of post-crash cabin fire by the FAA(Reference Sarkos4). This approach of representing the external fire is appropriate for a scenario in which the fuselage collapses to the ground and the external fuel fire is adjacent to the fuselage. Clearly it is not an accurate representation of the external fire in the Manchester accident in which the aircraft stood on its landing gear. Using the simplified approach adopted in the earlier simulation, as the fuel pan is immediately adjacent to the burn-through area, virtually the entire fire plume is blown into the cabin even in the case with Exit R2 closed (see Fig. 15). Therefore, in the earlier work, the opening of Exit R2 had only a minor impact on the amount of external fire entering the cabin, i.e. it was virtually the same whether the Exit R2 was open or not. However, opening of the Exit R2 increased the ventilation of the cabin, resulting in a more survivable evacuation environment, and hence caused fewer fatalities. In contrast, in the more realistic simulation presented in this paper, the external fire is represented using a pool fire model and the fire origin is under the left engine as in the accident (see Fig. 3 for the pool fire location). With this approach, the fire plume will either enter the cabin through the burn-through area or rise above or go under the fuselage. As shown in Fig. 14, the opening of Exit R2 not only alters the ventilation inside the cabin but also changes the amount of the external fire entering the cabin. Thus, the current pool fire model compared with the fuel pan is a more realistic representation of the external fire in the Manchester airport B773 fire accident.
Air flow at the cross plane passing through the burn-through area at 100 seconds in the earlier work with Exit R2 closed.

It is thus likely that opening of the R2 exit during the accident was a contributing factor to the high fatality rate in this accident. However, had the fuselage been on its belly due to the failure of the landing gear and the external fuel fire been adjacent to the fuselage, it is likely that opening the rear door would have counter-intuitively improved conditions within the cabin. This suggests that in a post-crash fire with wind, the fuselage position, standing on its landing gear or collapsing onto the ground will have a significant impact on the fire development and resulting evacuation and survivability.
5.3 External wind
Here, a critical wind speed is determined for the given pool fire location, beyond which the external pool fire will be blown onto the fuselage. Then, the impact of wind speed on the fire development and evacuation is analysed. It is known that the wind speed during the accident was around 2.57-3.60 m/s, which is an important factor for the burn-through of the fuselage as the pool fire was blown onto the fuselage. Within the original reconstruction analysis reported earlier in this paper, the wind speed used in the analysis was 2.82 m/s. However, it is important to determine at what wind speed a burn-through can be avoided. A series of fire simulations are carried out with the fuel pool area the same as that in the reconstruction but with varied external wind speeds. As expected, a mild wind will make the external fire localised around the left engine, while a strong wind will blow the fire plume onto the fuselage. With the same wind direction as in the accident but a wind speed value of 1.5 m/s, the pool fire plume rises up almost vertically creating a gap of approximately 1m between it and the fuselage (Fig. 16(a)). However, a wind speed of 2m/s is sufficient to cause the pool fire plume to lean against the fuselage (Fig. 16(b)).
External pool fire plume at 70 seconds under a wind speed of (a) 1.5m/s and (b) 2.0m/s.

With a reduced wind speed, it is likely that the burn-through will occur at a later time and be of a reduced burn-through area. A conservative estimation of the impact of reduced wind speeds on both the cabin fire development and evacuation can be examined using the same burn-through time and area as those determined for the accident reconstruction. The impact of external wind speed on cabin fire development is investigated by comparing the predicted temperatures at the knee height in the aisle near the over-wing exits under different external wind conditions. The predictions of the temperatures are presented in Fig. 17. As shown in Fig. 17, when the external wind speed is 1.5m/s, the cabin temperature at the location of interest is not affected by the external fire, with its initial values of 15°C being maintained during the 200-second fire duration. When the external wind speed increases to 2m/s, the cabin temperature has a rise of approximately 10°C after the start of burn-through. A rapid rise of temperature is seen at 130 seconds, which is 50 seconds later than that in the reconstruction simulation (which utilised an external wind speed of 2.82m/s). The evacuation results under various wind conditions are presented in Table 5, where it is assumed that the exits open at the same time as in the actual accident for each of the simulations, the only difference being the wind speed. With an external wind of 1.5m/s, all the agents on board can safely evacuate the cabin and reach the ground within 129.4 seconds. For a wind of 2m/s, there will be an average of 32 fatalities and 12.5 severe injuries. The total evacuation time in this case is 155 seconds, with the temperatures at the over-wing exit increasing rapidly at around 130 seconds. Thus, the high number of fatalities in this case is due to a number of passengers still remaining within the cabin when the temperature begins to rise rapidly.
Predicted temperature at knee height in the aisle near the over-wing exits with various external wind speeds.

Impact of external wind speed on evacuation in accident reconstruction scenario

*Wind speed used in the original reconstruction case.
Considering that the wind affects the burn-through process, it is difficult to achieve a high precision in wind sensitivity analysis without an accurate predictive modelling approach to the burn-through process. Therefore, the same burn-through time and area as those in the reconstruction simulation are used to investigate the impact of wind speed on the cabin fire development and the predicted evacuation consequences. The wind speed during the accident was around 2.57-3.60m/s. Using the lower bound wind speed from the actual accident (2.57m/s), the cabin temperatures at the location of interest are very close to those generated using the wind speed in the original reconstruction simulation, i.e. 2.82m/s (Fig. 17). As a result, the predicted fatalities are very similar to those in the reconstruction simulation, with only 2.7 fewer fatalities and 4.4 more severe injuries (Table 5). This is a further evidence to support the appropriateness of the use of a wind speed at 2.82m/s within the reconstruction simulation.
Therefore, for the given fuel pool location, size and prevailing wind direction experienced in the Manchester B737 fire, the critical wind speed required to engulf the rear of the fuselage is just 1.5m/s. Beyond this critical value, the pool fire plume will impinge on the fuselage and the cabin wall is at a high risk of burn-through before passengers safely evacuate from the cabin.
6.0 POTENTIAL ENHANCEMENTS TO AIRCRAFT FIRE SAFETY THROUGH THE USE OF ADVANCED AIRCRAFT MATERIALS
Thirty years have passed since the Manchester aircraft fire. Advances in materials technology has led to the development of a new generation of materials with improved fire resistance used in the current generation of commercial aircraft. How have these new materials benefited fire safety of modern aircraft design? Here, the impact of modern aircraft insulation materials with improved burn-though resistance and cabin interior materials with higher ignition temperatures are examined. In particular, we explore the impact the current generation of aircraft materials would have had on a Manchester-type aircraft fire.
6.1 Insulation material
The cabin wall burn-through is the key factor for the fire development within the cabin and the resulting fatalities in the Manchester aircraft fire accident. As the time to burn-through is essential in the assessment of aircraft fire safety in a post-crash fire scenario, full-scale tests to evaluate the fuselage burn-through resistance exposed to large post-crash fuel fires have been carried out by the FAA(Reference Marker42). It has been found that an aluminium skin can provide 30-60 seconds of protection prior to melting and allowing flames to impinge on the insulation materials. For the old generation of aircraft insulation materials, the burn-through resistance is around 52-96 seconds. Therefore, the burn-though time for a fuselage with these insulation materials is between 82 and 156 seconds. The derived start of the wall burn-through of 75 seconds for the Manchester aircraft fire in this study is close to the minimum burn-through times found in the experimental study. For the new generation of cabin insulation materials, the burn-through resistance has been significantly improved with burn-through times in the range of 4-8 minutes. How will the new materials increase passengers’ survivability in post-crash fires involving burn-through? A statistical modelling study shows that the number of reduced fatalities is an exponential function of the additional burn-through protection time(Reference Cherry and Warren43). Most of the fatalities in accidents could be avoided if the burn-through time was increased by 2 minutes. Almost all of the fatalities could be avoided if the additional burn-through time could be increased by 4-8 minutes. For a specific accident, the number of lives saved with the increase of burn-through time also depends on the available exits for evacuation and the delays in opening exit, etc.
Given the three available exits and the exit opening times in the Manchester aircraft accident, the improvement of survivability with improved fire resistance cabin insulation materials is analysed here. In this analysis, it is simply assumed that the new materials only affect the time to burn-through, while the size of the burn-though area and the time duration of the burn-through remain the same as those in the reconstruction. With this assumption, the fire hazards predicted from the reconstruction of the Manchester accident can be applied in examining the impact of burn-through time. This is done by simply delaying the occurrence of the fire hazards predicted from the reconstruction by the delayed time to burn-through.
Presented in Fig. 18 is a comparison of the predicted number of fatalities and injuries as a function of burn-through time for a Manchester style fire scenario. If the burn-through time is increased by 10 seconds compared with a burn-through of 75 seconds in the reconstruction, the number of predicted fatalities is reduced from 55.5 to 37.0 – a reduction of 33%. A 40-second increase in burn-through time could reduce the number of fire victims to be just one person. If the time to burn-though was increased by 50 seconds, resulting in a burn-through time of 125 seconds, all of the passengers could escape from the cabin without any fatalities or severe injuries.
Impact of burn-through time (s) on fatalities and injuries.

It is interesting to note that all passengers can evacuate to the ground within 132 seconds if there are no fire hazards within the cabin, assuming evacuation conditions equivalent to the reconstruction case. This result demonstrates that the use of advanced aircraft materials with burn-through times of 4-8 minutes(Reference Marker42) – an improvement of at least 2 minutes compared to the materials from the 1985-era B737 – could avoid all lose of life resulting from post-crash pool fires similar to that in the Manchester accident.
The sensitivity analysis of burn-through time demonstrates that all the passengers in the Manchester accident could have safely evacuated if the burn-through time could have been delayed by just 50 seconds. This result suggests that modern cabin insulation materials that have a burn-through time of 4-8 minutes can significantly improve passengers’ survivability in post-crash pool fires without a rupture to the fuselage.
6.2 Interior materials
In this section, the impact of improved fire resistance of cabin interior materials such as seats, overhead bins and floor monuments etc. on survivability is analysed. In the accident reconstruction, the properties of the cabin materials are the same as those in the simulation of the C133 cabin fire test(Reference Wang, Jia and Galea13). As mentioned in the official investigation report(Reference King1), the regulatory standard for cabin material certification was adopted in May 1972 and specified that all large usage material must be self-extinguishing in a vertical orientation when subjected to a ‘Bunsen-burner’ flame. Whilst such a test may be useful for demonstrating protection against a small flame in a cabin, it clearly does not indicate the results of exposure to a large external fire. Also as reviewed in this report, full-scale fire tests involving an external pool fire carried out at the FAA Technical Centre showed that the use of a highly resistant fire-blocking covering for seat cushions could increase the time to incapacitation by about 60 seconds compared with that without such a fire-blocking layer.
In this simulation the improved cabin materials are represented by increasing the ignition temperature of the cabin materials. Within the reconstruction scenario, the ignition temperature of cabin interior materials was set to 505°C(Reference Quintiere44). The ignition temperatures of modern aircraft cabin materials can be as high as 570°C(Reference Babrauskas45). Therefore, in the new fire simulation, all the parameters are identical to those of the reconstruction scenario but all interior cabin materials have an ignition temperature of 570°C (a nearly 13% increase).
The ignited seat locations at 180 seconds in this simulation are presented in Fig. 19. The propagation of the fire within the cabin is represented by the damaged seats in this figure. Comparing Fig. 10(b) with Fig. 19, it can be seen that a cabin interior material with higher ignition temperature will prevent rapid spread of the fire front from the aft of the cabin to the forward part of the cabin.
Ignited seat locations at 180 seconds in the simulation with ignition temperature of 570°C for cabin interior materials.

Now the impact of the advanced cabin interior materials on passengers’ survivability is analysed. With the improved internal materials, the average number of incapacitations is 54.7 compared with 55.5 in the reconstruction. The insignificant improvement in survivability is due to the nature of the fire incident. In the Manchester accident, it is the rapid fuselage burn-through assisted by the external wind, allowing the fire effluent from the external pool fire plume to gain entry into the cabin that is the main contributor to the fire hazards within the cabin affecting evacuation. While the burning of the seats in the rear of the cabin in the vicinity of the burn-through also contributes to the non-tenability within the cabin, this is the same in both cases due to the extremity of the thermal conditions in this region. Most of the seats in the front of the cabin are ignited after the passengers have evacuated and so does not impact survivability. As a result, the predicted fire hazards within the cabin are almost identical during the evacuation process for the two scenarios, with and without the improved cabin materials.
While the use of advanced cabin interior materials with a 13% increase in ignition temperature has significantly slowed the spread of the internal combustion region (number of seats involved in the combustion), this is not expected to have a significant impact on passenger survivability as in this accident survivability was driven by the nature of the external fire and wind.
7.0 CONCLUSIONS
SMARTFIRE and airEXODUS simulation tools have been used to numerically investigate the 1985 Manchester Airport B737 fire/evacuation. The purpose of this analysis was to understand the impact of exit opening times, external wind and aircraft cabin materials on evacuation and survivability during this accident. The first part of the analysis involved reconstructing the cabin fire as closely as possible, adjusting the main unknown parameters such as; burn-through time so that the prediction of key measurable outcomes such as damage to seats, propagation of cabin smoke, the number and seating distribution of fatalities, the percentage of passengers climbing over seats, etc. were in reasonable agreement with the officially reported results. The second part of the analysis investigated the impact of influential parameters such as external wind speeds and exit opening times on passenger survivability within the Manchester incident. The third part analysed the benefits that modern cabin internal materials and fuselage thermal insulation materials would have in slowing down fire development within the cabin and reducing fatalities.
The key findings from this work are:
-
• Coupled fire and evacuation analysis is capable of reconstructing the complex fire dynamics and resulting evacuation dynamics involved in post-crash aircraft fires involving an external pool fire with wind, burn-through of the fuselage, and spread of the fire in the cabin and the impact of fire hazards on evacuating passengers.
-
• In the Manchester Airport B737 fire, a 1-minute delay in opening the forward exits contributed to the loss of 48 lives while a 30-second delay in opening the over-wing exit contributed to the loss of 20 lives. Had all the viable exits been opened within the time achieved in evacuation certification trials, it is suggested that all the passengers and crew could have safely evacuated.
-
o In aircraft accidents involving fire, it is essential that all the viable exits are opened as quickly as possible. Delays of seconds in opening exits can result in a high fatality rate. These results demonstrate why it is essential:
-
▪ to have a cabin crew member available at each floor-level exit that is able to open the exit within seconds. If there is only a single crew member responsible for opening both exits in an exit pair, or should a crew member be injured as a result of the accident and unable to open their exit, this can delay the opening of both exits potentially contributing to loss of life.
-
▪ that passengers seated beside over-wing Type III exits are able to quickly operate the exit in the event of an emergency.
-
-
-
• Within the Manchester accident, the opening of the unused rear exit is likely to have contributed to the loss of life. Had the exit not been opened, it is likely that there would have been 9 (16%) fewer fatalities. Thus, while the opening of the exit contributed to the high fatality rate in this accident, it was not as significant as the failure to open the other exits on time.
-
o This result contradicts the conclusions of an earlier analysis, in which the external fire was simply represented by a pan fuel fire. In this earlier analysis, the fire simulation was equivalent to a situation in which the fuselage collapses to the ground and the external fire is adjacent to the fuselage. This suggests that in a post-crash fire with wind, the fuselage position – standing on its landing gear or collapsing to the ground – will have a significant impact on the interior fire development and hence evacuation and survivability.
-
-
• The presence of wind is a significant factor in determining the burn-through of the fuselage and hence passenger evacuation and survivability. With the given fuel pool position and wind direction as in the Manchester incident, the critical wind speed is only 1.5m/s, beyond which the pool fire plume will impinge on the fuselage and the cabin wall is at a high risk of burn-through before passengers safely evacuate from the cabin.
-
• Numerical simulation results have demonstrated that modern advanced cabin insulation materials and cabin interior materials with improved fire resistance can significantly improve aircraft fire safety in a post-crash fire scenario.
-
o If the burn-through time could have been delayed by just 50 seconds, it is likely that all the passengers in the Manchester aircraft accident could have safely evacuated. This suggests that significant improvements in passenger survivability can be expected from modern cabin insulation materials that have burn-through time of 4-8 minutes.
-
o While the use of cabin interior materials with a 13% increase in ignition temperature could significantly slow down the propagation of the internal cabin fire in the Manchester aircraft fire accident, this is not expected to have a significant impact on passenger survivability as in this accident survivability was driven by the nature of the external fire.
-
This analysis has shown that in aircraft fire situations, seconds can make the difference between life and death. It is thus essential that cabin crew undertake their evacuation duties as quickly as possible and passengers seated beside over wing Type III exits fully appreciate the importance of understanding how to open the exit in the event of an emergency. The aircraft orientation in a fire is critically important even under a mild wind. Aircrew should be advised to position the aircraft most beneficially against the wind in the event of a ground fire. Cabin wall insulations with burn-through resistance of more than 4 minutes and advanced cabin interior materials with high ignition temperatures are suggested for commercial aircrafts.
ACKNOWLEDGEMENTS
The authors are indebted to the EU commission for funding project AIRCRAFT FIRE (Framework 7 2010-265612-CP-FP). The authors dedicate this research to the victims of the Manchester Airport B737 fire, their families and to the survivors of the fire, from whom we have learnt a lot.



