INTRODUCTION
Lentil is one of the most important pulses worldwide, with high nutritive value (Tambal et al. Reference Tambal, Erskine, Baalbaki and Zaiter2000; Sarker et al. Reference Sarker, Singh, Rajaram and Erskine2010). The capacity of lentil and other legumes to assimilate atmospheric nitrogen (N) and improve carbon (C) and organic matter (OM) content renders such crops of value for rotation programmes, which makes them a valuable alternative crop in sustainable crop production systems (Erskine et al. Reference Erskine, Muehlbauer, Sarker, Sharma, Erskine, Muehlbauer, Sarker and Sharma2009; Sarker et al. Reference Sarker, Singh, Rajaram and Erskine2010).
Nevertheless, even though lentil has been cultivated for almost 10 000 years (Hansen & Renfrew Reference Hansen and Renfrew1978), systematic breeding research has been carried out only recently. In developing countries, locally adapted varieties called landraces, which are generally the product of natural selection, are usually grown (Sarker & Erskine Reference Sarker and Erskine2006). In Greece, the cultivation of such traditional landraces is a common practice often under low-input conditions without irrigation or chemical fertilization; therefore, they commonly have low yield potential and their productivity is further reduced due to biotic stress (E. K. Chatzivassiliou, unpublished).
Lentil crops suffer from natural infection from more than 20 viruses; the aphid-transmitted bean leafroll virus (BLRV, genus Luteovirus, family: Luteoviridae), beet western yellows virus (BWYV, genus: Polerovirus, family: Luteoviridae), faba bean necrotic yellows virus (FBNYV, genus: Nanovirus, family: Nanoviridae), chickpea chlorotic stunt virus (CpCSV, genus: Polerovirus, family: Luteoviridae) and soybean dwarf virus (SbDV, genus: Luteovirus, family: Luteoviridae) are considered as the most important ones resulting in severe crop losses (Kumari et al. Reference Kumari, Larsen, Makkouk, Bashir, Erskine, Muehlbauer, Sarker and Sharma2009). Five more viruses, alfalfa mosaic virus (AMV, genus: Alfamovirus, family: Bromoviridae), bean yellow mosaic virus (BYMV, genus: Potyvirus, family: Potyviridae), cucumber mosaic virus (CMV, genus: Cucumovirus, family: Bromoviridae), pea seed-borne mosaic virus (PSbMV, genus: Potyvirus, family: Potyviridae) and broad bean stain virus (BBSV, genus: Comovirus, family: Comoviridae), are also seed-borne in lentil (Kumari et al. Reference Kumari, Larsen, Makkouk, Bashir, Erskine, Muehlbauer, Sarker and Sharma2009). Yield losses due to virus infection depend on the virus sources available and time and severity of infection ranging from slight to total destruction (Coutts et al. Reference Coutts, Prince and Jones2009; Kumari et al. Reference Kumari, Larsen, Makkouk, Bashir, Erskine, Muehlbauer, Sarker and Sharma2009). The use of varieties that show any type of resistance to virus infection is the most effective and environmentally friendly control measure (Jones Reference Jones2004). Therefore, the isolation of such varieties is of major importance for the sustainability of the crop. In Greece, field surveys performed in late spring of 2007 and 2008 showed that viruses constitute major constraints of lentil production; pea enation mosaic virus-1 (PEMV-1, genus: Enamovirus, family: Luteoviridae) and BLRV were the most widespread viruses. All the seed-borne viruses were also detected with PSbMV, AMV, and BYMV being the most frequent (E. K. Chatzivassiliou, unpublished).
Because lentil is predominantly self-pollinated (Andrews & McKenzie Reference Andrews, McKenzie, Yadav, McNeil and Stevenson2007), the landraces are assumed to consist of a mixture of fairly homogeneous plants; hence, they represent a valuable gene pool from which a breeder could derive elite pure-line varieties adapted to target environments. In this sense, the main goal of the present study was to investigate the ability to isolate favourable pure lines by selecting individual plants.
Honeycomb breeding is suggested as an innovative method for developing improved varieties (Fasoulas Reference Fasoulas1993; Fasoulas & Fasoula Reference Fasoulas and Fasoula1995; Fasoula & Tokatlidis Reference Fasoula and Tokatlidis2012). The primary principle of this method is plant evaluation and selection under ultra-low plant densities. In honeycomb breeding, two novel equations have been proposed to integrate yield potential and yield stability (Fasoula Reference Fasoula2012; Fasoula & Tokatlidis Reference Fasoula and Tokatlidis2012). Single-plant selection on the basis of the first equation that measures the relative plant yield potential (PYP) is applicable within progeny lines distinguished for the relative crop yield potential (CYP) estimated through the second equation. For a particular plant under consideration PYP is estimated by the formula  ${\rm PYP} = (x/\bar x_r )^2 \times (\bar x/s)^2 $, which combines the coefficient of plant yield
 $(x/\bar x_r )^2 $ and the coefficient of homeostasis
 $(\bar x/s)^2 $ of the genotype this particular plant belongs to; x is the plant yield,
 $\bar x_r $ the mean yield of all the surrounding plants within a ‘moving circle’ of a chosen size,
 $\bar x$ the genotype mean yield, and s its standard deviation. In turn, CYP is calculated by the formula
 ${\rm CYP} = (\bar x/\bar x_t )^2 \times (\bar x/s)^2 $, where
 $(\bar x/\bar x_t )^2 $ represents the coefficient of the genotype yield while the second parameter is common in both equations;
 $\bar x_t $ is the overall experimental mean yield (Fasoula & Tokatlidis Reference Fasoula and Tokatlidis2012).
In terms of stress factors, phenotypic expression of susceptibility is intensified when plants are wide apart, facilitating the isolation of improved genotypes. Indeed, with regard to biotic stresses in general (Kotzamanidis et al. Reference Kotzamanidis, Lithourgidis and Roupakias2009) and insect-transmitted viruses in particular, high plant densities result in early canopy formation that shades over any infected source plant, whereas low plant density conditions increase insect vector landing rates and favour the likelihood of virus spread (Jones Reference Jones2004; Makkouk & Kumari Reference Makkouk and Kumari2009). Therefore, ultra-low density conditions applied during honeycomb breeding are expected to enhance the ability to identify putative virus-resistant and/or tolerant genotypes.
The main objective of the present work was to exploit the natural variation within a commercially cultivated lentil landrace and derive high-yielding pure-line varieties adapted at low-input conditions via single-plant selection at ultra-low density. At the same time, the effect of the applied methodology towards the identification of genotypes with improved performance against viruses is also discussed.
MATERIALS AND METHODS
Source material and experimental treatments
A lentil landrace, well-adapted and cultivated commercially in northeast Greece (Evros province), was the source material used in the present study, hereafter called the mother population (MP). Its average grain yield in the area is >1·50 t/ha of high commercial quality product. Stock seed was provided by the pulse company ‘AGROKIPIO SA’ (Lepti/Orestiada, Greece).
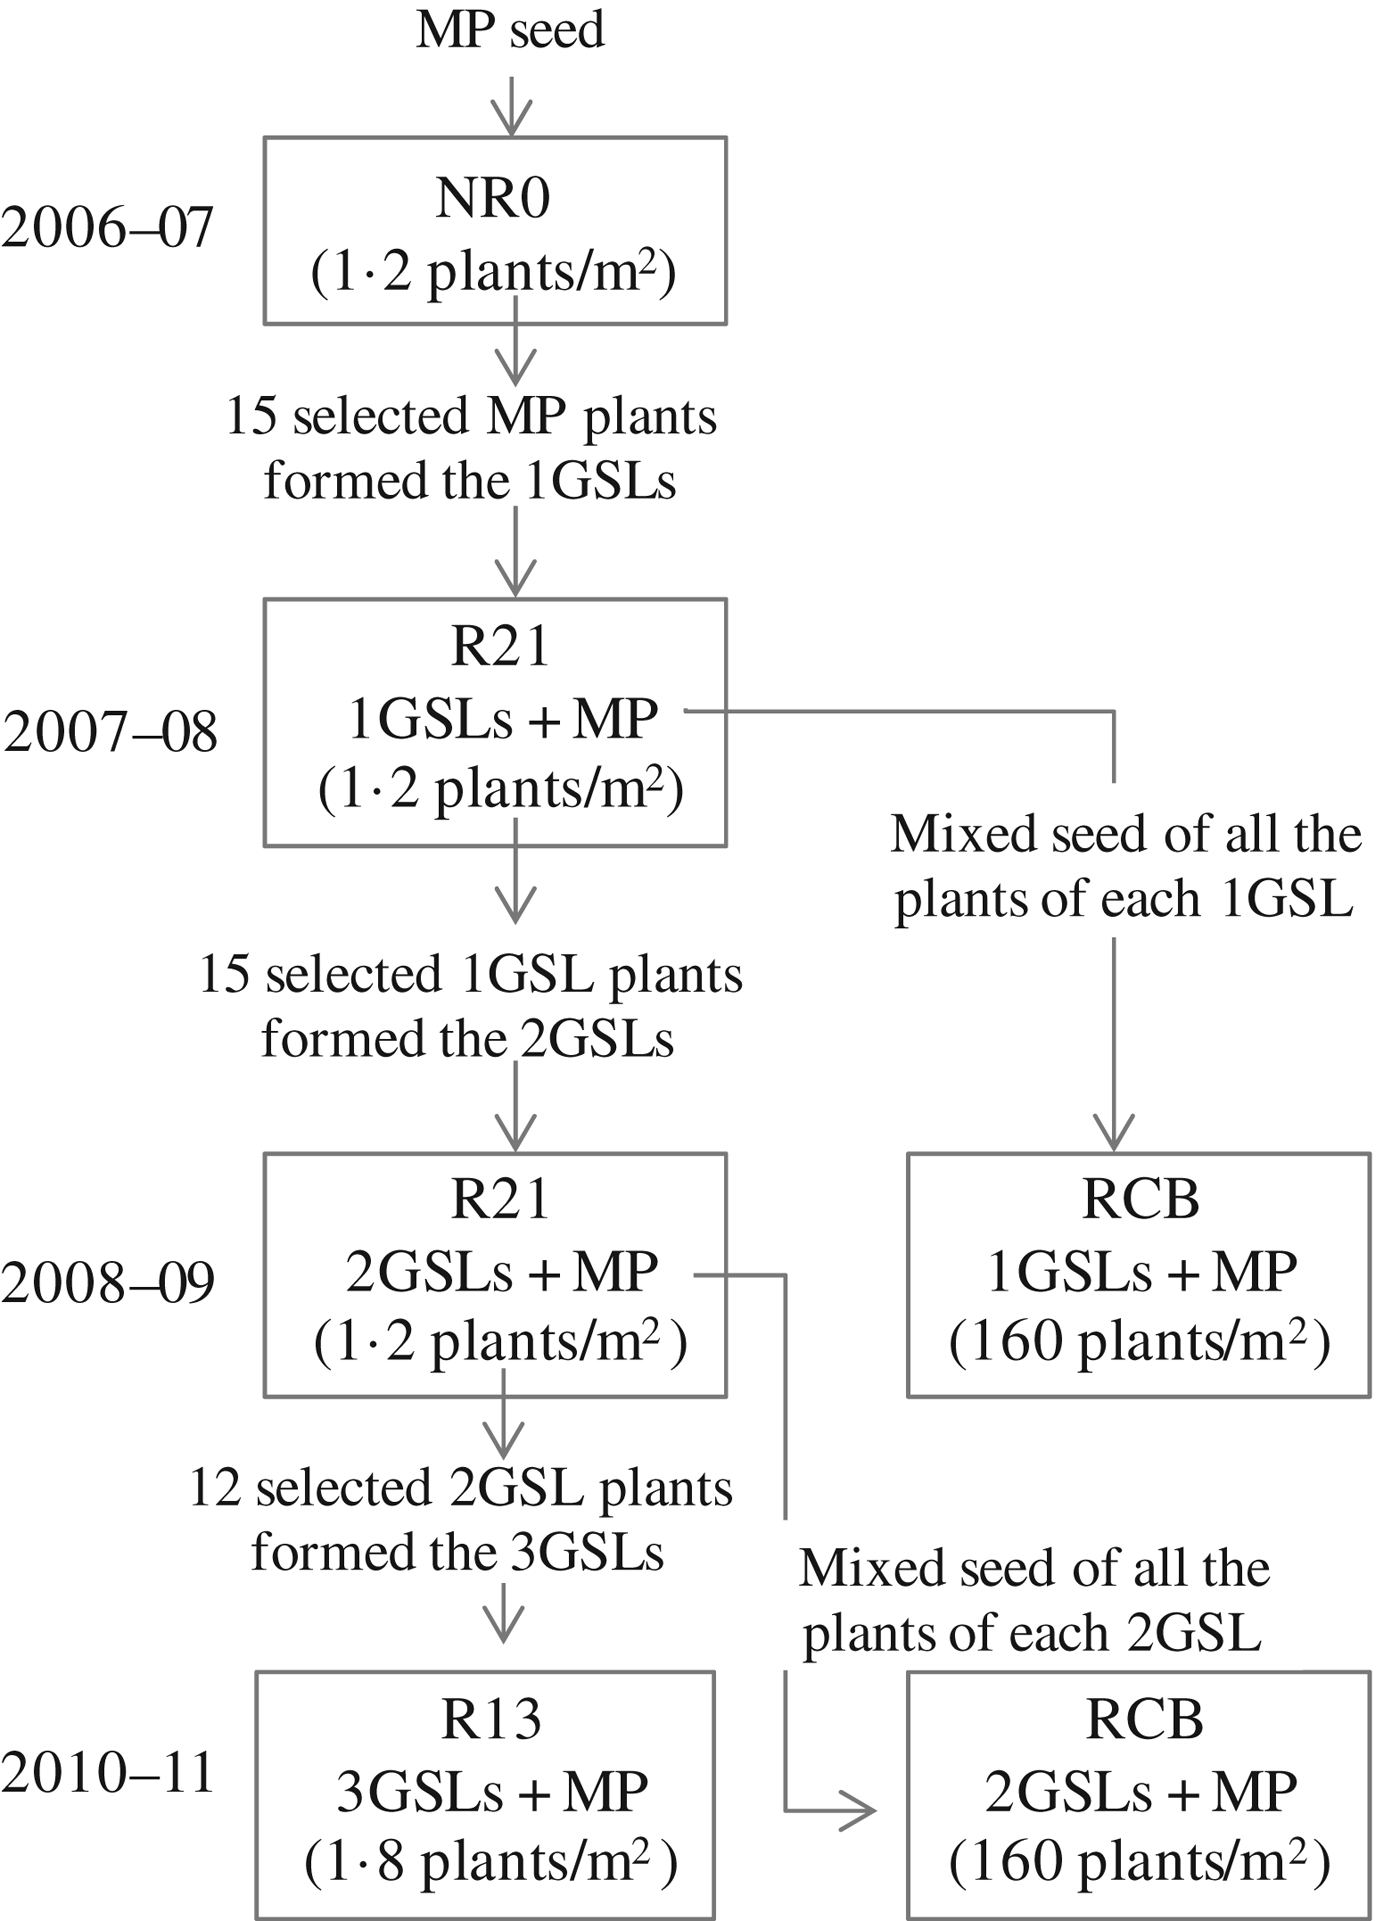
Field experimentation was carried out at the farm of the Democritus University of Thrace in Orestiada, Greece (41°29′Ν, 26°32′Ε, 25 m a.s.l.). The soil was silty clay with pH 7·6, 21·5 g OM/kg, 10·1 mg nitrate (NO3)/kg, 13·5 mg phosphorus (P-Olsen)/kg and 171 mg potassium (K)/kg. Lentil plants were grown under rain-fed conditions without fertilization or any chemical application, while weed control was carried out by hand weeding. Two or three seeds were sown in each hill and later thinned to obtain single-plant hills. Where germination failed completely, greenhouse-grown plants of the same age were transplanted to the hill. The principles of the honeycomb method (Fasoulas & Fasoula Reference Fasoulas and Fasoula1995) were applied for three successive years at the ultra-low density of 1·2 plants/m2 (single-plant hills spaced 100×100 cm apart) to select symptomless, high-yielding plants and create single-plant sister lines. Plants were individually harvested in separate cloth sacks, air-dried for 1 month and subsequently their grain yield was weighed. The sister lines were also evaluated in the subsequent year at the commercial planting density of 160 plants/m2 (seeding rate adjusted on the basis of the 1000 seed weight) in a randomized complete block (RCB) replicated four times. Each plot consisted of five rows spaced 25 cm apart and 4 m long. At harvest, the three central rows from each plot were collected and grain yield per hectare (ha) was determined. Stock seed of the MP initially used was included in the experimentation trials as control for the sister lines. A concise description of the experimentation process is presented in Fig. 1.
The procedure of field experimentation to select from the MP and evaluate the first-, second- and third-generation sister lines (1GSL, 2GSL and 3GSL, respectively) at the ultra-low density, and subsequently to evaluate the 1GSLs and 2GSLs at the commercial planting density of 160 plants/m2.

Field experimentation for sister-line selection and evaluation
During the first growing season 1088 plants of the MP were grown in the field (sowing date 20 November 2006) according to the non-replicated-zero (NR0) honeycomb design (Fasoulas & Fasoula Reference Fasoulas and Fasoula1995). The health status of the source material (i.e. MP) was evaluated in a subsample of 100 seeds. The 15 highest-yielding plants were selected and the seeds of each one constituted a separate first generation sister line (1GSL), coded hereafter as 1, 2,…,15. Ten seeds from each 1GSL were tested for the presence of seed-borne viruses.
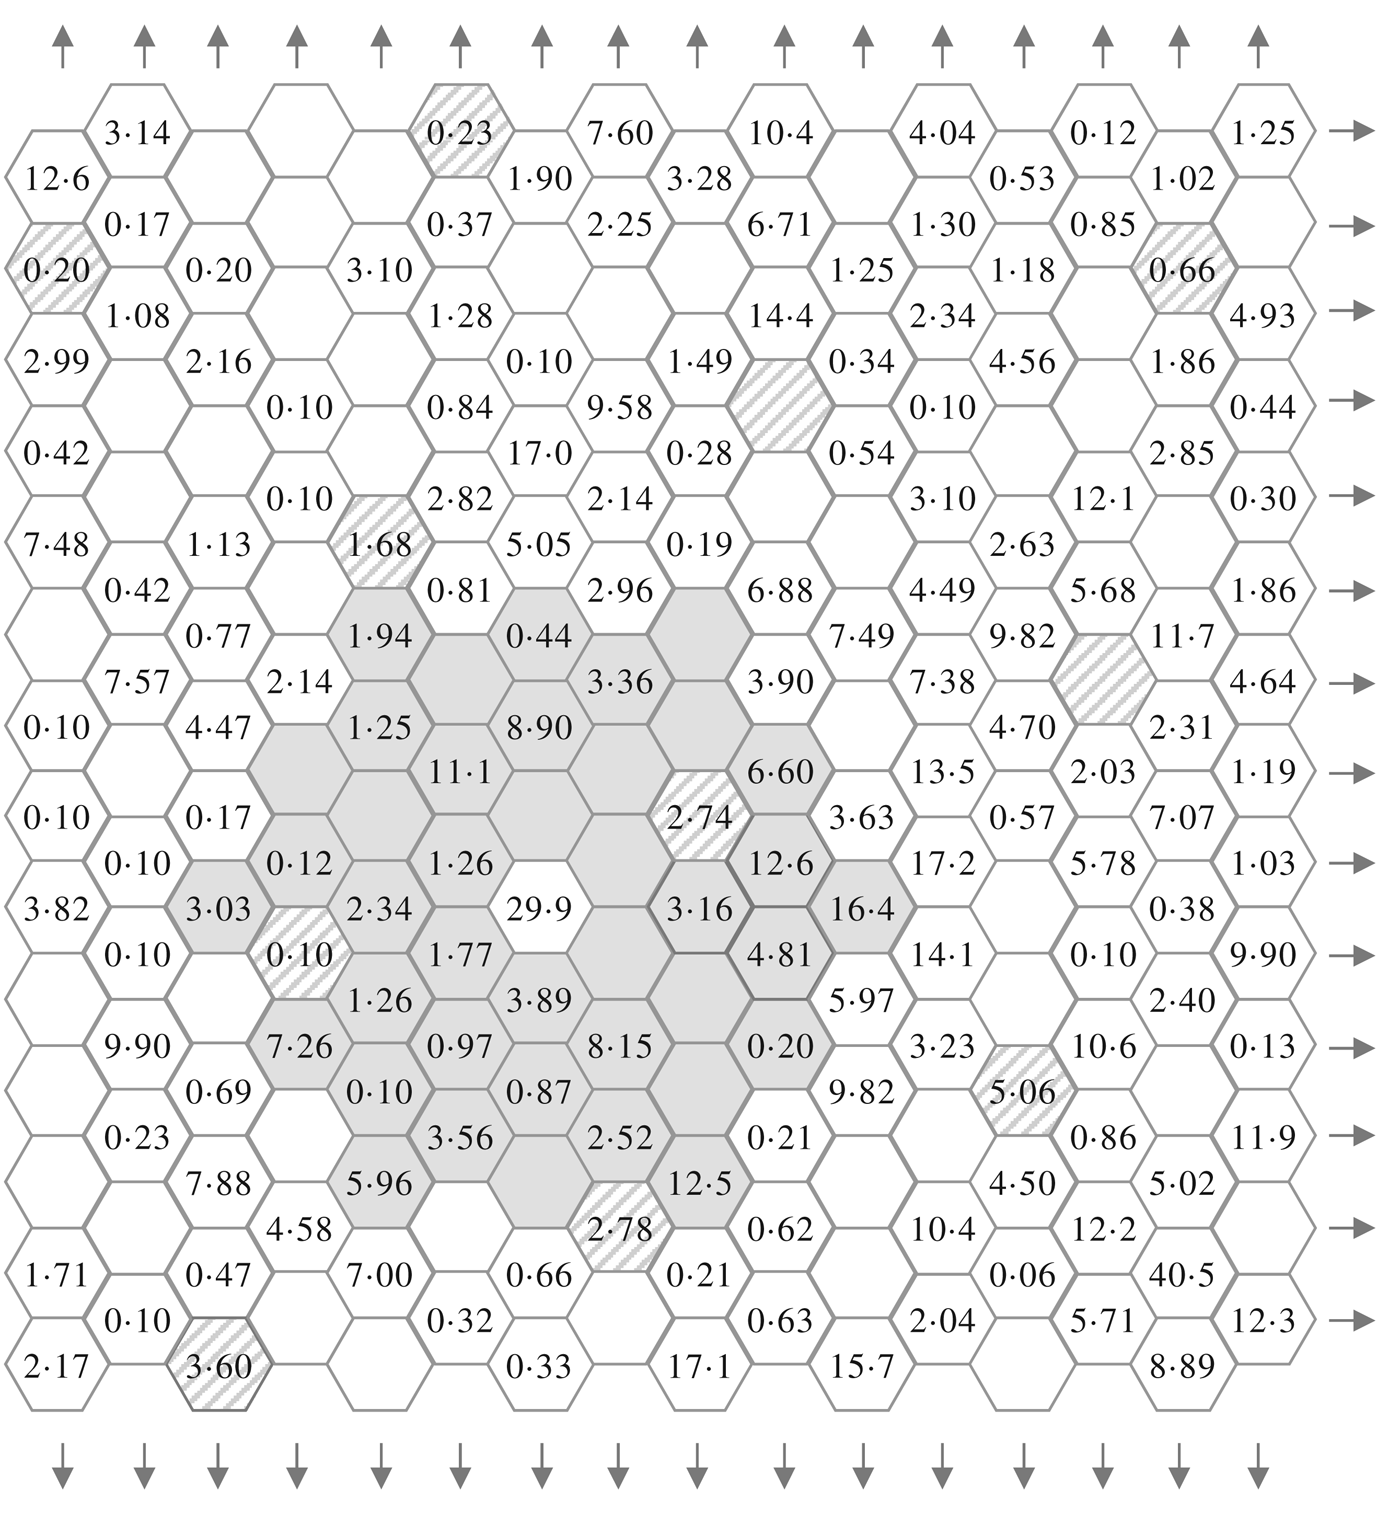
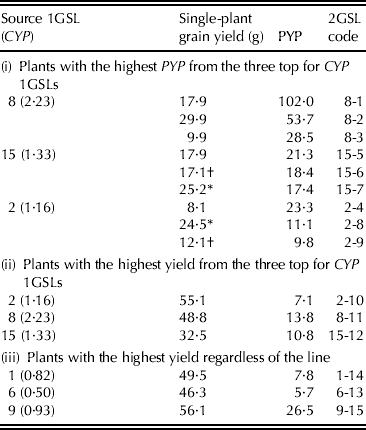
The following growing season, 100 plants per 1GSL were tested in a replicated ‘R21’ honeycomb trial, sown on 2 December 2007. The entries were evaluated based on their CYP and individual plants on PYP values with a ‘moving circle’ including 43 plants (Fig. 2). Fifteen plants were selected to form the second generation sister lines (2GSL) in the following order: (i) the nine highest-scoring plants according to their PYP values among the three 1GSLs with the highest CYP values; (ii) three plants producing the highest absolute yields among the three 1GSLs with the highest CYP values; and (iii) three plants showing the highest absolute yields providing that they did not belong to any of the three 1GSLs selected above. Leaf tissues from the 100 highest-yielding plants, including the 15 selected ones, were tested for virus presence. In addition, ten seeds from each 2GSL were tested for the presence of seed-borne viruses.
Part of the honeycomb experimentation to evaluate the 1GSLs and apply selection for the 2GSLs; numbers represent single-plant yields (g). This arrangement allocates entries evenly across the entire area in an equilateral triangular lattice pattern, as shown for positions of the control MP (lined positions), sampling thus effectively the environmental heterogeneity. The plant (29·9 g) in the centre of the ‘moving circle’ (shaded positions) is selectable based on the 1st selection criterion due to high PYP within the 1GSL coded 8 showing the highest CYP (Table 2). PYP is estimated in relevance to the average yield of the 30 finally harvested plants within the circle and the coefficient of homeostasis of line 8.
During the 2008/09 growing season, the 15 2GSLs were evaluated for yield, as described for the previous season. To further investigate the response to selection, the six plants showing the highest PYP values were selected from among the two top CYP-scoring 2GDSLs of different origin (12 plants in total), thus forming third generation sister lines (3GSLs). From each selected plant, ten seeds were sown in the glasshouse and an ELISA test was also conducted on the emerged seedlings. Adjusted for the R21, an RCB as previously described was established for the 1GSLs (the same sowing date) and grain yield was measured.
One growing season was lost due to serious flooding, so to compare the 3GSLs with the source population, a honeycomb ‘R13’ trial was established during the 2010/11 season (sowing date 12 February 2011) with 70 plants per entry and an interplant distance of 80 cm (1·8 plants/m2). The respective RCB trial for the 2GSLs was also set up.
Assays for virus presence
Virus presence in the seeds used or the plants selected in each selection cycle was measured by ELISA (Clark & Adams Reference Clark and Adams1977). Tests were run using commercial polyclonal and monoclonal antibodies for BLRV (Neogen Europe Ltd), AMV, BBSV, BYMV, CMV, PSbMV and PEMV-1 (LOEWE Biochemica GmbH, Germany), according to the manufacturer's procedure. Seed health status was evaluated by sowing a number of randomly selected seeds in the greenhouse (20 °C and 8 h light) and subsequently testing the plants showing symptoms suggestive of virus infection. The number of seeds that failed to sprout was also recorded. In the field, leaf tissues from the most vigorous plants were collected c. 15 days before senescence and kept in the freezer at −20 °C. Occasionally, plants exhibiting severe symptoms resulting in plant death were sampled before they dried out to investigate the possible involvement of any virus. Tissues from the plants selected based on their yield were also tested for the presence of the virus. Additionally, samples of seeds were tested for the presence of seed-borne viruses (PSbMV, AMV, BYMV, CMV and BBSV), while those of the selected plants were also analysed for the presence of PEMV and BLRV.
Statistical analysis
The HONEY microcomputer program (Batzios & Roupakias Reference Batzios and Roupakias1997) was used for statistical analysis of the ultra-low density data. To compare two mean yields per plant, the standard error of difference (s.e.d.) was used for independent samples.
Regarding the yield performance per unit area at the commercial density, analysis of variance (ANOVA) was conducted for each RCB trial. To compare two means on the condition of significant main effects, the s.e.d. was computed.
RESULTS
Source-population evaluation and first generation sister-line selection at the ultra-low density
When the lentil landrace source material was evaluated in the greenhouse, 0·08 of the seeds failed to sprout and 0·12 were found to be infected with PSbMV. In the 2006/07 season, several plants in the field exhibited symptoms suggestive of virus infection very early in the spring and disease spread to a vast number of plants that eventually died. Out of the 1088 plants initially established, only 584 plants survived and reached maturity (i.e. 0·54), displaying an average grain yield of 3·35 g/plant. Furthermore, several of the surviving plants barely managed to produce small pods and seed, leading to an extensive range in single-plant grain yields varying from 0·08 to 26·4 g with a standard deviation of 4·31 g (coefficient of variation, CV=1·29). The yields of the 15 individual plants selected to form the respective 15 1GPLs were above 17·5 g (results not shown). No virus test was performed on the field plants during the first year of experimentation.
First generation sister-line evaluation and second generation sister-line selection at the ultra-low density
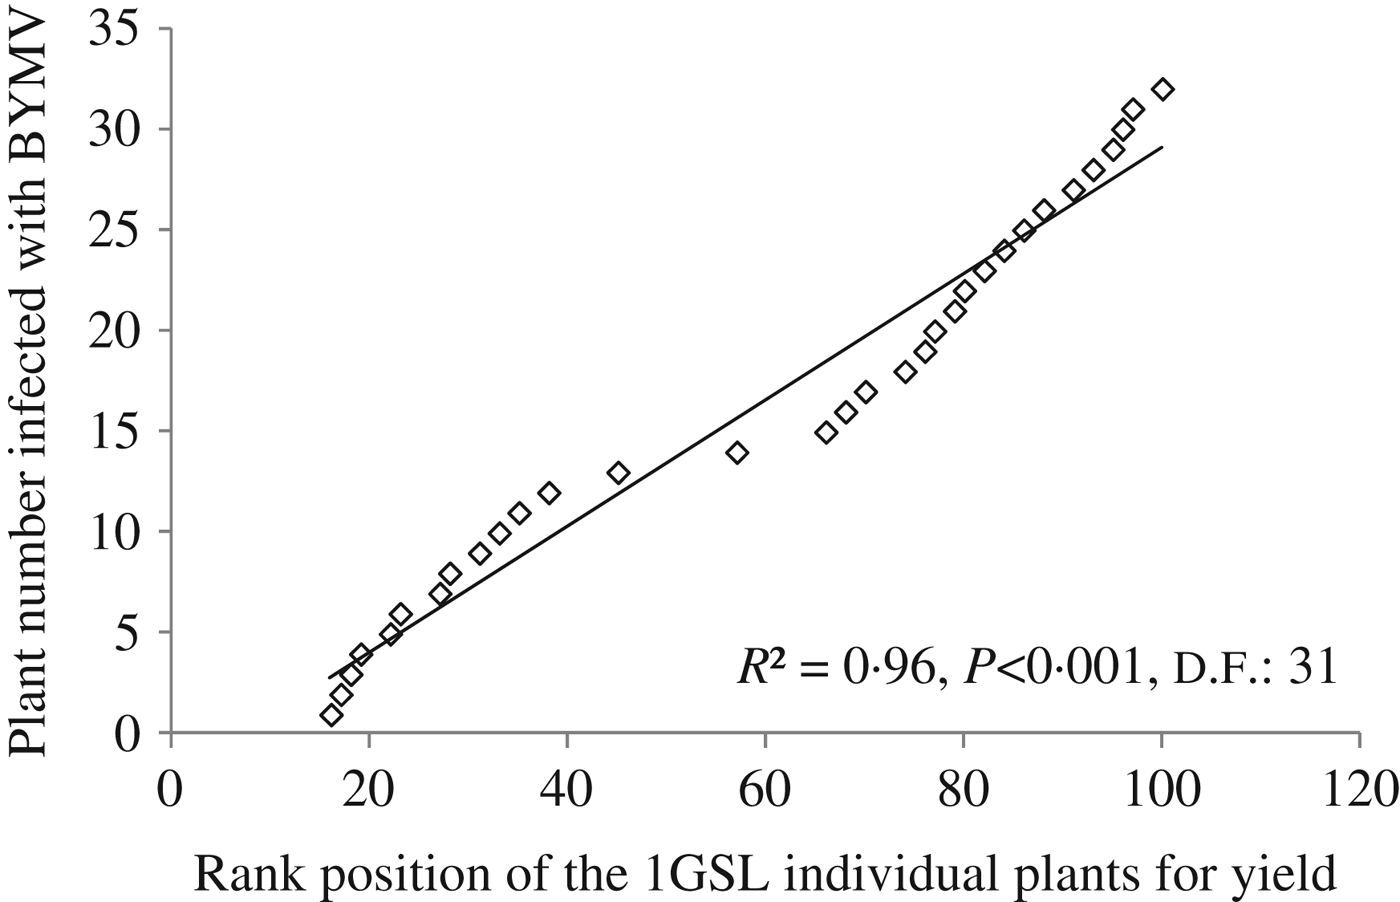
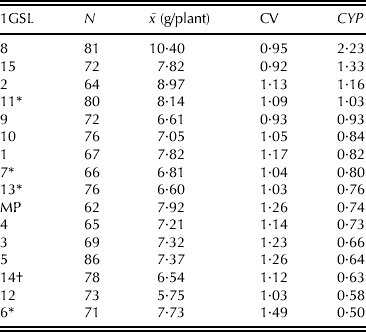
The mean grain yield, CV and CYP of the 1GSLs evaluated during 2007/08 are presented in Table 1. When ten seeds per 1GSL were sown in the greenhouse, no germination failure was recorded. In five out of the 15 1GSLs, viruses were detected in their progeny plants; BYMV in one plant each of lines 6, 7 and 11 but in two plants of line 13, while PSbMV was detected only in one progeny of line 14. The CV values of the single-plant yields of the 1GSLs ranged from 0·92 (line 15) to 1·49 (line 6) and averaged 1·10, whereas the CV value of the MP was 1·26. The mean grain yield varied from 5·75 g/plant (line 12) to 10·4 g/plant (line 8) corresponding to 73–131% yield relevant to that of the MP (7·92 g/plant); due to high standard deviations none of the 1GSLs differed significantly from the MP. The highest CYP value was obtained by the 1GSL coded 8 (2·23), followed by 1GSLs coded 15 (1·33) and 2 (1·16). Applying the first selection criterion, three plants from each of these three lines were selected because they scored the highest within the line PYP values (ranging from 9·82 to 102) and formed the nine 2GSLs (Table 2). On the second selection condition, the plant with the highest yield (i.e. 32·5–55·1 g) within each of the above lines was also selected. Finally, when the absolute yield was the selection criterion, the three plants with the highest yields (46·3–56·1 g) were selected to form the last 2GSLs; they originated from entries with intermediate CYP values (lines 1 and 9) and from the line with the lowest CYP (line 6). When leaf tissues from the 15 selected plants were tested for virus presence, BYMV was detected in the mother plants of 2GSLs 15-7 and 2-8 and AMV in those selected from lines 15-6 and 2-9. When the 100 highest-yielding plants were tested for virus presence, a significant positive linear correlation (r=0·96, P<0·001) between the number of the selected 1CSP plants and the number of BYMV-infected plants was recorded (Fig. 3).
The relationship between the selection intensity for individual plants of the highest yield (i.e. their rank position) under ultra-low density and the presence of BYMV infected plants.
Number of harvested plants (n), mean grain yield ($\bar x$), CV and relative CYP of the 1GSLs in descending order based on CYP
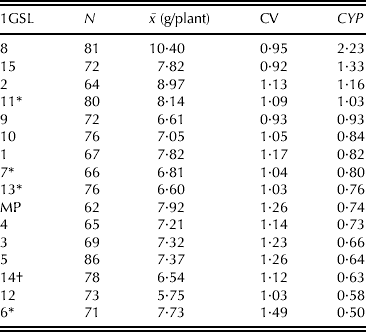
* Presence of BYMV in the progeny plants.
† Presence of PSbMV in the progeny plants.
The plants selected from the 1GSLs to form the 2GSLs: within the 1GSL with the highest CYP value those with the highest relative plant yield potential (i) or highest absolute yield (ii), and those with the highest yield regardless of the line (iii). The code of the respective 2GSL and virus infection of the mother plant is also presented
* Infected by BYMV.
† Infected by AMV.
Second generation sister-line evaluation and third generation sister-line selection at the ultra-low density
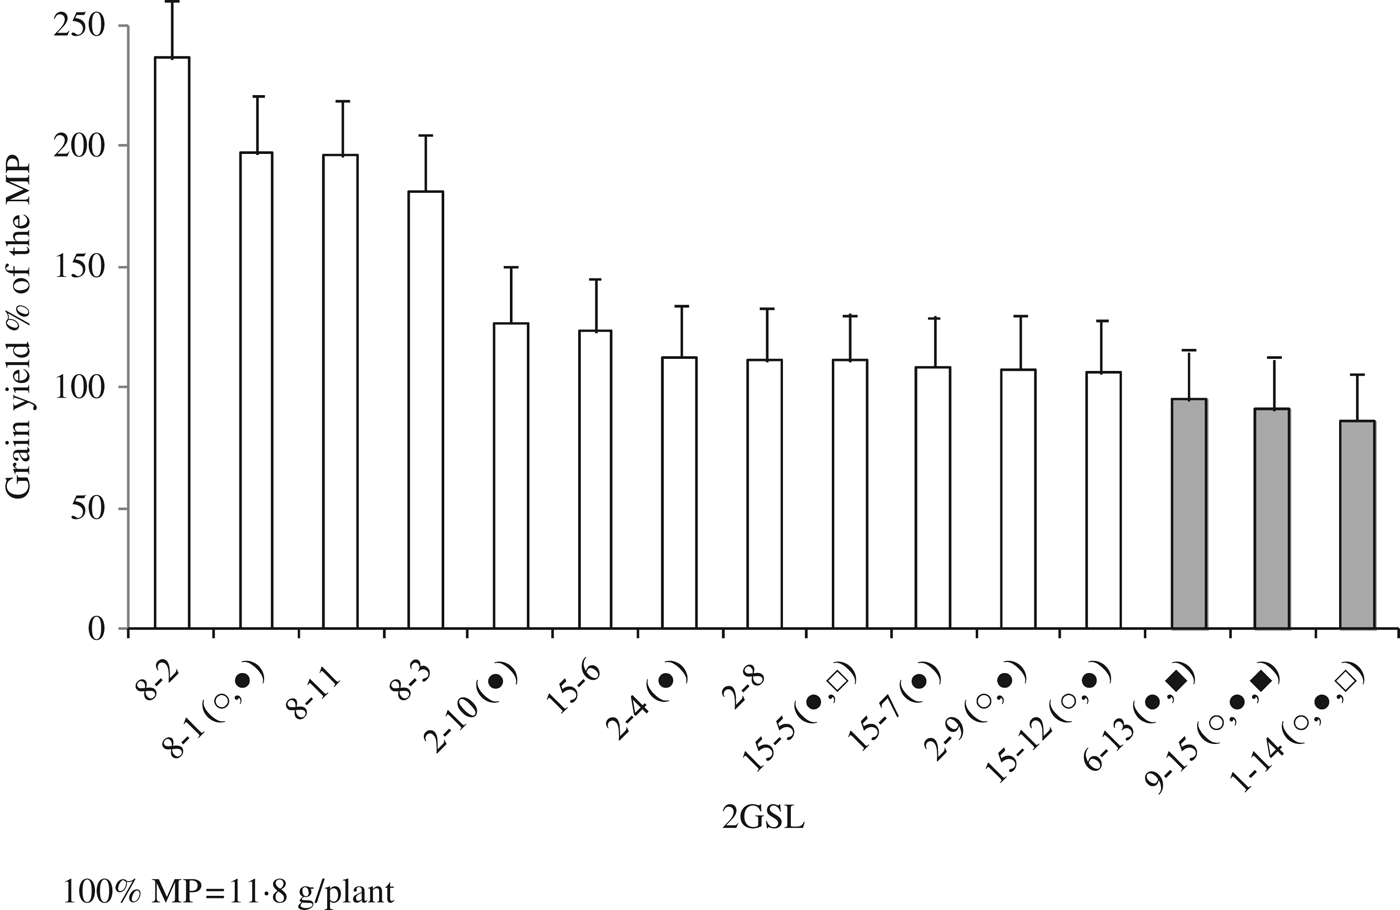
When plants originating from seed from lines 2-8 and 15-7 (whose mother plant was infected with BYMV) and lines 2-9 and 15-6 (whose mother plant was infected with AMV) were tested by ELISA, no infection and therefore no seed virus transmission was detected. In the 2008/09 field trials, all the plants of the 2GSLs and 0·62 of the MP plants survived. Grain yield of the 2GSLs ranged from 10·2 to 27·9 g/plant, while that of the MP was 11·8 g/plant. The performance of the 2GSLs is presented in Fig. 4 as a percentage (%) of the mean yield of the MP. The four highest-yielding lines came from the 1GSL coded 8 (i.e. 8-2, 8-1, 8-11, 8-3) and were significantly superior (by 81–136%) relative to the control (P<0·05). On the other hand, the three lowest yielding 2GSLs coded 6-13, 9-15 and 1-14 lagged behind the MP by 5, 9 and 13%, respectively. The MP had a CV value of 1·51, while average CV value for the 2GSLs was 1·33, ranging from 0·84 (line 8-2) to 1·75 (9-15). A strong negative linear correlation between yield per plant and CV value was found (r=−0·92, P<0·001). During the experiment, 83 out of the 1500 1GSL plants showed severe virus-like symptoms. Analysis of those plants by ELISA revealed an increased BLRV presence; only four lines (8-2, 8-11, 8-3, 15-6 and 2-8) escaped infection. Additional viruses were only detected in plants of a few lines and included PEMV (in lines 8-1, 2-9, 15-12, 9-15 and 1-14), BYMV (in lines 15-5 and 1-14) and CMV (in lines 6-13 and 9-15). All four viruses were also detected in several plants of the MP. Six individual plants from each of the lines 8-2 and 15-6 that scored the top CYP values among the 2GDSLs of different origin were selected for their highest PYP values and formed the 3GSLs.
The yield performance of the 2GSLs at the ultra-low density of 1·2 plants/m2 expressed as percentage of the yield of the MP. White columns correspond to lines obtained from single plants selected within 1GSLs of high CYP and dark columns correspond to lines derived from single plants selected based on their yield. (○, ●, □, ■, lines of which plants tested with ELISA were positive for PEMV, BLRV, BYMV and CMV; the bar on each column indicates the respective s.e.d. with the control value).
Third generation sister-line evaluation at the ultra-low density
No seed-borne infection was detected in plants produced in a greenhouse by seeds from the 3GSLs. During 2010/11, the mean yield of the six 3GSLs originating from the 2GSL 8-2 was 61% higher than that of the MP (10·3 g/plant) and their CV was 0·63 v. 0·79 of the control (results not shown). No significant difference was recorded among the yields of these lines (15·0–17·7 g/plant). The six plants originating from the 15-6 3GSLs averaged 28% higher yield than MP, ranging from 11·8 to 15·1 g/plant but did not differ significantly between them, while they averaged a CV of 0·74. Similar to the 2GSLs, the linear correlation between yield per plant and CV value was negative (r=−0·82, P<0·001).
Yield performance under commercial planting density conditions
When selections were evaluated under commercial planting density conditions, significant (P<0·05) genotype main effects were recorded for the yield of the 2GSLs, but not for the yield of the 1GSLs (results not shown). The 1GSLs yielded from 2255 (line 2) to 3000 kg/ha (line 5) and averaged 5·6% higher yield in comparison with the control MP (2550 kg/ha). Two 1GSLs (5 and 15) yielded c. 17% more than the MP. The 2GSLs yield averaged 9·4% higher compared with the MP (1842 kg/ha) and varied from 1771 (line 2-9) to 2258 kg/ha (line 8-1). Lines 8-1 and 15-12 were significantly superior to the MP by 23% (P<0·05). The average yield of the four 8- 2GSLs was significantly higher than the MP yield (by 17%), while the respective values for 15- and 2- 2GSLs were 12 and 2·6% higher (P<0·05). The three 2GSLs chosen based on the third selection condition (i.e. absolute high yield regardless of the origin) yielded 3·7 (line 1-14), 1·3 (line 6-13) and 9·5% (line 9-15) higher than the MP yield with the respective values for their 1GSL ancestors being 4·4, 9·7 and 7·5%.
DISCUSSION
In the present study, a Greek lentil landrace was bred using the honeycomb methodology and the results were additionally evaluated with respect to the viruses involved and the health status of the seeds produced. Three selection rounds led to lines that showed considerable improvement for yield production. Water stress due to low rainfalls in April 2007 during the flowering and seed formation stage possibly caused the very low mean grain yield of the source population in the first year compared with that in subsequent years when it was used as a control (i.e. 3·35 v. 7·92–11·8 g/plant).
A consistently wide range of single-plant yields and extremely high CVs were observed, particularly in the case of the source population and the 1GSLs and 2GSLs (CV>1·0), but less for the 3GSLs. Coefficient of variation values in the absence of competition measure the vulnerability of a genotype to environmental pressure (Tokatlidis et al. Reference Tokatlidis, Xynias, Tsialtas and Papadopoulos2006; Fasoula & Tokatlidis Reference Fasoula and Tokatlidis2012). In the present experiment, the presence of aphid-transmitted diseases PSbMV, BYMV and BLRV appeared to have been the most prominent external factor affecting lentil performance. Ultra-low densities favour insect landing and although may not favour aphid plant-to-plant movement, primary infections originating from outside sources are increased significantly (Jones Reference Jones2004). Hence, high plant-to-plant variability is expected, because infected lentil plants exhibit either symptoms of reduced plant growth or decreased yield (Kumari et al. Reference Kumari, Larsen, Makkouk, Bashir, Erskine, Muehlbauer, Sarker and Sharma2009). Therefore, under those conditions phenotypic screening and breeding for high yield is expected to ultimately select for tolerant genotypes. In the present study this hypothesis is supported by: (1) the positive correlation between the selection intensity, expressed as the rank position of the plants according to their yield, and the number of infected plants included in the selection sample; (2) the fact that among the 15 selected 1GSL plants, none of the seven plants exceeding a yield of 29·9 g was infected; and (c) the analysis of the 15 2GSLs (except line 8-1) showing that the mean yield of a line decreases as the number of the viruses present increases. Late infections usually result in attenuated or no symptoms and reduced yield effect; this can explain the presence of 2GSL line 8-1 among the selections with the highest yields.
Although the methodology applied in the present study may be efficient for the identification of virus-tolerant genotypes, the absence of uniform virus inoculums throughout the experimentation may have prevented the identification of possible tolerant/resistant genotypes. Through each selection cycle, depending on the viruses that spread in the field and originated either from the seeds or neighbouring crops, some genotypes could be identified for further investigation. In the case of PSbMV affecting the source material, the most promising genotypes were the 8- and 15- 2GSLs that were regarded as tolerant to infection and resulted in the highest yields at the commercial planting density; those two were selected on the basis of high CYP and PYP values. Lines 8-2, 8-11, 8-3, 15-6 and 2-8 escaping BRLV infection may also be further tested for possible BLRV resistance or tolerance.
The use of virus-free seeds is of major importance for legumes, therefore a great effort is made to eliminate viruses from germplasm collections (Hampton et al. Reference Hampton, Kraft and Muehlbauer1993). Infected seeds constitute the primary source of PSbMV for an efficient spread by numerous transient aphid species, resulting in extreme losses when plants are infected at the pre-flowering stage (Coutts et al. Reference Coutts, Prince and Jones2009). In the present study 0·12 of the MP seeds were infected by PSbMV, while additional defects were recorded as germination failure (0·08). Although no virus test was performed during the evaluation of the source material, PSbMV was expected to have been involved in the widespread disease observed. However, after a selection round, PSbMV was detected in only one plant of the 1GSLs and eliminated afterwards. This elimination can have a great effect on the spread of the virus, yield losses and further seed infection (Coutts et al. Reference Coutts, Prince and Jones2008, Reference Coutts, Prince and Jones2009), but also may prevent the loss of genetic resources and diversity (Hampton et al. Reference Hampton, Kraft and Muehlbauer1993). In the same way, new viruses such as BYMV and AMV that were not present in the source material but probably originated from surrounding crops and invaded the seeds of the subsequent generations were also eliminated. The impact of the applied methodology is highlighted by the high correlation of the number of selected plants and those infected with BYMV within the 1GSLs. Lentil appeared to be one of the most susceptible legume species to BYMV (McKirdy et al. Reference McKirdy, Jones, Latham and Coutts2000), hence its elimination is of major importance. In general, early virus infections associated with increased seed-transmission result in severe symptoms and infected plants are excluded during phenotypic evaluation (Wang & Maule Reference Wang and Maule1994; Mabrouk & Mansour Reference Mabrouk and Mansour1998; Coutts et al. Reference Coutts, Prince and Jones2009).
Improved yield performance in addition to virus removal was also recorded in the successive generations. When compared with the MP at ultra-low density, the 1GSLs averaged similar yields, whereas the 2GSLs and the 3GSLs yielded 33 and 45% higher, respectively. At the commercial planting density, 5·6 and 9·4% more yield in comparison with the MP was recorded for the 1GSLs and 2GSL, respectively. Lower average CV values of successive generations against MP are suggestive of either narrower genetic variation or less environmental influence. The last impact supports the concept of virus elimination, while the negative correlation of mean yield of the 2GSL and 3GSL with the respective CVs also supports this.
From the breeding perspective, it seems that the applied selection resulted in considerable yield per plant improvement, which was stabilized after two selection cycles. Repeated rounds of selection are justified by the response to selection within the 1GSLs observed in the present study, as well as in previous studies (Tokatlidis et al. Reference Tokatlidis, Xynias, Tsialtas and Papadopoulos2006, Reference Tokatlidis, Tsikrikoni, Tsialtas, Lithourgidis and Bebeli2008); moreover, mechanisms of constant genome reorganization might develop new genetic variation, rendering non-stop selection within a variety a sound choice (Tokatlidis et al. Reference Tokatlidis, Xynias, Tsialtas and Papadopoulos2006, Reference Tokatlidis, Tsikrikoni, Tsialtas, Lithourgidis and Bebeli2008; Fasoula & Boerma Reference Fasoula and Boerma2007; Fasoula Reference Fasoula2012). Any 1GSL, even line 8 with 31% higher yield, failed to be statistically superior to the MP on account of the high standard deviations. However, compared with the MP the four second generation progenies of the line 8 averaged 102% and the six third generation progenies of the line 8-2 averaged 61% higher yield. This was most likely to be a combined result of a genetic yield improvement and virus removal. Yield improvement at the single-plant level was later supported by yield per unit area at the commercial planting density. Compared with the MP the four 8- originating 2GSLs managed to average 17% significantly higher yield and the 2GSL coded 15-12 gave 23% higher yield. The 9·5% higher yield of the line 9-15 should not be overlooked, either. All these results suggest successful exploitation of the intra-landrace variation. The honeycomb methodology, thanks to an even and systematic entry arrangement, tackles the huge environmental heterogeneity caused by a particular stress and exploits the genetic variability of the source material to successfully breed against such a stress (Fasoula & Tokatlidis Reference Fasoula and Tokatlidis2012). Presumably, a study based on a more than a single-base variety would be more convincing. Nevertheless, successful selection at ultra-low density has been reported within either similar landraces of common bean (Phaseolus vulgaris) (Tokatlidis et al. Reference Tokatlidis, Papadopoulos, Baxevanos and Koutika2010) or even of varieties of soybean [Glycine max (L) Merr.] (Fasoula & Boerma Reference Fasoula and Boerma2007), wheat (Triticum aestivum L.) (Tokatlidis et al. Reference Tokatlidis, Xynias, Tsialtas and Papadopoulos2006) and cotton (Gossypium hirsutum L.) (Tokatlidis et al. Reference Tokatlidis, Tsikrikoni, Tsialtas, Lithourgidis and Bebeli2008; Fasoula Reference Fasoula2012) with narrower genetic bases.
In terms of the selection procedure as a means of eliminating the virus load and advancing yield, some implications deserve further discussion. The CYP value is apparently a useful tool to evaluate the progeny lines and subsequently select within the top ones; the 1GSL coded 8 that scored the highest CYP values produced 2GSLs and 3GSLs of exceptional performance, whereas line 15, despite lower yields than the MP, was nevertheless selected based on its high CYP and ultimately also led to successful 2GSLs and 3GSLs. This finding highlights the importance of the second component of the CYP equation, i.e. the coefficient of homeostasis, which in fact is representative of the adverse value of the CV. Beyond yield capacity the CYP value also reflects the vulnerability of a genotype to environmental pressure including any stress in question. Line 9, with a relatively low CV, gave consistently high yield at a commercial planting density in contrast to lines 2 and 6 with high CVs. In other words, a high-yielding plant belonging to a line with high CV and low CYP was likely to be tolerant of virus infection but belong to a genotype vulnerable to environmental fluctuations. In previous studies, the CYP as an entry selection criterion was found to match the agronomic concept of stability in dry bean genotypes (Papadopoulos & Tokatlidis Reference Papadopoulos and Tokatlidis2011) and successfully assess maize (Zea mays L.) hybrids that more effectively exploit resources (Tokatlidis et al. Reference Tokatlidis, Has, Melidis, Has, Mylonas, Evgenidis, Copandean, Ninou and Fasoula2011) or evaluate lentil varieties for cultivation under organic conditions (Vlachostergios et al. Reference Vlachostergios, Lithourgidis and Roupakias2011). Taken into consideration the selection criteria applied it seems that, whether genotypes tolerant to viruses are targeted or not, it is preferable to select for the absolute highest yield rather than PYP within the top-scoring for the CYP value lines. This is supported by lines 2-10 and 15-12, selected for absolute yield, which were in the end the best among the respective groups at the dense stand.
In conclusion, the honeycomb methodology appeared to be very promising for effective single-plant screening to rank genotypes for improved yield and response to virus presence. The application of CYP as the line selection criterion is suggested, followed by selection of the highest-yielding plants within the top-scoring lines for CYP. Particular emphasis should be given to the second component of the CYP equation, i.e. the coefficient of homeostasis, which reflects lower vulnerability of a genotype to environmental pressure.
The authors acknowledge AGROKIPIO SA (Lepti Orestiadas, Greece) for providing the seed stock used for the experimentation. This research was co-financed by the European Union (European Social Fund) and Greek national funds in the framework of the project ‘THALIS – Democritus University of Thrace – Selection for enhanced yield and tolerance to viral and vascular diseases within lentil landraces’ through the Operational Programme of the NSRF (National Strategic Reference Framework) ‘Education and lifelong learning-investing in knowledge society’.