I. INTRODUCTION
Undercooling is one of the key parameters in solidification processes of metals. Reference Perepezko, Sebright, Höckel and Wilde1–Reference Kinyanjui, Lehman, Zavalij and Cotts3 Large undercooling is in favor of obtaining refined solidification microstructure and as a result, excellent properties of the materials can be anticipated. Reference Cai, Ma, Liu, Zhang and Hu4,Reference Xu, Wang and Wei5 In addition, materials with different structures, such as quasicrystalline Reference Singh, Somekawa and Tsai6 and amorphous phase, Reference Long, Chapman, Chupas, Bendersky, Levine, Mompiou, Stalick and Cahn7 can be produced by deep undercooling methods. However, the unexpected existed impurities may hinder obtaining large undercooling and also lead to irreproducible results. Fortunately, the entrained droplet technique that has been widely utilized since 1980s Reference Boswell and Chadwick8–Reference Goswami and Chattopadhyay10 solved this problem satisfactorily. By selecting a binary immiscible alloy in which the two components have different melting points, nanosized droplets with low melting temperature can be embedded in a matrix with high melting temperature by melt-spun Reference Mu, Zhu, Zhang, Fu, Wang, Li and Hu11–Reference Kim and Cantor14 or ball milling methods. Reference Sun, Wu, Chang, Chin and Huang15 The external impurities were segregated into a little of droplets and the overwhelming majority of droplets are thought to be pure even under some heating–cooling cycles attributing to the protection of surrounding matrix. As a result, reproducible undercooling can be expected. Reference Zhang and Cantor13,Reference Kim and Cantor14 However, this logical conclusion is short of sufficient experimental data to be well demonstrated due to the limitation of low scanning rate of conventional differential scanning calorimetry (DSC).
In general, cooling rate and droplet size are two critical factors that influence the degree of accessible undercooling. Numerous studies have been conducted to reveal their effects and the internal mechanisms by experiments and theoretical analysis. Mueller and Perepezko Reference Mueller and Perepezko16 found the influence of cooling rate and droplet size on attainable undercooling of pure Al droplets and established the preliminary theoretical expression. Furthermore, our previous study Reference Guan, Gao, Zhai and Xu17,Reference Guan, Gao, Zhai and Xu18 also compared the effect of cooling rate and droplet size on the undercooling during the solidification process of microsized Al droplets by DSC. It was found that undercooling increased with the decrease in droplet size and the increase in cooling rate. In addition, we found that the change trend of undercooling decreased with increasing cooling rate, but increased significantly when the droplet size was below 20 μm. Reference Guan, Gao, Zhai and Xu17 Sheng et al. Reference Sheng, Lu and Ma19 studied the solidification behavior of nanosized In, Sn, Bi, Cd, and Pb droplets embedded in the Al matrix and also found that the degree of undercooling increased with decreasing droplet size. However, the cooling rate of conventional DSC is only several Kelvin per second Reference Pijpers, Mathot, Goderis, Scherrenberg and van der Vegte20 and the related studies on droplet size down to nanoscale at high cooling rates are seldom involved.
Nanocalorimetry, as a promising method to investigate the melting and solidification behavior of small sample which is far from equilibrium state, has aroused extensive attention since 1990s. Reference Lai, Guo, Petrova, Ramanath and Allen21–Reference Swaminathan, LaVan and Weihs23 With the development of microelectromechanical systems (MEMS), the newly developed differential fast scanning calorimetry (DFSC) is able to capture the thermal change less than nanojoule while its scanning rate can be up to 106 K/s. Reference Zhuravlev and Schick24 Based on the novel DFSC technique, in our previous studies, the rapid solidification behavior of single microsized metallic droplet, such as Sn, Reference Yang, Abyzov, Zhuravlev, Gao, Schmelzer and Schick25,Reference Zhao, Li, Zhai and Gao26 Sn3.5Ag, Reference Zhao, Zhao, Zhang, Yang, Zhai, Schick and Gao27 SnAgCu, Reference Gao, Zhuravlev, Zou, Yang, Zhai and Schick28 and the corresponding solidification microstructures of those specimens after DFSC measurements have been studied successfully. Reference Zhao, Li, Zhai and Gao29 Recently, we have published a review article to systematically introduce the application of nanocalorimetry in phase transitions and nucleation mechanisms in metallic materials. Reference Zhao, Li, Lu, Zhai, Yang, Schick and Gao30
In this article, Zn and Bi, which have extremely low solid solubility, are selected to prepare Zn–Bi alloys in which nanosized Bi droplets are embedded in the Zn matrix. The effect of cooling rate on undercooling of the different Bi droplets is studied by DFSC. Besides, the reproducibility of undercooling of the microsized and nanosized Bi droplets is also focused to display the advantage of the entrained droplet technique.
II. EXPERIMENTAL
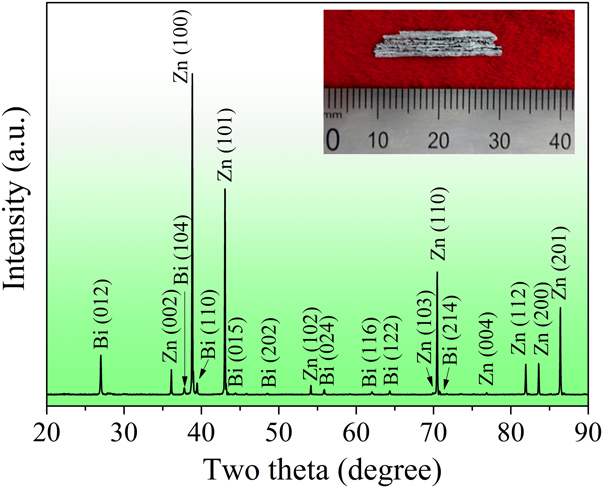
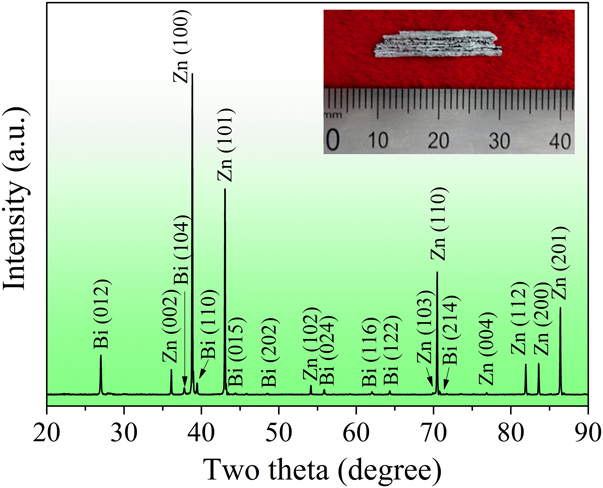
The alloy ingots with a nominal composition of Zn–10Bi (wt%) were prepared from Zn (purity, 99.999 wt%) and Bi (purity, 99.999 wt%) by melting using a vacuum electric arc furnace under a protective argon atmosphere. The ingots obtained were then remelted and rapidly solidified into ribbons using a single roller melt-spinning method. Continuous melt-spun ribbons with a cross-section of (0.04–0.06) mm × 5 mm were produced, as shown in the inset of Fig. 1.
XRD pattern of the Zn–10Bi ribbons and the inset shows the image of the ribbon.
The phase constitution of the rapidly solidified Zn–10Bi melt spun ribbons was examined by x-ray diffraction (XRD) in the 2θ range of 20–90° at a scanning rate of 2° min−1 using an x-ray diffractometer (D/Max-2500, Rigaku, Japan) with Cu Kα radiation (λ = 0.154056 nm). The morphology of the ribbons was characterized by scanning electron microscopy (SEM, JSM-6700F, JEOL, Japan) under backscattered electron (BSE) mode. The elemental identification was conducted by energy dispersive x-ray spectroscopy (EDS, INCA, Oxford, UK) equipped with SEM. Differential scanning calorimeter (DSC, Diamond, PerkinElmer Instruments) was used to measure the melting and solidification temperature of Bi droplets in the ribbons under the protection of flowing high-purity nitrogen. The DSC measurement was performed on the Zn–10Bi ribbons (about 7.3 mg) at a scanning rate of 9 K/min from 343 to 573 K.
Differential fast scanning calorimeter (DFSC, Spark III, Functional Materials Rostock e.V., Germany) with XI 39395 thin-film sensor (Xensor Integrations, Netherlands) was used for nanocalorimetric measurements in an argon atmosphere. The principle of the measurement has been discussed in Ref. Reference Gao, Zhuravlev, Zou, Yang, Zhai and Schick28. The Zn–10Bi specimen was scraped from the ribbons and carefully positioned in the center of measuring zone of the sensor with the help of stereomicroscopy (Stemi 2000-C, Carl Zeiss, Germany). Then the specimen was heated from 320 to 600 K, held for 0.1 s, and cooled down to 320 K in the scanning rate range of 300–6000 K/s. Here, if the specimen is tested at a certain scanning rate, it means that the heating and cooling rates are the same. It should be pointed out that at the highest experimental setup temperature, i.e., 600 K, the Zn matrix kept solid-state while the Bi droplets would melt. The heating–cooling cycles were repeated 10 times for each scanning rate to acquire enough undercooling data and check its reproducibility.
III. RESULTS AND DISCUSSION
Figure 1 shows the XRD pattern of the Zn–10Bi ribbons. The result demonstrates that the ribbons consist of hexagonal Zn phase (JCPDS No. 87-0713) and rhombohedral Bi phase (JCPDS No. 85-1331), without detecting any other phases. In particular, there are no evident shifts of Zn and Bi diffraction peaks in present results comparing with the diffraction peaks of pure Zn and Bi, which imply that no obvious mutual dissolving.
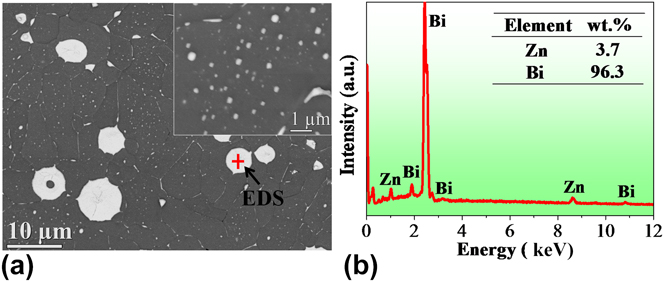
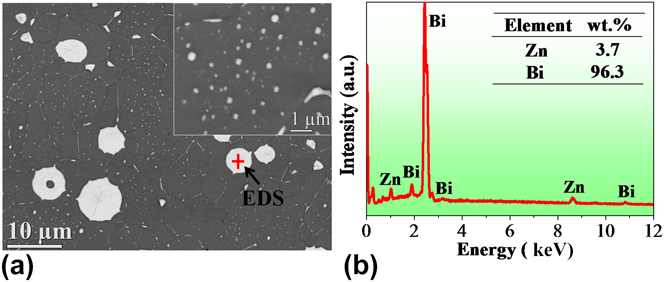
Figure 2(a) displays the morphology of the Zn–10Bi ribbons. From the BSE image, the white Bi and the dark Zn matrix can be clearly distinguished. Furthermore, it can be found that the larger Bi droplets that are in microsize are distributed at the grain boundaries of Zn, while the smaller Bi droplets ranging from dozens to hundreds of nanometers are embedded in the Zn grains as shown in the inset of Fig. 2(a). Figure 2(b) shows the composition of a single Bi droplet indicated by the cross in Fig. 2(a).
(a) The BSE image of the melt spun Zn–10Bi ribbon, and the inset shows the morphology of the nanosized Bi droplets embedded in Zn matrix. (b) The EDS spectrum of the Bi droplet indicated by the cross in (a).
Cao et al. Reference Cao, Wei and Herlach31,Reference Cao, Herlach, Kolbe, Görler and Wei32 studied the phase separation process of the Co–Cu peritectic alloy which showed a metastable miscibility gap in the undercooled liquid state and found that rapid cooling would restrain the coalescence of the minority phase. Schaffer et al. Reference Schaffer, Mathiesen and Arnberg33 focused on the motion of the Bi-rich liquid phase droplets during the solidification of hypermonotectic Al–Bi alloys and found that droplets with large radii were frequently pushed and small droplets were engulfed by the advancing solidification front. Goswami and Chattopadhyay Reference Goswami and Chattopadhyay34 confirmed the intermediate formation of a thermodynamically unstable solid solution in the rapid solidified Zn–Bi alloys. Taking their results into consideration, the formation of the microstructure of the Zn–10Bi ribbons in this work may be interpreted as follows. In the rapid solidification process of Zn–Bi alloy, when the monotectic reaction happened, namely liquid (L 1) → Zn + liquid (L 2), large liquid L 2 droplets were shoved by the advancing solidification front and the small L 2 droplets, however, were devoured in this process. Here, L 1 and L 2 are Zn-rich liquid phase and Bi-rich liquid phase in the Zn–Bi alloys, respectively. When the temperature is decreased to the eutectic point, the Bi droplets were formed, namely liquid (L 2) → Zn + Bi. In addition, the metastable solid solution that formed during the rapid quenching would spontaneously decompose to yield some smaller nanosized droplets.
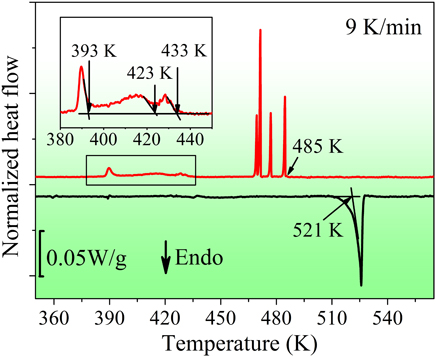
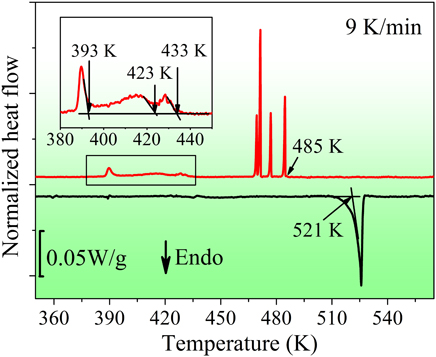
Figure 3 presents the DSC curves of the Zn–10Bi ribbons at a scanning rate of 9 K/min. In the heating process, an endothermic peak appears with the onset temperature of 521 K which is close to the bulk eutectic temperature of Zn–Bi alloys. This peak is attributed to the melting of the Bi droplets in the ribbons. In the cooling process, the first sharp exothermic peak occurs at 485 K, followed by several sharp exothermic peaks at lower temperatures. It is deemed that these peaks are attributed to the solidification of microsized Bi droplets at the grain boundaries. These microsized Bi droplets are nucleated by the catalytic effect of the Zn grain boundaries and show different undercooling due to the different catalytic potencies of different heterogeneous nucleation sites or/and different sizes. As the temperature decreases, three small exothermic peaks occur with the onset solidification temperatures of about 433, 423, and 393 K, respectively. These peaks correspond to the solidification of the embedded Bi droplets in the Zn grains. The large number of the embedded Bi droplets nucleate in the cooling process due to the catalytic effects of the surrounding Zn matrix, and demand different undercooling by the reason of different sizes of the droplets.
The DSC curves of the as-prepared Zn–10Bi ribbons at a scanning rate of 9 K/min. The inset shows the enlarged part of the exothermic peaks at lower temperature and the determination of the onset solidification temperatures.
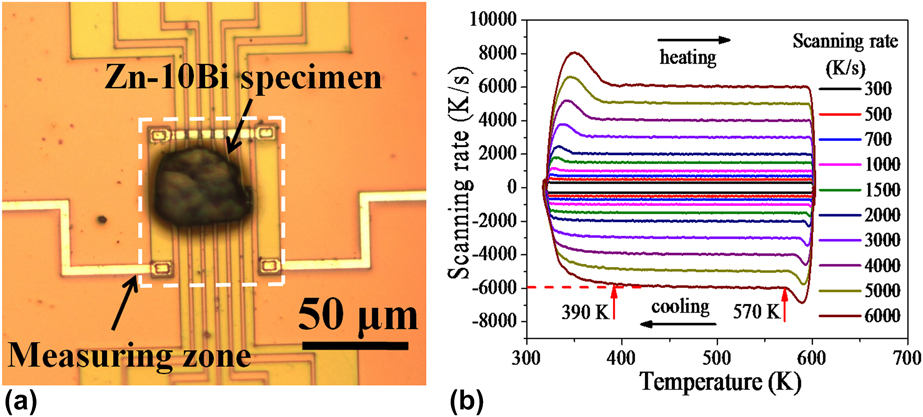
The optical microscopic image of the DFSC sensor with the Zn–10Bi specimen is shown in Fig. 4(a). The DFSC specimen is located in the center of the measuring zone to avoid the large temperature gradient outside this area. Reference Zhuravlev and Schick24 Figure 4(b) presents the different scanning rates during the measurements. It can be found that a controllable temperature range covers the melting temperature of the Bi droplets for each scanning rate. It should be noticed that the DFSC specimen is tested in nonadiabatic condition and the maximum cooling rate was limited by several factors such as the cooling agent, i.e., argon atmosphere in this work, and the properties of the specimen, e.g., sample size. The scanning rate performance is determined in Fig. 4(b), indicating that the maximum cooling rate at 6000 K/s is controllable in the temperature range of 570–390 K.
(a) The optical microscope image of the sensor with the Zn–10Bi specimen used for DFSC tests. (b) Scanning rate determination of the Zn–10Bi specimen by DFSC, indicating a controllable cooling rate of 6000 K/s in the temperature range of 570–390 K.
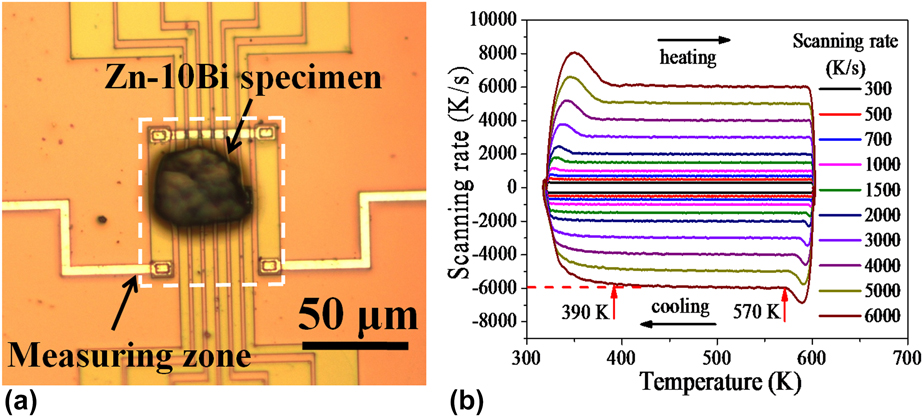
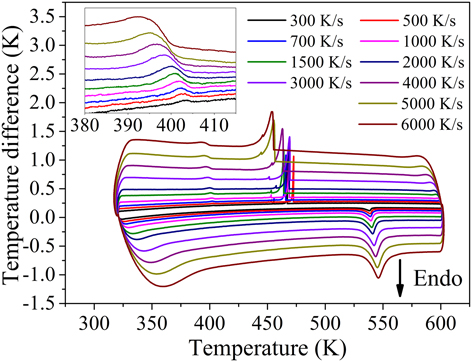
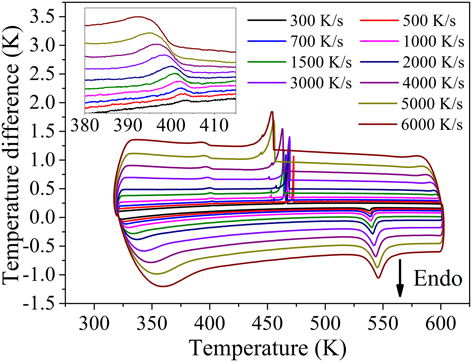
Figure 5 displays the typical DFSC curves of the Zn–10Bi specimen at different scanning rates. Taking the curve at 300 K/s for example, in the heating process, an endothermic peak occurs with the onset melting temperature of 530 K. This peak is attributed to the melting of Bi droplets which distributed at the grain boundaries and embedded in the Zn grains. With the increase in the heating rate, the endothermic peak shifts to higher temperature because of the thermal lag. In the cooling process, it can be observed that the Bi droplets solidified at two different undercooling levels. The first exothermic peak occurs at 468 K, followed by a small sharp exothermic peak. Due to the largely reduced size of DFSC specimen, there are only several microsized Bi droplets in the specimen contributed to the two sharp exothermic peaks. It can be found that the solidification temperatures of the microsized Bi droplets in DFSC curves are much lower than that of the DSC result. It deems that this is mainly because the higher cooling rate compared with that of the DSC measurement decreases the solidification temperature. When the temperature decreases to 405 K, a small exothermic peak which corresponds to the solidification of numerous nanosized Bi droplets embedded in the Zn matrix occurs. The enlarged part of these peaks is shown in the inset of Fig. 5. Similar to the endothermic peaks, these small exothermic peaks shift to the lower temperature with increasing cooling rate.
DFSC curves of the Zn–10Bi specimen at different scanning rates, and the inset shows the details of the partially enlarged solidification peaks occurred at lower temperature.
Because of the extended thermal lag at high scanning rates, the characteristic temperature including the onset melting and the onset solidification temperature obtained in DFSC curves should be corrected. The detailed procedure has been discussed in Ref. Reference Gao, Zhuravlev, Zou, Yang, Zhai and Schick28. Then, the undercooling (∆T) corresponding to different exothermic peaks can be calculated by the corrected characteristic temperature with ∆T = T m − T s. Here, T m is the onset melting temperature and T s is the onset solidification temperature. It should be noticed that for microsized Bi droplets, we only take the first sharp exothermic peak in the cooling process at each scanning rate into consideration. This data treatment is due to its large peak area compared with the smaller sharp one and it can represent the solidification of the major microsized Bi droplets.
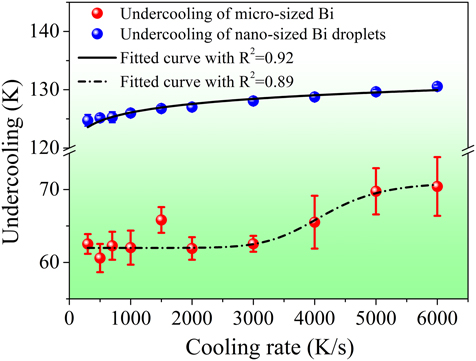
Figure 6 displays the calculated undercooling at different cooling rates. Compared with the relatively large scattered undercooling of microsized Bi droplets at each cooling rate, it can be clearly seen the undercooling for the solidification of the nanosized embedded Bi droplets is more concentrated. This result demonstrates one of the big advantages of the entrained droplet technique, i.e., the good reproducible measured data can be obtained. The reason is that each nanosized Bi droplets proceed an independent nucleation event, and the exothermic peak which corresponds to the solidification of numerous nanosized Bi droplets actually represents the cumulative superposition of all nucleation events. So the exothermic peaks in 10 times measurements at a fixed cooling rate are reproducible and then the calculated undercooling is highly concentrated. However, the large scattered undercooling of a few of microsized Bi droplets in the sample could be well addressed by the stochastic nature of the nucleation event and as a result, the positions of the corresponding exothermic peaks were changed in different heating and cooling cycles. Another big difference lies in the different cooling rate dependences of the undercooling of the microsized and nanosized Bi droplets. For the latter one, the undercooling increases gradually from 125 to 130 K with increasing cooling rate from 300 to 6000 K/s but the change trend decreases simultaneously. However, the undercooling evolution for microsized Bi droplets is more complex. The undercooling almost keeps stable when the cooling rate is lower than 2000 K/s and then there is an obvious increase at cooling rates with increasing cooling rate up to 6000 K/s.
Cooling rate dependence of undercooling of the microsized and nanosized Bi droplets in the Zn–10Bi specimen. Note that each point is the average value of 10 identical measurements and the error bars are the standard error of 10 identical measurements for each cooling rate.
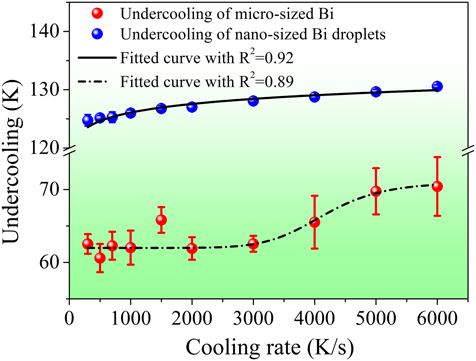
In our previous study, Reference Guan, Gao, Zhai and Xu18 it is found that the increase in cooling rate would result in a monotonous improving of undercooling, and the change trend would slow down as the cooling rate increases, which was consistent with the result of the embedded nanosized Bi droplets as shown in Fig. 6. However, it seems that the undercooling evolution of microsized Bi droplets cannot be interpreted by this rule due to the obvious increase in undercooling when cooling rate exceeds 2000 K/s. Based on DFSC measurements, the cooling rate dependence of undercooling of single microsized Sn droplets was studied and a shelf-like dependence of undercooling on the cooling rate was obtained. Reference Yang, Abyzov, Zhuravlev, Gao, Schmelzer and Schick25,Reference Yang, Gao, Zou, Zhai, Abyzov, Zhuravlev, Schmelzer and Schick35 Two different heterogeneous nucleation mechanisms dominated the nucleation process separately at different cooling rates but act simultaneously at the “crossover” cooling rates. For the microsized Bi droplets existed at the Zn grain boundaries, this process was similar. At the lower cooling rate, the Zn grain boundaries could be acted as the heterogeneous nucleation sites and the Bi droplets nucleated at the surface, which means that the surface-induced heterogeneous nucleation governs the nucleation process. On the contrary, when the cooling rate exceeds to a critical value, the Bi droplets could be promptly cooled and then the heterogeneous nucleation sites in the bulk of the droplets were activated. Thus the volume-induced heterogeneous nucleation occurs.
IV. CONCLUSIONS
In conclusion, the microsized Bi droplets distributed at the grain boundaries and nanosized Bi droplets embedded in the Zn matrix were obtained from the Zn–10Bi melt spun ribbons. In situ controllable cooling rate ranging from 300 to 6000 K/s was realized to study the cooling rate dependence of the undercooling based on DFSC. The results show the good reproducible undercooling of the embedded nanosized Bi droplets compared with that of microsized Bi droplets at the grain boundaries, which experimentally reflects the advantage of the entrained droplet technique. In addition, the undercooling of the nanosized Bi droplets increases gradually with increasing cooling rate but the change trend decreases simultaneously. However, for microsized Bi droplets, the undercooling evolution displays a sigmoidal relationship with the increase in cooling rate, implying its nucleation mode changing from surface-induced to volume-induced heterogeneous nucleation.
ACKNOWLEDGMENTS
The authors acknowledge the support from the Program for Professor of Special Appointment (Eastern Scholar) at Shanghai Institutions of Higher Learning (No. TP2014042); National Natural Science Foundation of China (51171105, 50971086); and the 085 project in Shanghai University.