

INTRODUCTION
The availability of ultra-short ultra-intense (USUI) laser pulses with peak intensities as high as 1021 Wcm−2 and contrast in excess of 108 (Liu et al., Reference Liu, Xie, Huang, Liu and Yu2009; McKenna et al., Reference McKenna, Carroll, Lundh, Nurnberg, Markey, Bandyopadhyay, Batani, Evans, Jafer, Kar, Neely, Pepler, Quinn, Redaelli, Roth, Wahlstrom, Yuan and Zepf2008; Limpouch et al., Reference Limpouch, Psikal, Andreev, Platonov and Kawata2008; Nickles et al., Reference Nickles, Ter-Avetisyan, Schnuerer, Sokollik, Sandner, Schreiber, Hilscher, Jahnke, Andreev and Tikhonchuk2007; Ter-Avetisyan et al., Reference Ter-Avetisyan, Schnurer, Polster, Nickles and Sandner2008; Karsch et al., Reference Karsch, Habs, Schatz, Schramm, Thirolf, Meyer-Ter-Vehn and Pukhov1999; Malka & Fritzler, Reference Malka and Fritzler2004; Koyama et al., Reference Koyama, Adachi, Miura, Kato, Masuda, Watanabe, Ogata and Tanimoto2006) makes possible the development of compact laser-driven ion accelerators (Malka et al., Reference Malka, Faure, Gauduel, Lefebvre, Rousse and Phuoc2008; Krushelnick et al., Reference Krushelnick, Najmudin and Dangor2007; Mangles et al., Reference Mangles, Walton, Najmudin, Dangor, Krushelnick, Malka, Manclossi, Lopes, Carias, Mendes and Dorchies2006). The resulting energetic ions have many important applications, ranging from medical proton therapy (Bulanov & Khoroshkov, Reference Bulanov and Khoroshkov2002), diagnostics for laser-plasma interaction (MacKinnon et al., Reference MacKinnon, Patel, Town, Edwards, Phillips, Lerner, Price, Hicks, Key, Hatchett, Wilks, Borghesi, Romagnani, Kar, Toncian, Pretzler, Willi, Koenig, Martinolli, Lepape, Benuzzi-Mounaix, Audebert, Gauthier, King, Snavely, Freeman and Boehlly2004), and fast ignition in inertial-confinement fusion (Roth et al., Reference Roth, Cowan, Key, Hatchett, Brown, Fountain, Johnson, Pennington, Snavely, Wilks, Yasuike, Ruhl, Pegoraro, Bulanov, Campbell, Perry and Powell2001). In most of these applications, energetic ions of sufficiently high energy and brightness are required.
Target normal sheath acceleration is one of the proposed schemes for ion acceleration (Wilks et al., Reference Wilks, Langdon, Cowan, Roth, Singh, Hatchett, Key, Pennington, Mackinnon and Snavely2001; Allen et al., Reference Allen, Sentoku, Audebert, Blazevic, Cowan, Fuchs, Gauthier, Geissel, Hegelich, Karsch, Morse, Patel and Roth2003; Mora, Reference Mora2003; Fuchs et al., Reference Fuchs, Antici, D'humières, Lefebvre, Borghesi, Brambrink, Cecchetti, Kaluza, Malka, Manclossi, Meyroneinc, Mora, Schreiber, Toncian, Pépin and Audebert2006). When an USUI laser pulse irradiates a solid foil, the relativistic electrons generated in the laser-plasma interaction can easily penetrate though the foil, and form an electron sheath on the rear side of the foil (Hegelich et al., Reference Hegelich, Albright, Cobble, Flippo, Letzring, Paffett, Ruhl, Schreiber, Schulze and Fernandez2006; Schwoerer et al., Reference Schwoerer, Pfotenhauer, Jackel, Amthor, Liesfeld, Ziegler, Sauerbrey, Ledingham and Esirkepov2006; Yin et al., Reference Yin, Yu, Yu, Lei, Yang, Xu and Senecha2008; Tian et al., Reference Tian, Yu, Lu, Xu, Senecha, Lei, Shen and Wang2008), and the resulting space-charge field then pulls out plasma ions in the back surface. The energetic ions thus generated can be accelerated to several MeV (Hatchett et al., Reference Hatchett, Brown, Cowan, Henry, Johnson, Key, Koch, Langdon, Lasinski, Lee, Mackinnon, Pennington, Perry, Phillips, Roth, Sangster, Singh, Snavely, Stoyer, Wilks and Yasuike2000; Snavely et al., Reference Snavely, Key, Hatchett, Cowan, Roth, Phillips, Stoyer, Henry, Sangster, Singh, Wilks, Mackinnon, Offenberger, Pennington, Yasuike, Langdon, Lasinski, Johnson, Perry and Campbell2000; Zepf et al., Reference Zepf, Clark, Beg, Clarke, Dangor, Gopal, Krushelnick, Norreys, Tatarakis, Wagner and Wei2003; Spencer et al., Reference Spencer, Ledingham, Mckenna, Mccanny, Singha, Foster, Neely, Langley, Divall, Hooker, Clarke, Norreys, Clark, Krushelnick and Davies2003), but their density is rather low, usually <0.001 of the critical density.
In order to generate an energetic ion bunch of high density, the interaction of an USUI laser pulse with a small, dense plasma pellet was proposed (Yu et al., Reference Yu, Xu, He, Yu, Ishiguro, Zhang and Wong2005). In this scheme, a micrometer-sized plasma pellet is directly accelerated by a laser pulse of intensity exceeding 1021 Wcm−2 and densities exceeding 100 times the critical density (1023 cm−3) can be achieved, with the total ion number in the plasma pellet above 1011. It was shown by two-dimensional (2D) particle-in-cell (PIC) simulation that the plasma pellet can be accelerated to v > 0.1c, where c is the speed of light in vacuum. The kinetic energy of the ions in the core region of the plasma pellet can exceed 10 MeV at a density of 1021 Wcm−2. The scheme has the additional advantage that, unlike the charged-particle beams, the energetic plasma pellet is essentially neutral.
For producing faster plasma pellets, more intense laser pulses are needed. However, it is not easy to increase the laser intensity to beyond 1021 Wcm−2. As an alternative, we propose in this article, consecutive acceleration of the plasma pellet by a number of less-intense laser pulses. This multi-pulse scheme makes use of the repeated actions of the ponderomotive force, which dominates laser-target interactions (Yu et al., Reference Yu, Yu, Xu, Tian, Chen and Wong2007). It is expected to be more effective since weaker laser pulses are expected to suffer from less scattering and modulational instabilities during the laser-plasma interaction. Furthermore, as the plasma pellet is driven by the laser ponderomotive force several times, the interaction distance is enhanced since the later pulse act on an already speedy pellet, which keeps moving forward inertially during the interval between the pulses.
To see the effectiveness of the multi-pulse scheme, we first compare the results of pellet acceleration by a single and by two shorter laser pulses. The peak strength and total energy of the two shorter pulses are the same as that in the single pulse. It is found that the two-pulse scheme is indeed more efficient: in the same time interval, the plasma pellet is pushed forward a longer distance compared to that with a single-pulse, and more plasma ions are accelerated to higher speeds. To show that the plasma pellet can be further accelerated by applying more laser pulses, we also consider applying four laser pulses, with each pulse the same as that in the two-pulse case. It is verified that the additional laser pulses can further accelerate the plasma pellet. In fact, a considerable fraction of the pellet-plasma ions are accelerated to >0.4c, corresponding to an energy gain of 100 MeV. However, because of plasma expansion and laser-related perturbations, the resulting pellet occupies a somewhat larger volume. As expected, the ion density in the pellet core decreases, but it is still well above the critical density.
PIC SIMULATION
We performed 2D3V (two dimensional in space and three dimensional in velocity) PIC simulations (Xu et al., Reference Xu, Chang, Zhuo, Chang and Yue2002; Yu et al., Reference Yu, Yu, Xu, Tian, Chen and Wong2007) on the interaction of linearly polarized Gaussian laser pulses with a dense plasma pellet of micrometer size. The Gaussian laser pulses are incident along the x axis from the left vacuum region into the simulation box, as shown in Figure 1. The laser wavelength is λ0 = 1.06 µm, the normalized laser strength parameter is a L = 50, and the laser spot size (diameter) is d = 10λ0. The corresponding laser intensity is on the order of 1021 Wcm−2. Thus, the electron motion is in the highly relativistic regime, and the laser ponderomotive force is dominant in the laser-plasma interaction. The pellet, of density n 0 = 100n c, is initially 1λ0 in width and 1λ0 in thickness, and located in 9.5 < x/λ0 < 10.5 and −0.5 < y/λ0 < 0.5, where n c = 1021 cm−3 is the critical density.
(Color online) Schematic of simulations for comparison.

In the simulation, the computation box is 50λ0 × 20λ0, the spatial mesh contains 2000 × 800 cells, and each cell contains 625 ions and 625 electrons. The electron-ion mass ratio is 1/1836, the initial velocity of the plasma electrons and ions are assumed to be Maxwellian with temperature 1 keV. The time step of the simulation is 0.016T 0, where T 0 ≈ 3.5 fs is the laser period. Absorbing boundaries are used for both the x and y simulation-box boundaries.
TWO-PULSE ACCELERATION
We begin with pellet acceleration by a single laser pulse of duration τ = 13.3T 0. Figure 2a shows the plasma ion density at t = 42T 0, when the interaction with the laser pulse is over and the periphery of laser pulse has overtaken the plasma pellet (Yu et al., Reference Yu, Xu, He, Yu, Ishiguro, Zhang and Wong2005). One can see that the electrons as well as ions in the pellet are accelerated. We next consider pellet acceleration by two shorter laser pulses. Instead of a single pulse of τ = 13.3T 0, we now use two τ = 6.7T 0 pulses, each having the same parameters as that for Figure 2a, i.e., aL = 50 and w = 5λ0. The total energy in the two pulses is about the same as that in the single13.3T 0-pulse case. The time delay between the peaks of the two laser pulses is 15T 0. Figure 2b shows the ion density at t = 42T 0, i.e., after interacting with the two laser pulses. Our result is similar to the experimental results of Kar et al. (Reference Kar, Borghesi, Bulanov, Key, Liseykina, Macchi, Mackinnon, Patel, Romagnani, Schiavi and Willi2008). Therefore, the two-pulse acceleration scheme is more efficient: in the same period the plasma pellet is pushed forward a longer distance, compared to the single-pulse case.
(Color online) The ion density distribution at t = 42T 0 for the laser durations (a) τ = 13.3T 0, and (b) τ = 6.7T 0. Here T 0 is the laser period, w = 5λ0 its spot radius, and a L = 50 its strength parameter. The initial pellet (located at 9.5 < x/λ0 < 10.5) density is n 0 = 100n c, its width is 1λ0, and its thickness is 1λ0. The color bars are for log(n i/n c).

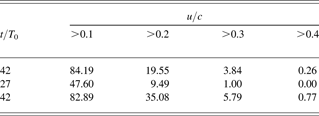
In Figure 3, we compare the ion density distributions along the laser propagation axis (y = 0) for the plasma pellet accelerated by (a) a single 13.3T 0 pulse, and (b) two 6.7T 0 pulses. Figure 3a is for t = 42T 0, i.e., the same as in Figure 2a, and Figure 3b is for t = 27T 0 (black curve) and 42T 0 (blue curve, online only), corresponding to instants when the non-focal-spot parts of the first and second laser pulses have both overtaken the plasma pellet. The distribution of the ion velocity along the laser propagation axis is shown in Figure 4a for the single-pulse case at t = 42T 0, and in Figure 4b for the two-pulse case at t = 27T 0 (black curve) and 42T 0 (blue curve, online only). To show more clearly the difference between the two cases, we present in Table 1 the percentage of the energetic ions (among all the pellet ions) whose velocities are higher than 0.1c,0.2c,0.3c, and 0.4c. The laser and plasma parameters are the same as that for Figures 2 to 4. We see that compared with that of the single laser pulse of the same peak intensity and total energy, the consecutive actions of two shorter pulses can push the plasma pellet forward more efficiently, with more plasma ions being accelerated to higher speeds. This result can be attributed to the repeated actions of the ponderomotive force on the pellet. In the two-pulse acceleration, the plasma pellet is pushed by laser ponderomotive force twice, and in the interval between the pulses the plasma pellet keeps moving forward inertially.
(Color online) The ion density (normalized by n c) variation along the laser propagation axis at (a) t = 42T 0, (b) t = 27T 0 and 42T 0. The input parameters for the cases (a) and (b) are the same as that for Figures 2a and 2b, respectively.


The percentage of energetic ions whose velocities are higher than 0.1c, 0.2c, 0.3c and 0.4c, where c is the light speed. The parameters used are the same as that for Figure 2
MULTI-PULSE ACCELERATION
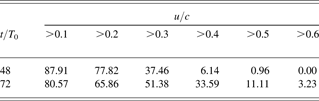
To see if the plasma pellet can be further accelerated if more laser pulses are used, we now apply four τ = 6.7T 0 laser pulses at 10T 0 intervals. The other parameters are the same as that of the two pulse case. Figure 5 shows the distribution of the ion density at t = 48T 0 and 72T 0, corresponding to instants when the action of the third and the fourth pulses are over, respectively. Figures 6 and 7 shows the corresponding distributions of the ion density and velocity along the laser propagation direction. One can see that the additional laser pulses continuously push forward the plasma pellet, which now occupies a larger volume because of plasma expansion and laser-induced perturbations. As a result, the ion density at the core of the pellet decreases. Nevertheless, it is still well above the critical density. Table 2 shows the fractions of ions whose velocities are higher than 0.1c, 0.2c, 0.3c, 0.4c, 0.5c, and 0.6c. We note that a significant fraction (> 1/3) of the ions in the pellet are accelerated to speeds >0.4c. The corresponding ion energy gain is up to 100 MeV.
(Color online) The ion density distribution at (a) t = 48T 0 and (b) t = 72T 0. Four laser pulses, each of w = 5λ0, a L = 50, τ = 6.7T 0, and their peaks separated by 10T 0, interact with the plasma pellet successively. The initial pellet parameters are the same as that for Figure 2. The color bars are for log(n i/n c).

(Color online) Variation of the ion density (normalized by n c) along the laser propagation direction at t = 48T 0 and 72T 0. The other parameters used are the same as that for Figure 5.

(Color online) The ion velocity distribution along the laser propagation direction at 48T 0 and 72T 0. The other parameters used are the same as that for Figure 5.

The percentage of ions whose velocities are higher than 0.1c, 0.2c, 0.3c, 0.4c,0.5c and 0.6c, here c is light velocity. The parameters used are the same as that for Figure 5
CONCLUSION
In conclusion, we have investigated consecutive acceleration of a plasma pellet by a number of USUI laser pulses. We first compared the pellet acceleration by a single laser pulse with that by two shorter pulses of the same peak strength and total energy as the single pulse. It is shown that due to the repeated actions of the ponderomotive force, the two-pulse case is more efficient for pellet acceleration, with more plasma ions accelerated to higher speeds. We next considered the use of four laser pulses, with each pulse the same as that in the two-pulse case. It is found that the additional laser pulses can further accelerate the plasma pellet, with a considerable fraction of the plasma ions accelerated to energy gains of above 100 MeV. Because of plasma expansion and laser-related perturbations, the resulting plasma pellet occupies a larger volume, and the ion density in the pellet core is reduced from the initial value, although it is still well above the critical density (1021 cm−3). This is in contrast to the ions produced by target-normal sheath acceleration and conventional charged-particle accelerators, where the typical density of the accelerated particles is considerably lower. The scheme here provides a higher flux of energetic ions, which is desirable in many real applications (Roth et al., Reference Roth, Cowan, Key, Hatchett, Brown, Fountain, Johnson, Pennington, Snavely, Wilks, Yasuike, Ruhl, Pegoraro, Bulanov, Campbell, Perry and Powell2001; Bulanov & Khoroshkov, Reference Bulanov and Khoroshkov2002; MacKinnon et al., Reference MacKinnon, Patel, Town, Edwards, Phillips, Lerner, Price, Hicks, Key, Hatchett, Wilks, Borghesi, Romagnani, Kar, Toncian, Pretzler, Willi, Koenig, Martinolli, Lepape, Benuzzi-Mounaix, Audebert, Gauthier, King, Snavely, Freeman and Boehlly2004; Mangles et al., Reference Mangles, Walton, Najmudin, Dangor, Krushelnick, Malka, Manclossi, Lopes, Carias, Mendes and Dorchies2006; Krushelnick et al., Reference Krushelnick, Najmudin and Dangor2007; Malka et al., Reference Malka, Faure, Gauduel, Lefebvre, Rousse and Phuoc2008).
ACKNOWLEDGEMENTS
This work was supported by the Natural Science Foundation of China under Grant Nos. 10734130, 10775165, and 10835003, the Science and Technology Commission of Shanghai Municipality under Grant No. 08PJ14102, the National High-Tech ICF Committee of China, and National Basic Research Program of China (973 Program) under Grant Nos. 2007CB815101 and 2006CB806004, the united foundation of National Natural Science Foundation of China and Chinese Academy of Engineering Physics under Grant Nos. 10876011 and 10676010, Japan-Korea-China cooperative project on High Energy Density Sciences for Laser Fusion Energy, and the JSPS Japan-China Core University Program.



