The proportion of those elected to national legislatures who are women varies widely, with most countries falling far short of gender parity. In the average parliament, only 18 per cent of the members are women, but some countries have nearly obtained gender parity while others have no women at all in office.Footnote 1 Most of the comparative, cross-national work on women’s representation tries to explain differences in the percentage of seats held by women using aggregate-level factors, such as socio-economic development, political culture or electoral institutions.Footnote 2 While this answers an important question about women’s descriptive representation, its dominance has nearly precluded research on other equally essential and related questions.
We examine two of these questions in this research note: once a prospective candidate has decided to enter a race, does the candidate’s gender systematically work against (or for) her? And do the individual-level, party-level and district-level characteristics that typically determine electoral success work differently for male and female candidates? To answer these questions, we adopt a novel approach to studying women’s representation. We approach it from the level of the individual candidate and use multilevel modelling to test hypotheses about how individual, party and district-level factors affect the election of women. We do this in three national settings – Australia, Ireland and Malta. When the election of women is addressed with a single observation taken at the level of the national legislature, it is impossible to tease out how individual, party and district-level factors condition the election of women. By making the unit of analysis the individual candidate, we can examine questions that have not received much attention in cross-national research.
Candidate-level research in comparative politics is rare because of the demands of data collection and statistical modelling. Collecting candidate-level data across countries and over time is difficult and time-consuming. Most studies of gender’s effect on vote choice focus on one country and only one or two elections. We observe fifteen elections across three countries with more than three thousand individual candidates running under the banners of more than one hundred parties in almost seventy distinct electoral districts. What is more, modelling data where covariates are measured at multiple levels requires methodological tools that have become widespread in political science only recently. We use hierarchical linear modelling (i.e., multilevel modelling) to predict electoral success because it appropriately deals with covariates across multiple, nested levels – candidate, party-in-a-district,Footnote 3 and district.
We examine electoral success in the Australian Senate, the Irish Dáil, and the Maltese House of Representatives because these are the only national legislative chambers chosen by means of a single transferable vote (STV) electoral system. In STV, voters rank order their preferred candidates on the ballot, and the surplus votes for candidates who obtain office by quota are transferred to second-rank candidates. If after a round of transfers no candidate achieves the quota, the ballot papers of the candidate with the fewest votes are redistributed. Transfers continue until all the seats are filled. Focusing on STV systems allows us to study electoral success in terms of which candidates receive the most first preference votes and which candidates ultimately win seats in the legislature. Even more importantly, however, this case selection allows us to hold constant the incentives that electoral institutions provide to voters and candidates. We avoid the possibility that electoral rules confound our assessment of how voters respond to candidate traits including social characteristics such as gender.
Scholars have debated whether STV systems promote or hinder the election of women, usually drawing on their knowledge of one of these three national cases.Footnote 4 Focusing on Australia, with its relatively large proportion of women in the legislature, research suggests that STV increases the representation of women.Footnote 5 However, studies of Ireland and Malta, where women’s representation is still less than 15 per cent, indicate that STV hurts women’s electoral chances.Footnote 6 We argue that it is inappropriate to attribute a universal effect to STV rules – they merely translate voters’ sincere preferences. Instead, we focus on the way in which candidate, party and district characteristics influence those preferences and determine electoral success. These factors may have different effects in different STV systems.
Candidate Gender And Vote Choice In Australia, Ireland And Malta
The paucity of women in politics has long been attributed to discrimination. This discrimination is thought to emerge from the traditional view that the political arena is a ‘man’s domain’ and that voters will discriminate against women who move out of the private sphere and into the public sphere. However, existing research, predominantly from the United States and Western Europe, provides mixed empirical support for this. Some studies find that voters systematically discriminate against female candidates because of their gender.Footnote 7 Other studies find that women and men are equally likely to win office, especially when party affiliation, incumbency status and other indicators of candidate quality are taken into account.Footnote 8 Still other research has found that being a woman can help candidates rather than hurt them.Footnote 9
The reason for these diverse findings may be due, in part, to differences in cultural, socio-economic and institutional environments across political settings. Indeed, aggregate-level comparative research on the election of women frequently finds that Protestant states, ‘progressive’ political cultures, higher levels of development, and greater women’s participation in work and education lead to more women in office.Footnote 10 Similarly, more inclusive political institutions, such as proportional representation electoral systems (PR), and gender-friendly political climates lead to more women getting elected.Footnote 11 These cultural, socio-economic and political characteristics of states generate positive or negative feelings towards female candidates that voters express in elections.
Existing literature on women and politics in Australia reveals positive public perceptions of female candidates and an inclusive institutional norm. As early as 1982, surveys found that swing voters preferred female candidates because they were fresh faces in a sea of poorly performing male politicians.Footnote 12 Female voters were more likely than male voters to vote for female candidates, and ‘high-profile women candidates appear to pick up far more votes from women than they lose from men’.Footnote 13 Surprisingly, however, studies found that female candidates were disadvantaged in federal Senate electionsFootnote 14 and that gender hurt women because they were not incumbents.Footnote 15 More recent research, however, suggests that female candidates are advantaged.Footnote 16 Today, with several political parties having gender targets or quotas, with women holding key positions in Australian political parties, and with their being represented in the Senate at well over 30 per cent, there may also be a symbolic effect on voters, making them even more accepting of women in politics.
In contrast, Ireland and Malta have strong Catholic cultures where traditional ideas of gender roles reinforce women’s dominance in the home rather than in public – including politics. This has been cited as one of the key reasons why few women run for political office.Footnote 17 As Galligan and Wilford write about Ireland:
The historical influence of a hierarchical and authoritarian culture in which women’s place was defined by the Catholic Church, reinforced by the constitutional framework, and circumscribed by conservative attitudes towards women’s civic role led to women’s political interest and engagement being among the lowest in the EU during the 1980s.Footnote 18
In addition to a traditional culture, the political environment in Ireland and Malta has not been encouraging to women. Party leaders in Ireland are frequently criticized for being a major obstacle to women seeking nomination to party ballots at election time.Footnote 19 They cater to male candidates and work to build local political support behind those candidates, making it difficult for women to break into the electoral process. While gender quotas have become a popular mechanism for increasing women’s representation (and have been adopted in almost one hundred countries), the issue has only recently been considered in Ireland and Malta and no quotas have been implemented.
Empirical research on the election of women in both countries also suggests that gender does not help women’s electoral chances. Research on Ireland has shown that female candidates are less likely to get elected than male candidates.Footnote 20 The literature on Malta is less extensive, but Lane’s simple bivariate analysis finds no gender differences in women’s and men’s election rates – instead arguing that the very small number of women in the parliament is due to very few women seeking office.Footnote 21
Building from these theories and findings about the election of women in Australia, Ireland and Malta, we hypothesize that the more progressive cultural, socio-economic and political environment in Australia will lead to voters preferring female candidates, all else being equal. In Ireland and Malta, however, we expect that voters will be more likely to discriminate against female candidates, all else being equal.
Individual, Party, And District Characteristics And The Election Of Women
Being a female candidate in Australia or a male candidate in Ireland and Malta may increase a candidate’s electoral support, but that effect may be exaggerated by other candidate-level, party-level or district-level characteristics. At the candidate level, for example, being an incumbent or having previous campaign experience could make female candidates more attractive to voters than female newcomers, because they have proven themselves to be viable political contenders.Footnote 22 We hypothesize that this boost may be larger for women than for men because men are expected to be electable to begin with, whereas women may have to prove themselves first to overcome voter bias.Footnote 23 Indeed, Bean found that female incumbents in Australia are particularly advantaged in federal elections.Footnote 24 Incumbency and prior campaign experience could be even more important in countries with less progressive cultures. If women have the status and experience needed to win, then they will be better able to overcome traditional barriers to the election of women and should receive a substantial boost in electoral support.
At the party level, women may benefit more than men by running in strong political parties (i.e., those which traditionally have higher party magnitudes).Footnote 25 If a party expects to win more than one seat, then electing a woman is no longer a zero-sum game where the election of a woman means electing no men. Thus, we hypothesize that a woman running in a strong party may have a particular advantage in an election. Numerous studies have shown that larger district magnitudes and higher party magnitudes lead to the election of more women.Footnote 26 In Ireland, where district magnitude varies only between three and five, Engstrom found that significantly fewer women were elected in the three-member districts than in the four- and five-member districts.Footnote 27
Similarly, women running on party ballots against a large number of co-partisans could be disproportionately helped or hurt. On the one hand, where voters favour female candidates, gender could be an important cue at election time when voters are faced with a ballot full of names they do not recognize. Where voters have a bias against female candidates, on the other hand, we hypothesize that gender provides a negative cue that could hurt women on a list of otherwise anonymous party candidates. Studies of gender and vote choice in the United States suggest that candidate gender is a more important cue for voters in primary elections than in general elections because they must choose from a longer list of candidates, many of whom are unknown to the voter.Footnote 28
At the district-level, female candidates may be helped by running where the number of incumbents running is low. Incumbency is one of the primary obstacles to the election of women.Footnote 29 Where large numbers of incumbents run and most of those incumbents are men, it may be very difficult for women to break the incumbency cycle.Footnote 30 Therefore, when women run against large numbers of incumbents, their chances of winning will be smaller.
In sum, we expect candidate gender to have a direct effect on election outcomes, but we also expect that effect to differ in interaction with other conditions. We expect female candidates to be more competitive when they possess particular qualities, run for strong parties or contest elections in more open districts. Below, we test whether female candidates are more or less likely than male candidates to garner electoral support and then examine whether there are specific candidate, party and district characteristics that advantage or disadvantage women.Footnote 31
Modelling Multilevel Determinants Of Support For Female Candidates
In the models we present below, we attempt to explain first-count, first-rank vote share for the candidate,Footnote 32 and also whether, after all rounds of vote transfers, the candidate wins or not. Unlike the vote share measure, whether a candidate wins captures all rounds of the count and lower (but ordered) preferences. Obviously, the two are related but not identical. Given the continuous nature of the vote share dependent variable, we expect to have more purchase on explaining differences across candidates in those models.
Our hypothesized explanations for a candidate’s electoral support are measured at three different levels of analysis: the characteristics of individual candidates are nested within parties (parties-in-a-district) and in turn within districts.Footnote 33 As Steenbergen and Jones note, models that do not explicitly account for the nested nature of hierarchically-structured levels of data (i.e., ‘pooled models’) may yield biased estimates.Footnote 34 This is because pooled models artificially and dramatically inflate the statistical significance of higher-level variables by underestimating the standard errors of regression coefficients. A second problem with pooled models is that they violate a key assumption of most standard regression models, namely that the error terms are uncorrelated. If there is anything unique about a district, such as an abnormally high number of incumbents competing, it is that all individual candidates in that district may have negative residuals after fitting the data points to a regression line. In this sense, the residuals are not independent but rather joint products of some district-specific characteristic variation that would be unmodelled if we did not account for the hierarchical nature of the data.
There is no need to point out all the previous studies in this area that have innocently failed to account for the multilevel structure of their data. That said, one contribution of our work is to model such data more appropriately than has typically been done in the past. By using multilevel modelling techniques, we can account for group indicators – party-in-a-district and district – while estimating group-level coefficients – traditional party strength (at the party-in-a-district level), the number of co-partisans competing (at the party-in-a-district level), and the number of open seats (at the district level).Footnote 35 More specifically, we model intercepts but not coefficients as varying across levels.Footnote 36 In other words, being a member of a particular party-in-a-district or running in a particular district may distinguish a group of candidates from all others, but it will not lead to a differential effect for the covariates included in the model.
Measuring Individual-Level, Party-Level And District-Level Influences
We coded each candidate’s gender, with 1 signifying female.Footnote 37 Based on the existing literature, we hypothesized, on the one hand, that the more traditional political cultures and attitudinal patterns in Ireland and Malta will diminish support for female candidates. In Australia, on the other hand, we expect that female candidates, all else being equal, may be favoured by voters. To approximate ‘all else equal’, we measure attributes of individual candidates, traits of the parties with which they are affiliatedFootnote 38 and characteristics of the districts within which they compete.Footnote 39
Beyond gender as a determinant of election, we control for the characteristics of individual candidates that may affect their chances of winning the election, including whether they are incumbents, whether they have previous campaign experience, and their rank or position on the ballot. Given that we are holding the electoral system constant, we expect cross-national variation in the causal impact of the candidate-level factors identified in the existing literature – beyond the perceptions of gender described above – to be minimal. For example, incumbency should be important in all three cases. Re-election is possible in all of these cases and sitting incumbents running for re-election have distinct advantages that challengers do not have. For similar reasons, we expect previous campaign experience to be an advantage to candidates across all of the cases. Our indicator of campaign experience is whether a candidate competed unsuccessfully in the previous election.Footnote 40
One exception to these universal expectations is that a candidate’s position on the party ballot should not matter equally in all countries. In Australia, a candidate’s rank is determined by the political party and voters often defer to that rank when placing a preference vote.Footnote 41 Candidate rank is alphabetical across parties in Ireland and within parties in Malta. While studies have suggested that some voters vote by list place (increasing the chances that candidates with last names at the beginning of the alphabet will be advantaged over those with names at the end of the alphabet), the effect of this is unlikely to be as strong as the informative ranking provided by party leaders in Australia.Footnote 42
Beyond individual-level characteristics, we also seek to account for the traditional strength of each candidate’s party and the competition posed by his or her co-partisans. Thus, we include independent variables that vary at the level of party-in-a-district: past party magnitude and the number of co-partisan competitors. Candidates are more likely to win when they are running in the bailiwicks where their parties have done well in the past. The effect of past party magnitude (i.e., the number of seats a party won in the district) should be equally strong across all cases. Where a candidate faces more co-partisans (relative to seats contested), and consequently more competition, we would expect his or her vote share and prospects of winning to decrease.
Finally, factors characterizing the competitiveness of the district context may also reduce the prospect of any individual winning. We account for district-level competition – specifically, the fraction of district seats defended by an incumbent. This varies widely across districts. On average, it is highest in Malta and lowest in Australia, but the cross-district variation within countries is greater than the variation in national averages. We expect that an individual candidate’s prospect of winning decreases as the fraction of seats defended by an incumbent increases.
Analysing The Effect Of Candidate Gender On Vote Choice
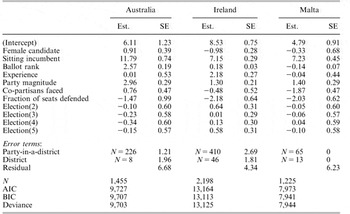
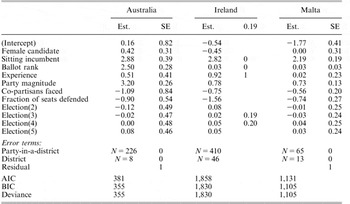
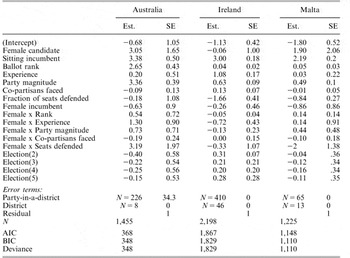
We present our results as figures rather than as a series of lengthy tables (see Appendix 1).Footnote 43 We eschew typographic symbols for statistical significance and instead, provide 90 per cent credible intervals: the values over which each variable’s distribution is estimated to lie.Footnote 44 A crosshair to the right of the vertical ‘zero-line’ indicates a positive relationship between the independent and dependent variables; to the left a negative one. The substantive magnitude of the coefficient is on the horizontal axis. The thick lines around the crosshairs show the credible intervals resulting from multilevel models while the thin lines are the credible intervals from pooled models.Footnote 45 We focus on the results from the multilevel models because they provide more efficient estimates of the covariates' effects, as described previously.Footnote 46
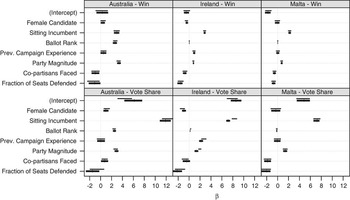
In Figure 1, we present models isolating the effect of gender on first-round, first-preference vote share and on winning in each of the three countries. Our substantive results are consistent with our hypotheses. Controlling for other individual-level traits, party-in-a-district traits and district traits, being a woman has a statistically discernible, positive effect on first-round vote share in Australia (but the effect is insufficient to have an impact on whether a candidate wins or not). The expectation – based on the model intercept – for the average first preference vote share won by all candidates in Australia is 6 per cent. For female candidates, all else being equal, that share increases by about one percentage point. In Ireland, being a woman is detrimental to one’s electoral prospects. The effect of gender is negative and statistically discernible for both vote share and the dichotomous indicator of victory. For female candidates, we would expect the average first-round, first-rank vote share to be approximately 7.5 per cent compared to 9.5 per cent for male candidates, and the nearly 2 per cent drop identified in the model and in subsequent transfers were together sufficient to negatively impact the possibility of eventual victory. Our findings for Malta are similar to those reported by Lane.Footnote 47 Gender is not a statistically discernible determinant of either vote share or winning, although for victory, its effect is more likely negative than positive (the mass of the distribution, though it contains zero, lies predominantly on the negative side).
The electoral consequences of gender Note: Results from 12 models: 3 countries, 2 dependent variables, 2 models each (1 pooled across districts and parties-in-a-district, 1 modelling intercept at each level). Crosses show the mean value of the coefficient’s posterior distribution from the multilevel models. Thick lines are 90 per cent credible intervals from the same simulation. Thin lines are the 90 per cent credible intervals from the pooled models.

Our other hypothesized determinants of electoral results were generally well chosen. Being an incumbent was positively associated with both vote share and winning in all three countries. Prior electoral experience – having run in the previous race (without winning) – had a positive effect on winning but not vote share in Australia, and was positively associated with both vote share and winning in Ireland. It was not a statistically discernible determinant of either dependent variable in Malta. Given the nature of our indicator, this may not mean that campaign experience is unhelpful but, instead, that having one race under one’s belt is not sufficient to overcome whatever explained defeat the previous time around. A candidate’s rank on the ballot had the predicted effect in Australia. If party leaders put a candidate near the top of the list, voters took the cue, increasing first round, first preference votes and the prospect of winning. List rank had substantively minuscule (but decidedly) positive effects in Ireland where candidates’ names appear in alphabetical order. In Malta, candidates appear alphabetically by party grouping, and ballot rank has no discernible impact on victory and only a small negative effect on vote share.
Party and district factors also performed well. Historical strength of a candidate’s party in the district is positively associated with both vote share and winning in all three countries. Facing many co-partisans suppresses candidates’ vote shares and chances of winning, except in Australia, where, counterintuitively, its effect is positive for vote share. Perhaps parties run more candidates in their strongholds, but ballot rank is sufficient to ensure that votes aggregate on a few candidates. In the victory model for Australia, it is decidedly negative, as one would expect. Finally, as the ratio between incumbents competing and seats contested increased, both vote share and chance of winning decline for any individual candidate in all three countries (with the caveat that in terms of victory in Australia, the interval includes zero, though the mass of the distribution is predominantly negative).
The Conditional Effect Of Individual, Party And District Determinants Of Electoral Support For Male And Female Candidates
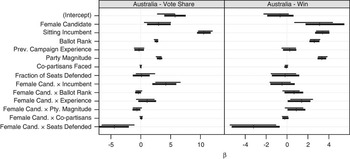
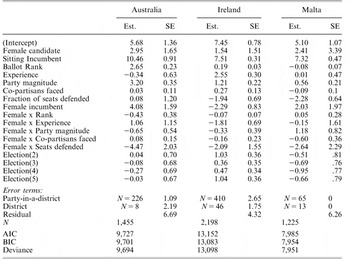
Controlling for standard measures of candidate strength, party characteristics and district competitiveness, being a woman helped candidates in Australia, hurt them in Ireland and was not a statistically discernible determinant in Malta. Clearly, candidate gender can affect electoral support (both positively and negatively). The next question is whether there are specific candidate qualities that women need or certain parties or districts in which women should run to make themselves more competitive candidates. To answer this question, we run a set of statistical models interacting candidate gender with our other covariates (see tables in the Appendix). We present the results graphically starting with the models for Australia (Figure 2). The coefficient for the gender constituent term is not particularly meaningful. It captures the impact of gender when every other variable in the model takes the value 0, which is never the case. The constituent terms for every other variable tell us their effect when gender equals 0, or the candidate is a male. Adding the coefficient of any other constituent term to its interaction with gender reveals the effect of that constituent term when the candidate is a woman (results for Australia depicted in Figure 2, Ireland in Figure 4, and Malta in Figure 6).
The conditional effects of individual, party and district characteristics on electoral support in Australia Note: Crosses show the mean value of the coefficient’s posterior distribution from the multilevel models. Thick lines are 90 per cent credible intervals from the same simulation; thin lines are the 90 per cent credible intervals from the pooled models.

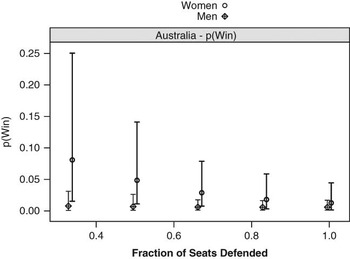
In Australia, determinants of electoral success perform similarly across male and female candidates. The only factors that have a noteworthy effect for female candidates are incumbency and district openness and both matter more for increasing women’s vote share than their probability of winning office. In a sense, incumbency works both for and against female candidates. On the one hand, being an incumbent increases a male candidate’s vote total by 10 percentage points but it gives a more than 14 percentage point increase to women. On the other hand, female candidates do worse than male candidates in districts where many incumbents are defending their seats. In Figure 3, we see that when the fraction of seats defended by incumbents is low, the probability that any given female candidate will win is very high, but as the ratio of incumbents to seats approaches 1, the prospects of female candidates and male candidates are nearly equal. It is ironic that female candidates have a lower chance than male candidates of winning a seat where incumbents are defending, but, if they can somehow obtain a seat, it provides a disproportionate boost to their future electoral prospects.
Competing for open seats in Australia increases female candidates’ prospects of winning more than it does male candidates’ prospects Note: Predicted outcomes and 90 per cent credible intervals (values of continuous covariates held at their means, dichotomous covariates held at their mode of 0).

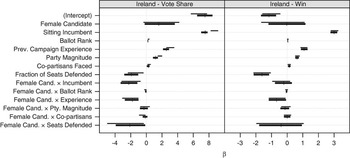
In Ireland, we found that voters discriminate against women, controlling for all else. When we interact gender with other determinants of electoral outcomes, we find that two of the individual characteristics that increase men’s prospects do not give as big of a boost to women (see Figure 4). Both being an incumbent and having previous electoral experience generate more votes for a candidate, but the increase is not as great for female candidates as it is for men. Being an incumbent gives an almost 7.5 percentage point bump in vote share to a male candidate, but it gives only a 5 percentage point bump to a female candidate. Likewise, previous campaign experience gives men about a 2.5 percentage point bump but less than a 1 percentage point increase to women (this effect is statistically discernible on the prospect of winning as well).
The conditional effects of individual, party and district characteristics on electoral support in Ireland Note: Crosses show the mean value of the coefficient’s posterior distribution from the multilevel models. Thick lines are 90 per cent credible intervals from the same simulation; thin lines are the 90 per cent credible intervals from the pooled models.

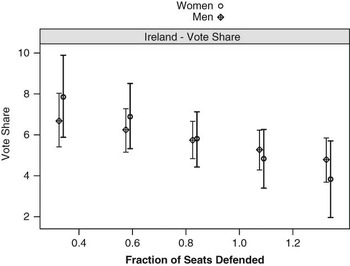
At the level of the party, running in a district where the party is strong (past party magnitude) has a positive effect on all Irish candidates’ prospects. If anything, the boost is slightly lower for female than male candidates (as in Australia, the number of co-partisans faced did not affect male or female candidates’ chances). At the level of the district, running against many incumbents hurt any given candidate’s chances of winning, but the impact is likely to be more severe for female candidates (see Figure 5). While the credible intervals overlap, it appears that when virtually no incumbents are defending, female candidates may generate more votes than male candidates, but as the number of incumbents running as a proportion of the seats contested increases, male candidates do better.Footnote 48
Competing where more seats are defended by incumbents decreases female candidates’ vote shares more than it does male candidates’ shares Note: Predicted outcome and 90 per cent credible intervals (values of continuous covariates held at their means, dichotomous covariates held at their mode of 0).

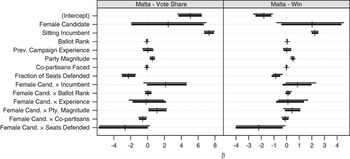
As we noted earlier, a relatively small number of candidates are women in Malta, and we failed to find any statistically discernible effect for candidate gender when controlling for individual, party and district traits. When we look for differential effects of these factors, we do not find any support for the idea that the individual characteristics of male and female candidates vary in their impact (see Figure 6). Being an incumbent is a big boost to any candidate, male or female (though the vast majority of incumbents are men). Alphabetical ballot rank and prior campaign experience did not help any candidates in Malta.
The conditional effects of individual, party and district characteristics on electoral support in Malta Note: Crosses show the mean value of the coefficient’s posterior distribution from the multilevel models. Thick lines are 90 per cent credible intervals from the same simulation; thin lines are the 90 per cent credible intervals from the pooled models.

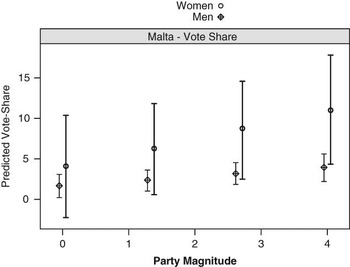
At the level of the party, the number of co-partisans faced did not adversely affect male candidates, but it did have a negative effect on the vote share of female candidates in Malta. A one standard-deviation change in the number of co-partisans caused female candidates’ vote share to drop from 5.1 per cent to 3.6 per cent. Party magnitude had a small, but statistically discernible, positive effect on both first-round vote share and the prospect of ultimately winning for both men and women, and the boost to vote share was relatively larger for female candidates. A one-seat increase in past party magnitude results in about a 1 percentage point increase in the first-round vote share of female candidates (see Figure 7).
Running in a traditionally strong party benefits female candidates’ vote shares more than it does male candidates’ shares in Malta Note: Predicted outcome and 90 per cent credible intervals (values of continuous covariates held at their means, dichotomous covariates held at their mode of 0).

At the level of district features in Malta, female candidates had particular difficulty winning where many incumbents were competing for seats.Footnote 49 The probability that a given female candidate would win dropped by more than 30 per cent as the proportion of incumbents to seats went from its lowest to highest observed values.
Across our three cases, we found that female candidates have a harder time than male candidates competing under some conditions, but we did not find a systematic pattern where individual, party or district characteristics had consistent effects across all cases. In Australia, individual candidate traits that make candidates more electable worked even better for women than men. In Ireland, factors we would associate with electoral success – both at the individual and district levels – did not help female candidates as much as they did male candidates. And, in Malta, individual, party and district characteristics all seemed to provide less of a boost to female candidates than male candidates. Thus, the effect of gender on vote choice is not conditioned systematically by other factors. Increasing campaign experience, getting in certain positions on the party ballot or running in strong parties operate differently in different election settings.
Conclusion
Gender and politics research has often found that candidate gender has little to no effect on election outcomes. This has been especially true in the United States and Great Britain. Our study of election outcomes shows that candidate gender can affect vote choice in some national contexts and that the effect of being a woman can be positive or negative depending on that context. Holding constant electoral rules by examining only chambers elected using single transferable vote systems means that we can eliminate this set of institutions as possible determinants and focus on other influences on the election of women.
Because our analysis was conducted at the level of the individual candidate – a relative rarity among studies of electing women to legislatures – we were able not only to test the effects of individual-level characteristics but also to determine whether individual, party and district characteristics have impacts on female candidates that they do not have on male candidates. On the one hand, we found that determinants of electoral success, other than candidate gender, worked differently for male and female candidates in different countries. The bias in favour of female candidates in Australia was further enhanced by added rewards for female candidates who were incumbents and had campaign experience. On the other hand, female candidates benefited less than male candidates from being in strong parties, and they fared relatively poorly when competing for seats defended by incumbents. The negative bias against female candidates in Ireland was compounded by lesser rewards for being an incumbent or having campaign experience, and again female candidates fared relatively poorly when competing for seats defended by incumbents. No individual, party or district determinant of electoral success aided female candidates more than male candidates in Ireland. In Malta, female candidates got a relatively larger boost to their vote share for belonging to a traditionally strong party, but they were penalized for facing co-partisans and incumbents.
These differential findings elucidate the role that candidate gender plays in elections by shedding light on the specific conditions under which women are advantaged or disadvantaged. Gender differences in the likelihood of winning are frequently more difficult to discern (at a statistically significant level) than are differences in vote shares, but some differences persist nonetheless. Our findings also illustrate that there are few systematic disadvantages (or advantages) for women across national contexts. If there is one lesson to be drawn for those interested in increased representation for women, it is that female candidates are particularly challenged when they run in incumbent-dominant districts. Nominating women to compete where open seats are abundant is a way to boost gender parity. Proponents of women’s representation in Ireland will be particularly frustrated. No individual, party or district characteristics benefit female candidates more than male candidates with the same characteristics. If proponents of women’s representation in Malta wish to draw positive lessons, it would be that leaders of the major parties can boost women’s prospects by nominating them to run in districts where they face relatively few co-partisans and relatively few incumbents.
The role of gender in election outcomes should not be dismissed in comparative research just because the direction and size of gender’s effect vary across countries. In fact, we need more research on how the individual characteristics of female candidates, the parties to which they belong and the districts in which they are running affect their prospects for election. Most comparative research on women’s representation focuses simply on explaining the overall level of women’s descriptive representation across countries, but this approach obscures some important aspects of the election process and the bias women may face in different phases of elections – entering the candidate pool, getting onto party ballots and, finally, winning votes and seats. We focused specifically on the final stage, moving from candidate to officeholder, which allowed us to determine whether voters evaluate candidates differently based on gender and what electoral conditions exacerbate that effect. However, additional research is needed on earlier stages of the election process (and the final election stage in other countries around the world). Comparative gender research can benefit substantially from a more individual-level approach to studying women’s political representation.