1. Introduction
Recently, much attention has been paid to laboratory modelling of astrophysical processes and, in particular, relativistic and non-relativistic jets observed in the widest class of compact astrophysical sources. This is due to the emergence of a whole class of new high-density power facilities developed as part of the inertial confinement fusion program and the development of modern high-power lasers (Lindl et al. Reference Lindl, Amendt, Berger, Glendinning, Glenzer, Haan, Kauffman, Landen and Suter2004) and Z-pinch systems (Ryutov, Derzon & Matzen Reference Ryutov, Derzon and Matzen2000). As a result, it became possible to conduct well-controlled and well-diagnosed laboratory experiments to study hydrodynamic jets with a high Mach number (Ryutov & Remington Reference Ryutov and Remington2002; Remington, Drake & Ryutov Reference Remington, Drake and Ryutov2006). In particular, significant progress was achieved on the MAGPIE facility (Imperial College London, UK). In the series of experiments performed at this facility, the rotation effects detected in protostellar jets were modelled in the laboratory, the interaction of high-speed radiation-cooled jets with the environment were modelled and possible mechanisms of the jet formation have been elucidated among other results (Lebedev, Frank & Ryutov Reference Lebedev, Frank and Ryutov2019). Interesting results were also obtained on a high-power laser in the LULI laboratory (Ecole Polytechnique, Paris, France), where it was shown that applying a poloidal magnetic field can provide effective collimation of the plasma flow (Albertazzi et al. Reference Albertazzi, Ciardi, Nakatsutsumi, Vinci, Béard, Bonito, Billette, Borghesi, Burkley and Chen2014). Recently, similar studies have been also started in Russia (Belyaev et al. Reference Belyaev, Bisnovatyi-Kogan, Gromov, Zagreev, Lobanov, Matafonov, Moiseenko and Toropina2018). An extensive experimental program for laboratory modelling of jets from young stellar objects has been carried out at the planar magnetized coaxial gun facilities at the California Institute of Technology (Bellan Reference Bellan2018) and at the University of Washington (Lavine & You Reference Lavine and You2019).
Let us recall that jets are observed in a wide variety of cosmic objects: from blazars, active galactic nuclei and, presumably, gamma-ray bursts to microquasars and young stellar objects. The jets in these objects range from megaparsec (active galactic nuclei) to several parsecs (young stars) and have velocities from ultrarelativistic, with a Lorentz factor of several tens, to non-relativistic (for young stars). In this case, jet ejections provide the natural way to shed away the excess angular momentum of the star and accretion material, which allows the young star to contract to the required size (Pelletier & Pudritz Reference Pelletier and Pudritz1992; Heyvaerts Reference Heyvaerts, Chiuderi and Einaudi1996; Beskin Reference Beskin2010a). Moreover, although for non-relativistic jets it is still premature to talk about the direct detection of their rotation (Woitas et al. Reference Woitas, Bacciotti, Ray, Marconi, Coffey and Eislöffel2005; Coffey et al. Reference Coffey, Bacciotti, Ray, Eislöffel and Woitas2007), for relativistic jets this fact can be considered firmly established (Mertens et al. Reference Mertens, Lobanov, Walker and Hardee2016).
It should also be noted that in almost all cases, the main energy release is carried out in the so-called active zones (they were first discovered in non-relativistic jets from young stars as Herbig–Haro objects), where a supersonic jet interacts with the ambient medium. This process results from the heating of the plasma behind the front shock, and the release of energy of the jet itself. However, in the most experiments mentioned previously, the main emphasis was on the study of the formation and collimation of a jet. Consequently, the flow propagation process was hardly considered, and plasma formations were usually generated in a rather high vacuum. To overcome this problem, in Z-pinch experiments, additional gas injection was used to simulate the jet interaction with plasma wind or molecular clouds using the evaporation of plastic foils (Lebedev et al. Reference Lebedev, Ampleford, Ciardi, Bland, Chittenden, Haines, Frank, Blackman and Cunningham2004) or valve and supersonic gas nozzle (Ampleford et al. Reference Ampleford, Lebedev, Ciardi, Bland, Bott, Chittenden, Hall, Jennings, Armitage and Blyth2005). The jet–foam interaction was studied in the laser-driven supersonic-jet experiment (Foster et al. Reference Foster, Wilde, Rosen, Williams, Blue, Coker, Drake, Frank, Keiter and Khokhlov2005).
In the case of young stars, the hydrodynamic effects arising from the propagation of a flow in a medium with a finite density can be a significant factor. Therefore, in order to simulate the propagation of jets in the background plasma and study their stability, it is necessary to be able to trace the propagation of matter over considerable distances compared with the transverse dimensions of the jets. Devices of the ‘plasma focus’ (PF) type (Filippov, Filippova & Vinogradov Reference Filippov, Filippova and Vinogradov1962; Mather Reference Mather1965) appear to be very promising to achieve this goal. PF facilities are known as sources of intense plasma flows, which are widely used in various fields, including the modelling of astrophysical processes (Mourenas et al. Reference Mourenas, Vierne, Simonet, Krauz, Nikulin, Myalton and Karakin2003; Beskin et al. Reference Beskin, Istomin, Kiselev, Krauz, Mitrofanov, Myalton, Nokhrina, Sob'yanin and Kharrasov2017a; Krauz, Beskin & Velikhov Reference Krauz, Beskin and Velikhov2018).
At present, the most advanced model of jets is the electromagnetic model (Beskin Reference Beskin2010b). According to this model the decisive role in the collimation and propagation of jets is played by the electromagnetic forces arising from the rotation of the ‘central engine’. In this model, an electric current flows in the vicinity of the axis of the jet, closing at its periphery. In this case, the transverse size of the jet should be determined from the balance of the internal pressure determined by the magnitude of the magnetic field and the pressure of the external environment (which, in turn, depends on the distance from the ‘central engine’) (Beskin et al. Reference Beskin, Chernoglazov, Kiselev and Nokhrina2017b). Therefore, both the external environment and the distribution of the toroidal magnetic field play important roles in this model.
Naturally, at the first stage, the main task of the experiment was to verify how this picture is applicable for the analysis of plasma flows generated in laboratory PF facilities. First experiments (Mitrofanov et al. Reference Mitrofanov, Krauz, Myalton, Velikhov, Vinogradov and Vinogradova2014, Reference Mitrofanov, Krauz, Myalton, Vinogradov, Kharrasov and Vinogradova2017a; Voitenko et al. Reference Voitenko, Ananyev, Astapenko, Basilaia, Markolia, Mitrofanov, Myalton, Timoshenko, Kharrasov and Krauz2017) showed that the observed plasma flows contain a strong (up to 10 kG) toroidal magnetic field, which decreases as  $1/{r^n}$ with distance r from the axis of the flow. Indications were also found that current closure occurs on the periphery of the flow itself (Krauz et al. Reference Krauz, Mitrofanov, Voitenko, Astapenko, Markoliya and Timoshenko2019). Finally, the morphology of the areas of interaction between the plasma ejections and the working gases filling the chamber was indeed close to the structure of the characteristic regions observed both in non-relativistic (Herbig–Haro objects) and relativistic (so-called radio lobes) astrophysical objects (Beskin et al. Reference Beskin, Istomin, Kiselev, Krauz, Mitrofanov, Myalton, Nokhrina, Sob'yanin and Kharrasov2017a; Krauz et al. Reference Krauz, Myalton, Vinogradov, Velikhov, Ananyev, Dan'ko, Kalinin, Kharrasov, Vinogradova and Mitrofanov2017, Reference Krauz, Beskin and Velikhov2018). Therefore, it seems extremely important to conduct further detailed studies to clarify the role of the external environment and the details of the structure in the areas of interaction with the external environment. In this sense, one of the most promising facilities is the PF-1000, because it allows not only detailed measurements to be taken of the structure of the magnetic field, but also distance-dependent conditions to be modelled in the external environment.
A particularly attractive point here is that the equations of magnetic hydrodynamics do not have their own intrinsic scales. Therefore, despite the huge difference in the parameters of astrophysical and laboratory plasma outflows (their sizes differ by 14–15 orders of magnitude, and characteristic densities and pressures by 15–16 orders of magnitude), they can be studied in the framework of the same system of equations (Ryutov & Remington Reference Ryutov and Remington2002; Remington et al. Reference Remington, Drake and Ryutov2006). The first experiments showed that the conditions satisfying the basic laws of similarity, which make it possible to model the jets of young stars, are fulfilled in the PF-1000 (Skladnik-Sadowska et al. Reference Skladnik-Sadowska, Dan'ko, Kwiatkowski, Sadowski, Zaloga, Paduch, Zielinska, Kharrasov and Krauz2016). It was also shown that in some modes of filling the chamber with working gas, compact plasma objects are formed, which retain their compactness when being spread over considerable distances (Krauz et al. Reference Krauz, Paduch, Tomaszewski, Mitrofanov, Kharrasov, Szymaszek and Zielinska2020).
Based on the previous discussion, the objectives of this work are:
(i) the creation of profiled initial gas distributions for a controlled variation in the propagation conditions of axial plasma flows in the background plasma;
(ii) the study of the propagation of axial plasma flows from the pinching area of the plasma current-carrying sheath (PCS) for the prefill and pulse gas injections into the chamber of the device;
(iii) the study of the structure of the plasma flow and the regions of circulating currents;
(iv) the study of the spatial and temporal behaviour of a toroidal magnetic field captured by plasma.
2. Set-up of the experiment
2.1. Design of the experiment
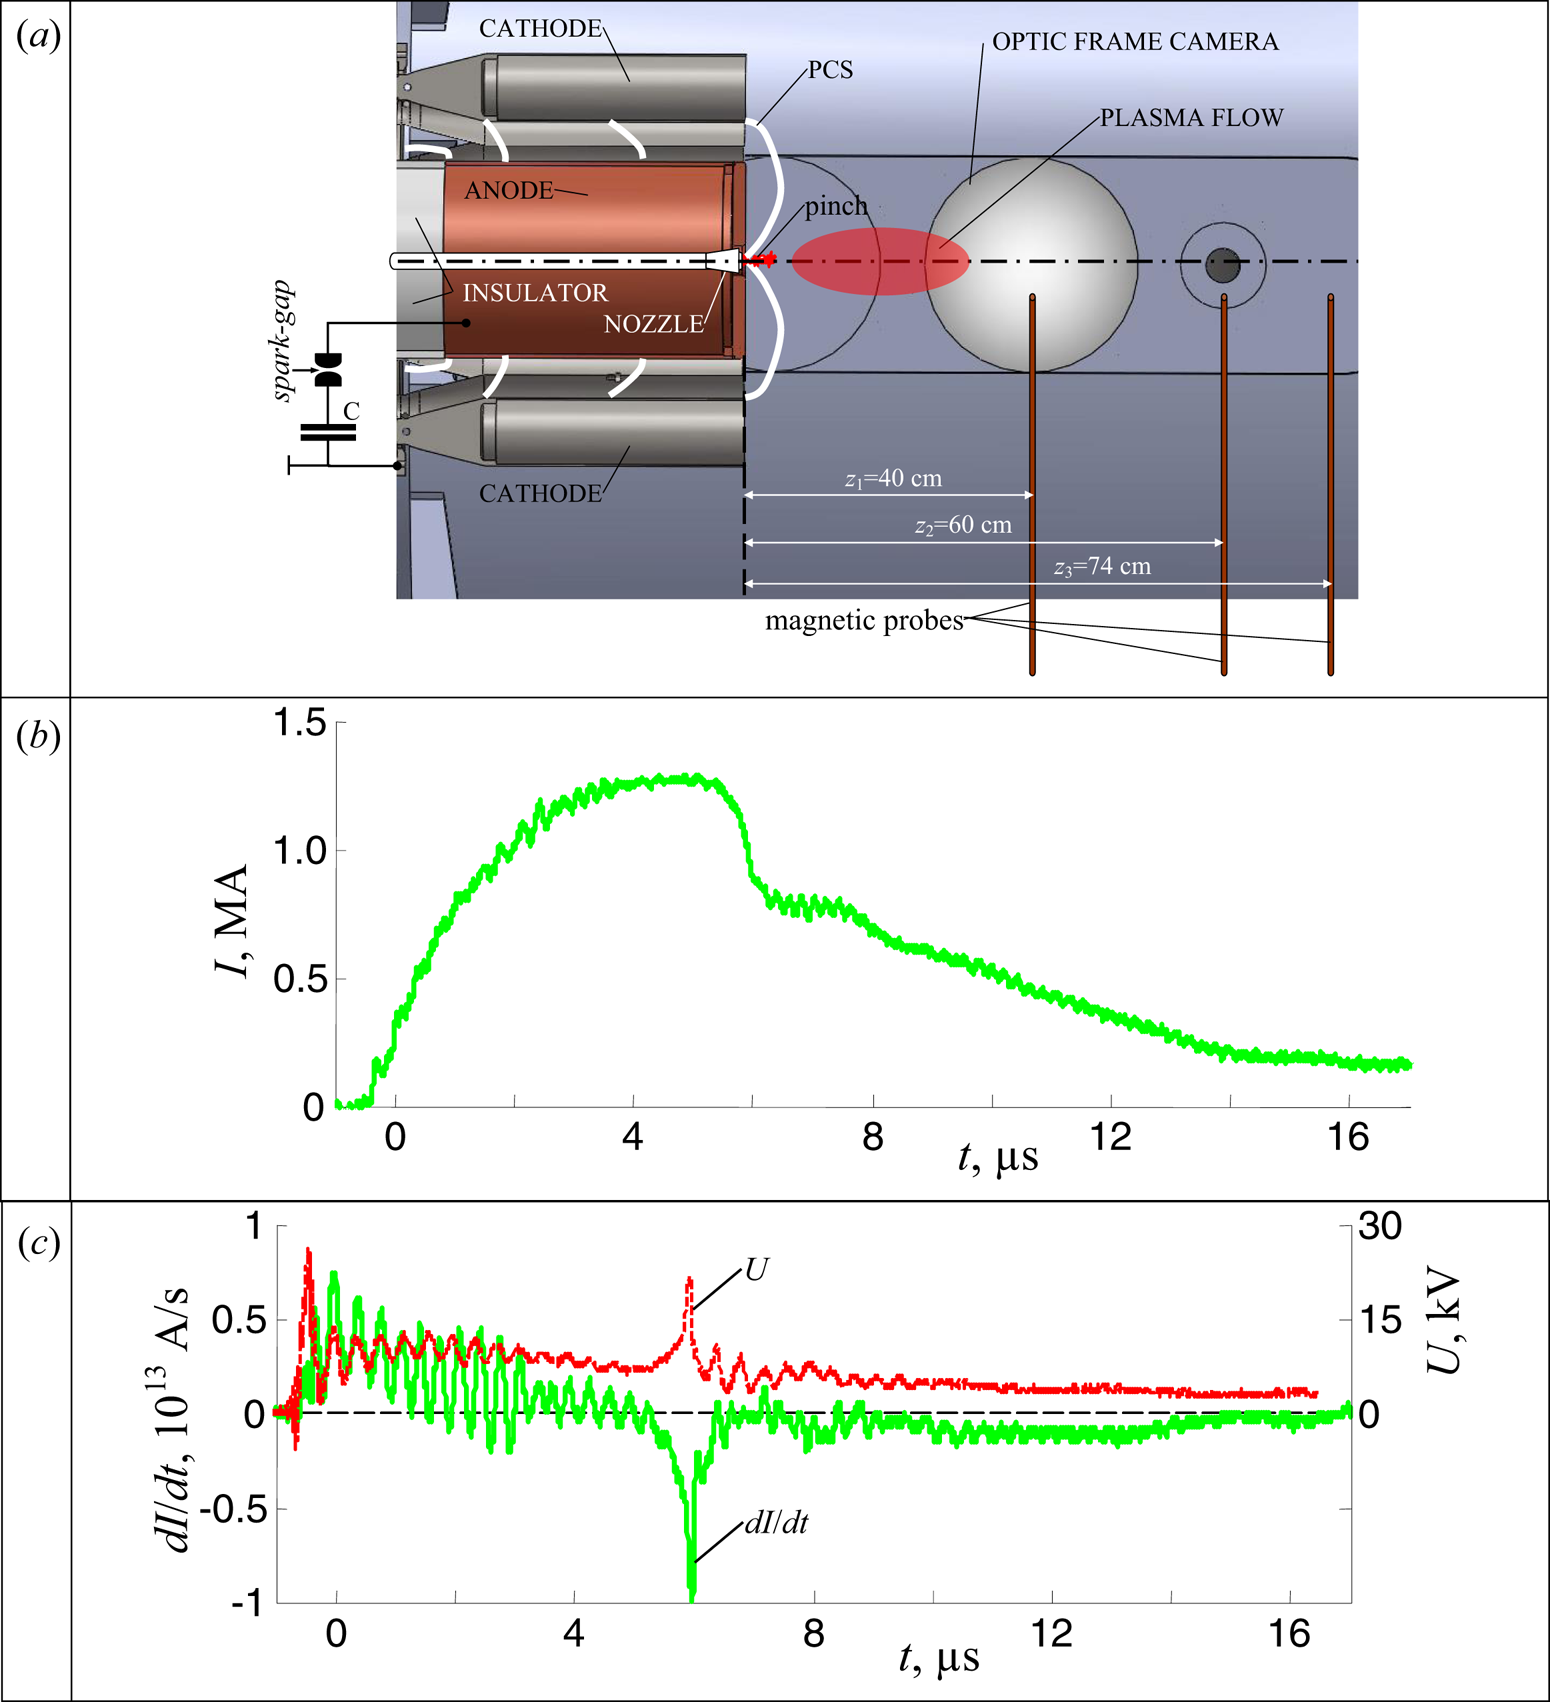
The experiments to study axial flows were carried out on a PF-1000U facility ( ${W_{\textrm{max}}} \approx 1\;\textrm{MJ},\;{V_{\textrm{max}}} = 40\;\textrm{kV}$, IPPLM, Warsaw, Poland), which is a PF with the Mather-type geometry of the electrode system. The main parameters of the facility are described in detail by Scholz et al. (Reference Scholz, Miklaszewski, Gribkov and Mezzetti2000) and Mitrofanov et al. (Reference Mitrofanov, Krauz, Grabovski, Myalton, Vinogradov, Paduch, Scholz and Karpiński2015). The discharge chamber, the location of some diagnostic tools and typical waveforms of the discharge current and its derivative are presented in figure 1.
(a) The layout of some diagnostic tools for the study of axial plasma jet on the facility PF-1000U (axial cross-section is shown), (b) discharge current and (c) derivative of the current and discharge voltage for shot when the chamber is prefilled with deuterium at P 0 = 0.9 Torr (pulse 1155). The stages of PCS compression and the formation of a pinch are schematically shown in the region between electrodes of the discharge system of the facility in (a). The region of propagation of the plasma flow along the axis of the facility is also schematically shown.

After preliminary pumping, the vacuum chamber is filled with working gas, depending on the tasks at a pressure of ~1 Torr. When the spark gap switches on, a high voltage of the capacitor bank is applied between the anode and cathode, which leads to a breakdown of the working gas. The resulting PCS moves under the action of Ampere forces toward the axis of the discharge system, where the plasma pinching occurs. Pinching is accompanied by a decrease in current and, accordingly, the appearance of a sharp dip in the derivative of the current (figure 1b,c). The pinching stage lasts several hundred nanoseconds and is accompanied by the generation of various types of radiation depending on the kind of working gas, charged particle beams and intense plasma flows, which are widely used in various fields of science and technology, such as radiation materials science, material modification, etc. Then the pinch is destroyed as a result of the development of magnetohydrodynamic (MHD) instabilities, and the appearance of anomalous resistance leads to a jump in voltage (figure 1c) and to a redistribution of current into the interelectrode region, mainly in the proximity to the insulator. Despite the similarity of the Mather-type PF geometry to coaxial plasma accelerators (Marshall guns), the mechanism for generating plasma flow is more like the mechanism observed in conical wire arrays (Lebedev et al. Reference Lebedev, Frank and Ryutov2019). A plasma flow is formed in the pinch region with a diameter of approximately 1 cm and 5–10 cm long. The development of instabilities m = 0 causes an interruption of current, reconnection of magnetic field lines and the formation of a plasmoid with a captured magnetic flux (Krauz et al. Reference Krauz, Paduch, Tomaszewski, Mitrofanov, Kharrasov, Szymaszek and Zielinska2020). The formation of such plasmoids was shown earlier in papers (Kubes et al. Reference Kubes, Krauz, Mitrofanov, Paduch, Scholz, Piszarzcyk, Chodukowski, Kalinowska, Karpinski and Klir2012, Reference Kubes, Paduch, Sadowski, Cikhardt, Cikhardtova, Klir, Kravarik, Munzar, Rezac and Skladnik-Sadowska2019) using laser interferometry and magnetic probes. In figure 1(a) we also show a schematic of the sequential positions of the PCS at different points in time, the formation of a pinch at the end of the anode and the region of propagation of the plasma flow along the axis of the facility.
Magnetic probes (Mitrofanov et al. Reference Mitrofanov, Krauz, Grabovski, Myalton, Paduch and Gritsuk2018) were introduced into the vacuum chamber through one of the side flanges, and the optic frame camera HS-1F-VISC was placed on the other flange. The HS-1F-VISC camera with an exposure time of 3 ns made it possible to obtain optical frame images of a plasma flow on a CCD matrix (2048 × 2048 pixels) with a centre of the frame at a distance of 41.5 cm from the anode surface, which almost coincides with the position z 1 of one of the magnetic probes (see figure 1). The field of view of the optical camera in the region close to the axis of the experimental chamber was approximately 24 cm, and the spatial resolution at the position of the object was 0.96 lines mm−1 (or 0.1017 mm pixel−1 in a digital image). The spectral sensitivity of the S-25 type multi-alkaline cathode of the optical camera lays in the wavelength range 400–900 nm. This wide range captures all the main characteristic lines of the gases we use.
The derivative of the total current was recorded by a loop sensor with a sensitivity of (1.73 ± 0.14) × 1012 A (V⋅s)−1. The moment of the dip in the derivative of the total current coincides with the moment of the plasma flow generation during pinching the plasma at the facility anode end with high accuracy. Therefore, this moment of time is chosen as the zero-time moment for all the graphs presented in this paper. The total discharge current was recorded with a Rogowski coil with a sensitivity of 470 kA V−1.
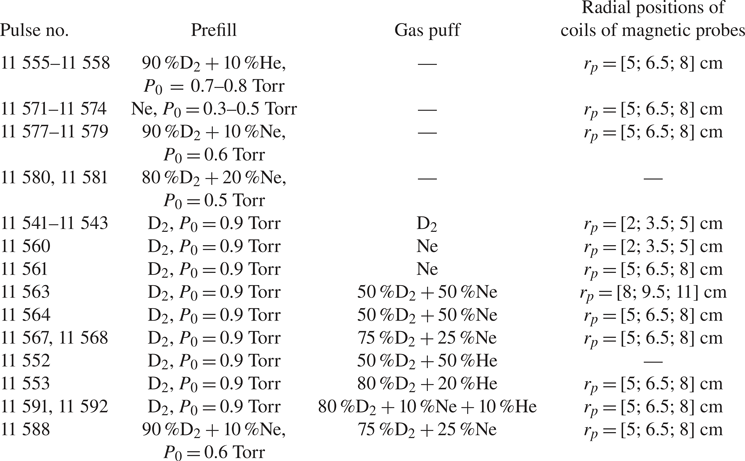
In the series of experiments presented in this work, deuterium was used as the main working gas instead of hydrogen, because the PF-1000 facility is best optimized for working with deuterium to solve other problems (generating and studying neutron fluxes). Admixtures of He or Ne gases could be added to the main gas. In each case, this will be mentioned separately (see table 1). The experiments were carried out in various modes of gas filling: prefill of the facility chamber to a pressure of P 0 = 0.7–0.9 Torr (for D2 or for a mixture of D2 + 10 % He), 0.3–0.5 Torr (for Ne), 0.5–0.6 Torr (for a mixture of D2 + (10–20) % Ne) and combined prefill and gas puff in the chamber. Gas puff was carried out using a controlled valve with the nozzle installed inside the anode electrode along its axis (see figure 1). This made it possible to perform a controlled injection of a portion of gas into the axial region of the facility, where the final compression of the PCS takes place. The gas pressure under the valve was 1.2 atm. The operation of the gas valve occurred 2 ms before the start of the discharge. As the gas escapes into the vacuum with hydrodynamic times, the gas distribution during a discharge time of several tens of microseconds can be considered constant but profiled with density decreasing with the distance from the flow generation area, which corresponds to real astrophysical objects (Beskin et al. Reference Beskin, Chernoglazov, Kiselev and Nokhrina2017b).
Parameters of experiments.

In the combined mode of gas injection, it was possible to vary both the pressure distribution in the chamber, thereby creating a different density of the background gas in the region of axial plasma flow propagation, and the type of gas (D2 or Ne) ejected by the nozzle from the centre of the anode electrode along the axis of the facility. Thus, the application of two modes of filling of the working gas into the chamber of the facility made it possible to create different conditions in the region of compression of PCS and formation of the pinch and in the region of further propagation of the plasma jet in the drift space of the chamber.
The experiments were performed with the total energy stored in the capacitor bank at approximately 170 kJ at a charging voltage of 16 kV, and the amplitude of the discharge current was up to 1.8 MA.
2.2. Technique for measuring the radial distribution of the magnetic field in a plasma flow
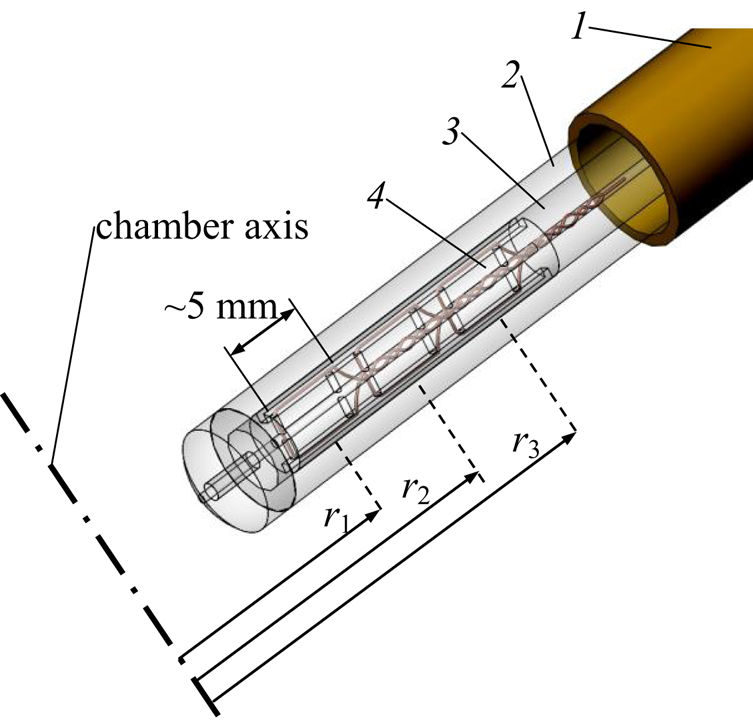
Information on the magnitude and distribution of the magnetic field inside the plasma is important for understanding the physics of generation and propagation of astrophysical jets. Therefore, one of the main diagnostic methods in this series of experiments was the magnetic probe technique, which made it possible to study the magnetic field captured by the plasma flow. We constructed a multichannel magnetic probe for performing experiments to study the radial distribution of the azimuthal (toroidal) magnetic field in the axial plasma flow during its propagation in the drift space of the facility chamber. The sensitive element of the probe (see figure 2) consisted of three coils, the areas of which are oriented in such a way as to measure the Bφ field. Three such magnetic probes were located at distances z 1 = 40 cm, z 2 = 60 cm and z 3 = 74 cm from the end face of the anode, as shown in figure 1. The vacuum inlet into the vacuum chamber made it possible to move the probes in the radial direction.
The design of the sensing element of the three-channel magnetic probe for measuring the radial distribution of the azimuthal component of the magnetic field in the plasma flow: 1, metal body of the probe; 2, glass tube with a diameter of 3 mm; 3, shell setting the orientation of the coils with respect to the Bφ field; 4, one of the coils; r 1, r 2, r 3, radial distances from the locations of the coils to the axis of the vacuum chamber of the facility, the distances between the coils r 2–r 1 = r 3–r 2 = 15 mm.

Thus, each probe measured the induction of the azimuthal component of the magnetic field (Bφ) at three points along the radius of the chamber. The properties of the magnetic probes were as follows: the distances between the centres of the probe coils were 15 mm, the size of one coil was 5 × 3 mm, the number of turns in the coil was 5, the spatial resolution was determined by the dimensions of the coil along the radius and was approximately 5 mm, the temporal resolution was no worse than 1.5 ns and the sensitivity of the probe coils was (3.3–7.5) × 10−9 V (G s)−1. Calibration was carried out in a uniform field of the Helmholtz coil relative to the known area of the reference (gauge) loop. The oscillating circuit allowed damped oscillations to be generated with a frequency of around 7 MHz and a quarter of the period of 35 ns. The probes confidently registered these oscillations. This is quite sufficient for our needs. It should be noted that all coils of the magnetic probe were calibrated both by the magnitude of the magnetic field induction vector and by its direction. The calibration accuracy of magnetic probes was no worse than 5 %. The accuracy of magnetic field measurements in the plasma flow was 15–20 %. It is known that the signal from the probe coil is proportional to the derivative of the induction of the azimuthal magnetic field at the measurement point,  $\partial B\varphi /\partial t$. To obtain the time dependence of the magnetic field induction, the signal from the probe was numerically integrated taking into account the obtained calibration coefficients. As the measurements of the magnetic field were carried out with a spatial resolution in radius, it seems possible to study the dependence of the magnitude and direction of the magnetic field on the radius at different times during the passage of the plasma flow next to the probe. This allows new information to be obtained about the currents flowing over the cross-section of the plasma flow, for example, in its axial part and on the periphery.
3. Experimental results
In this section we present the results of measurements of the azimuthal magnetic field inside the axial flow formed from the plasma of various working gases (deuterium, neon, helium and a mixture of these gases) under various modes of filling the vacuum chamber of the facility with gas. The results of magnetic measurements are compared with the data of optical frame recording.
First, let us consider the results of experiments with prefill with deuterium or neon, as well as their mixtures.
3.1. Study of plasma flows when prefilling the vacuum chamber with working gas
3.1.1. Prefilling with deuterium
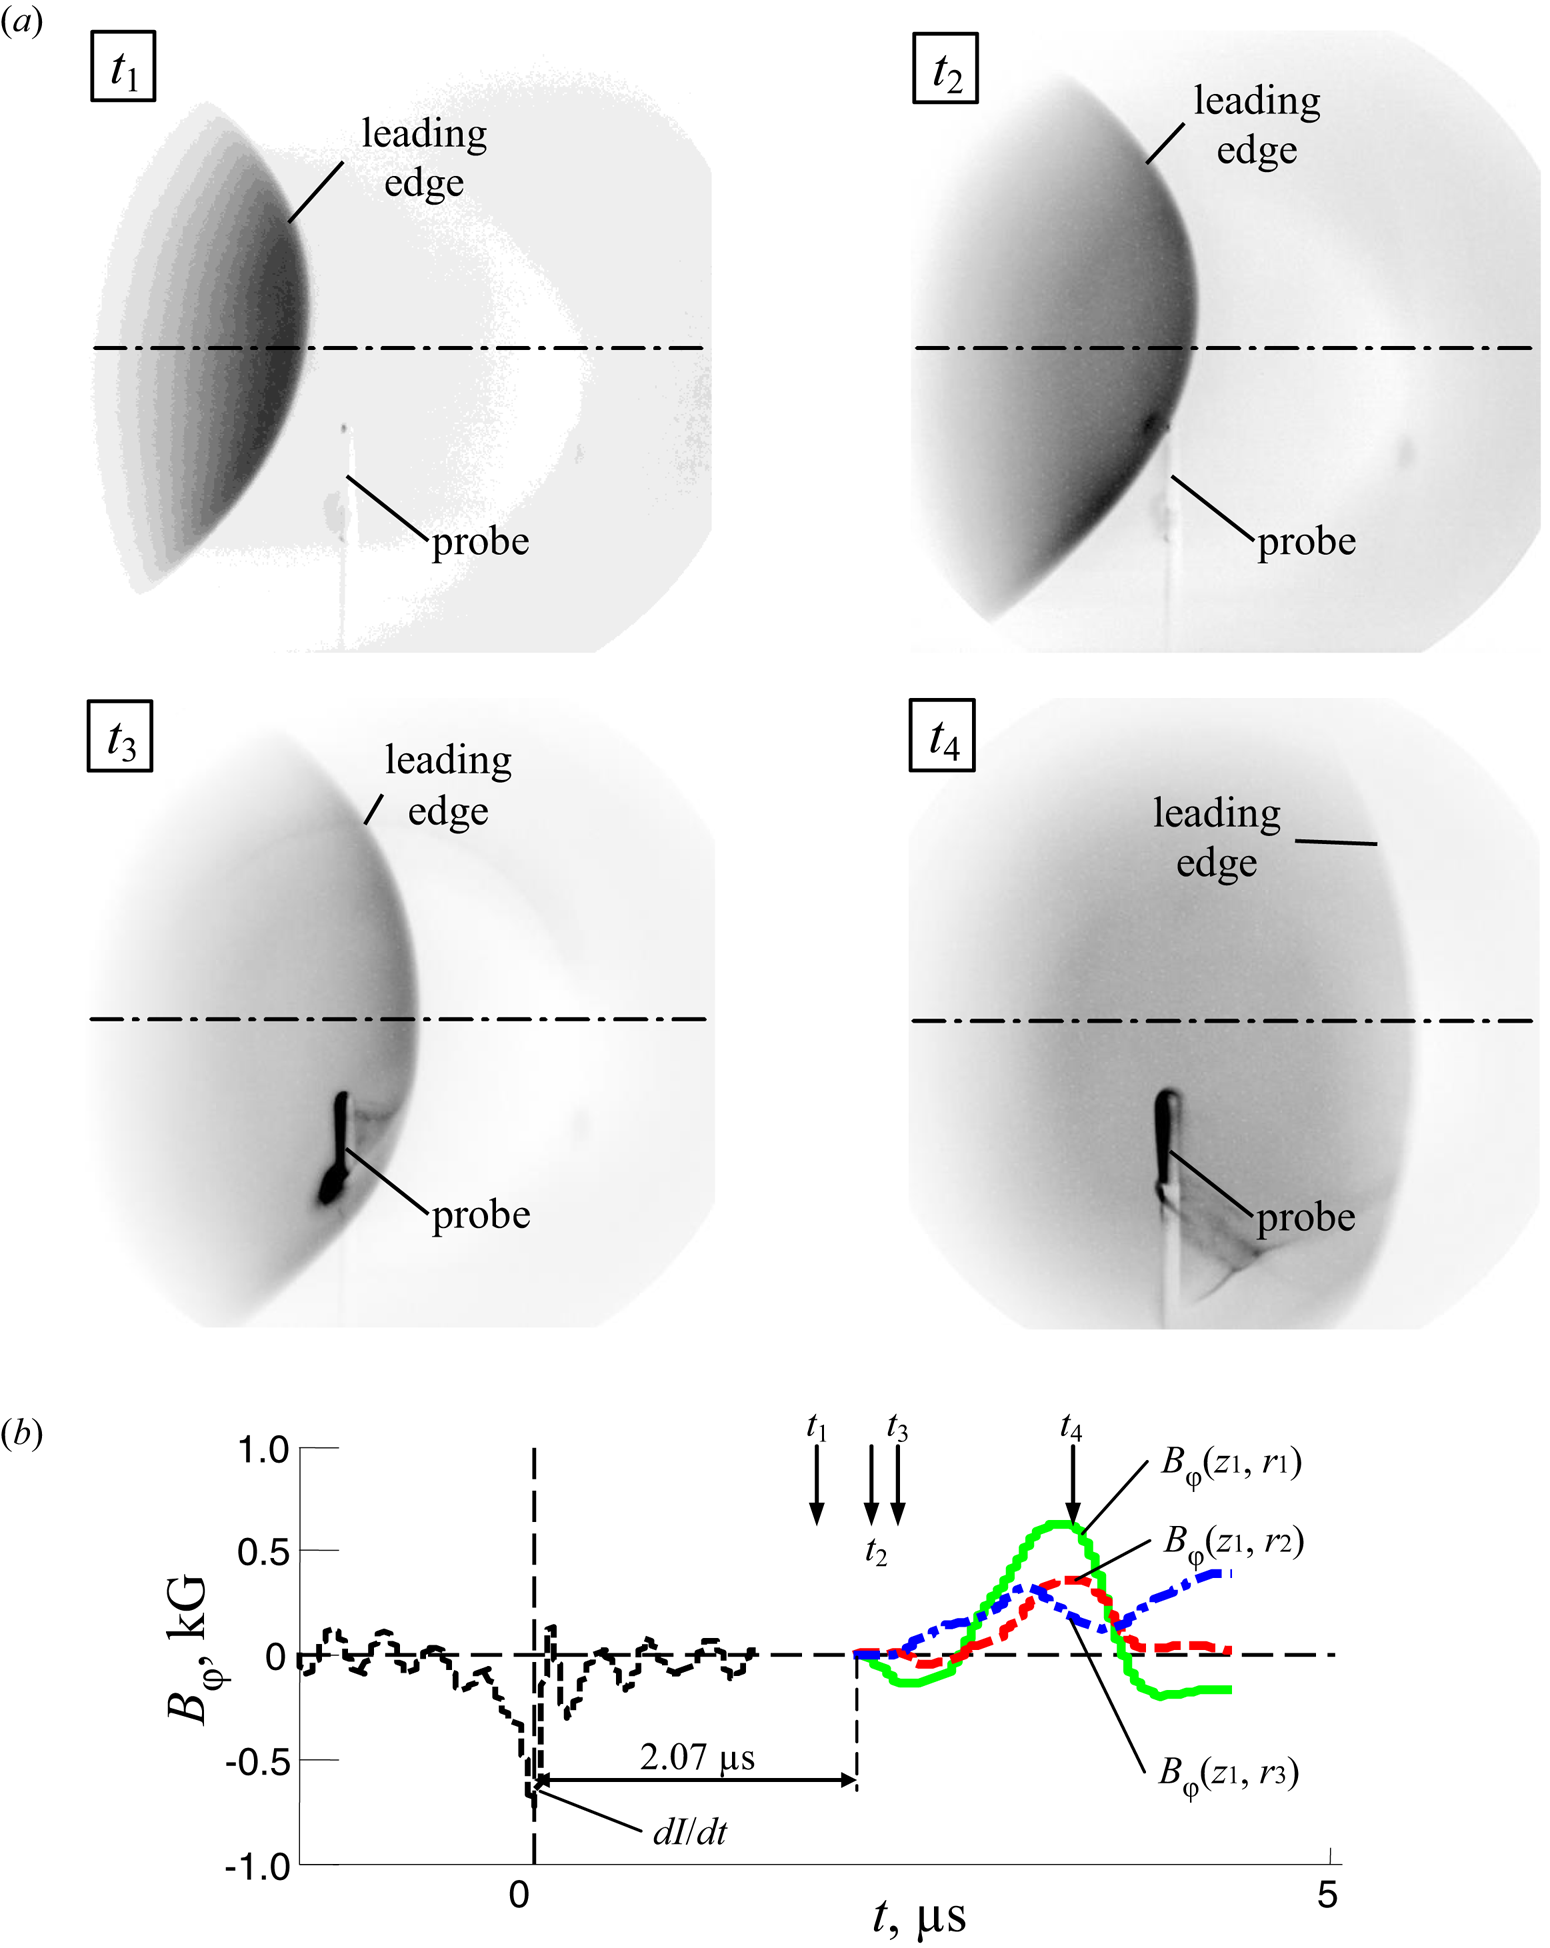
In figure 3 we present the results of experiments on studies of the axial plasma flows under conditions of prefilling with deuterium with a small diagnostic (for spectral purposes) addition of helium (not more than 10 % of the mixture pressure). The initial pressure of the working gas in the facility chamber was 0.7–0.8 Torr in this case. A single-frame optical camera was used in these experiments. However, because the reproducibility of the main parameters of the discharge, such as the amplitude of the current, voltage and the moment of generation of the plasma flow (the moment of the dip in the profile of dI/dt), was high, it seemed possible to analyse the dynamics of the propagation of the plasma flow in the drift space using optical frame images obtained in several discharges, but at different moments of time: the signals of magnetic probes in different discharges were also similar.
The results of studies of the plasma flow (pulses 11 555–11 558, prefilled with gas 90 % D2 + 10 % He, P 0 = 0.7–0.8 Torr, U 0 = 16 kV, W 0 = 170 kJ). (a) Optical frame images of the plasma flow wrapping around the magnetic probe in the position r = 5 cm, z 1 = 40 cm at different times (shown by arrows ↓ in figure 3b), measured from the moment of the sharp dip in the time dependence of dI/dt: t 1 = 1.8 μs (pulse 11 558), t 2 = 2.1 μs (pulse 11 557), t 3 = 2.3 μs (pulse 11 556) and t 4 = 3.3 μs (pulse 11 555). Exposure of the frames is 3 ns. (b) The results of measurements of magnetic fields in a plasma flow at a distance z 1 = 40 cm from the end surface of the anode and at radii of 5, 6.5 and 8 cm in pulse 11 555. Time dependences are: dI/dt is the derivative of the total current; Bφ(z 1,ri) is the induction of the azimuthal magnetic field.

In figure 3(a) we show optical frame images of a plasma flow captured by a single-frame optical camera in several discharges. It can be seen from this figure that the leading edge of the plasma flow in all cases has a clear boundary without visible instabilities and no internal structures are visible. The position of the magnetic probe is also clearly visible in the frames. For a qualitative analysis, we selected four cases with different positions of the probe relative to the flow: in front of the leading edge of the flow (time t 1), at the front of the flow (time t 2), in the body of the flow (time t 3) and in its tail (time t 4). In figure 3(b) we show the time dependences of the induction of the Bφ field measured by the magnetic probe at position z 1 in discharge number 1155. The arrow t 1 marks the moment when the corresponding optical frame in figure 3(a) is taken. It can be seen that before the arrival of the plasma front, the magnetic probe shows a zero level of the signal.
Comparison of magnetic measurements at the position z 1 = 40 cm and optical frames shows that only when the magnetic probe is inside the plasma flow does it begin to reliably detect the magnetic field (see the optical frames at times t 2 and t 3). As can be seen from the optical frame images, a slight perturbation of the leading front of the plasma occurs when the plasma flows around the magnetic probe. The maximum level of the magnetic field recorded by the probe was approximately 600 G for a coil at a radius of 5 cm. At this point in time (see frame t 4 in figure 3a), the magnetic probe was already deep inside the volume occupied by the plasma flow. It should be noted that such localization of the magnetic field was also observed in experiments on the generation of axial plasma flows at the PF facility KPF-4-Phoenix (Mitrofanov et al. Reference Mitrofanov, Ananyev, Voitenko, Krauz, Astapenko, Markoliya and Myalton2017b). In these experiments, it was shown that the magnetic field captured by the plasma flow is mainly concentrated in the regions of weak optical glow, in the so-called magnetic bubbles. Magnetic bubbles are regions with reduced plasma density, whereas the leading front of the plasma flow is a shock front that emits intensely in the visible spectrum.
Magnetic measurements at radii of 5, 6.5 and 8 cm at position z 1 showed (see the curves Bφ(z 1, r 1), Bφ(z 1, r 2) and Bφ(z 1, r 3) in figure 3(b) the decaying dependence of the field on the radius  ${B_\varphi }(r)\propto 1/{r^n}$, which may be due to the so-called central current flowing in the near-axis region of the plasma flow. A small number of measuring points of the magnetic field along the radius did not allow a detailed study of the dependence of the Bφ field on the radius; this will be done in the forthcoming experiments.
However, it should be noted that the optical frame images in figure 3(a) do not show structures that could be associated with the central current flow region, only the front of the flow is observed. It is possible that this situation arises due to the ‘burnout’ of optical levels in the radiation spectrum of deuterium plasma.
3.1.2. Prefilling with neon
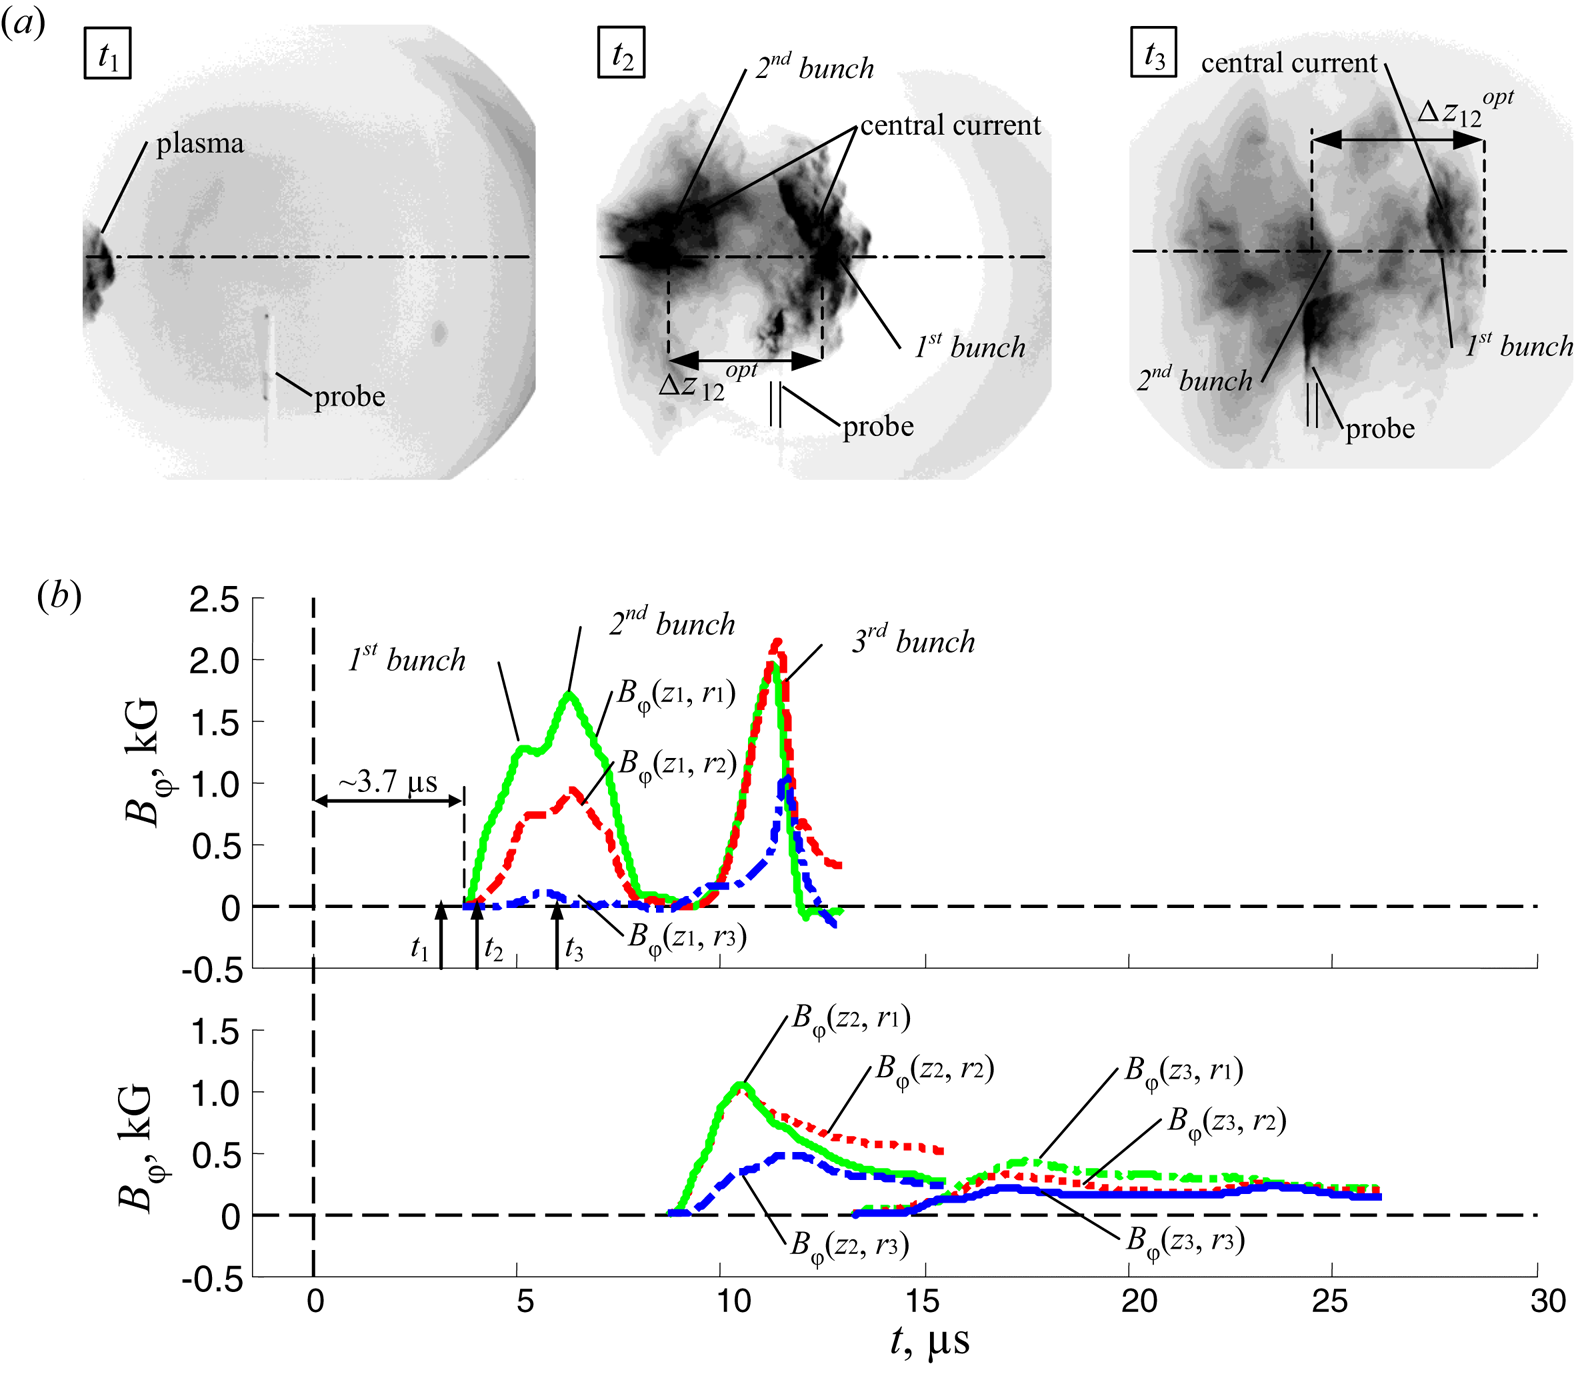
This section presents the results of experiments on the generation of axial plasma flow under prefilling of the facility chamber with neon to a pressure of 0.3–0.5 Torr. The use of another type of gas with a high atomic number (Z = 10) made it possible to study the dynamics of the propagation of a plasma flow in the presence of high losses of internal plasma energy to radiation. In this case, it was possible to obtain a structure of the plasma flow, especially its leading front, which is different from experiments with deuterium. The process of passage of the plasma flow around the magnetic probe at the position z 1 was recorded in a series of optical frames taken at moments of time t 1–t 3 as shown in figure 4(a). As can be seen on these optical frame images, the leading edge of the plasma flow is no longer quasi-spherical, as in the experiments with deuterium (see figure 3a), but rather has a conical shape. The outer boundary of the plasma flow has a pronounced pattern, apparently due to the development of MHD instabilities. The axial region of the plasma flow is pronounced. Intense emission is observed from the axial region in the optical range of the spectrum. The high emission of optical radiation from the central part of the flow may indicate higher density and higher temperature of the plasma in this region compared with plasma at the periphery of the plasma flow (at its outer boundary).
The results of studies of the plasma flow (pulses 11 572–11 574, prefilled with Ne, P 0 = 0.3–0.5 Torr, U 0 = 16 kV, W 0 = 170 kJ). (a) Optical frame images of a plasma flow wrapping around the magnetic probe at a position r = 5 cm, z 1 = 40 cm at different times (shown by arrows ↑ in figure 4b): t 1 = 3.2 μs (pulse 11 572), t 2 = 4.3 μs (pulse 11 573) and t 3 = 5.7 μs (pulse 11 574), measured from the moment of the sharp dip in the time dependence of dI/dt. Exposure of the frames is 3 ns. (b) The results of measurements of magnetic fields in a plasma flow at distances z 1 = 40 cm, z 2 = 60 cm and z 3 = 74 cm from the end surface of the anode at radii of 5, 6.5 and 8 cm in pulse 11 573. Time dependences are: Bφ(z 1,ri), Bφ(z 2,ri), Bφ(z 3,ri) are the inductions of the azimuthal magnetic field.

From the probe measurements of the magnetic field (see the curves Bφ(z 1, r 1), Bφ(z 1, r 2) and Bφ(z 1, r 3) in figure 4b) it can be seen that the signals from three coils of the magnetic probe, located at radii 5, 6.5 and 8 cm, do not begin at the same time. The time delay between the signals from the nearest coil at a radius of r 1 = 5 cm and the second coil at a radius of r 2 = 6.5 cm is ~180 ns, and from the nearest coil to the farthest coil at a radius of r 3 = 8 cm is ~890 ns. At the same time, the farthest coil recorded a low level of magnetic field of approximately 100 G, which is comparable with the measurement error. Thus, at the stage of passage of the plasma flow at position z 1, the magnetic field Bφ(r) decreases with an increase in radius stronger than  $1/r$. As follows from the frame optical recording, this behaviour of the probe signals can be explained by the conical-like shape of the leading edge of the plasma flow. Indeed, during the passage of the plasma flow with such shape of the leading edge, the coil of the magnetic probe, which is closest to the axis of the chamber, happens to enter the volume of the plasma flow with the localized magnetic field sooner. The farthest coil of the probe is on the periphery of the plasma flow, where the value level of the magnetic field is small. Thus, we can assume that the external boundary of the region of the plasma flow, where the magnetic field is concentrated, is close to the radius r 3 = 8 cm.
It should be noted that in this shot the time dependences of the magnetic field measured by the probe at position z 1 have a two-humped shape. The time interval Δt between the two humps was ~1.1 μs. This behaviour of the time dependence of the Bφ field can be associated with the passage of two bunches closely adjacent to each other (see, for example, frames t 2,3 in figure 4a). The delay between the moment of generation of the plasma flow and the start of the signal acquisition by the probe at position z 1 is approximately 3.7 μs, which corresponds to the average velocity  ${V_{z01}}\sim {10^7}\;\textrm{cm}\;{\textrm{s}^{ - 1}}$ of the propagation of the plasma flow along the camera axis at the span base (0–z 1). From the delay Δt between two humps on the signal from the magnetic probe, we can estimate the distance Δz 12 between two closely spaced bunches as follows
 ${\Delta }z_{12}^{\textrm{mag}} = {V_{z01}}{\Delta }{t_{12}} \approx 11\;\textrm{cm}$. This is an upper estimate of Δz 12 because, owing to the deceleration of the flow, the velocity in the detection region is less than the average velocity determined previously. It should be noted that in the optical frame image (see frame t 3 in figure 4b), the two outer boundaries of the bunches following one after another are clearly visible. The distance between them is approximately
 ${\Delta }z_{12}^{\textrm{opt}} \approx 7\textrm{--}9\;\textrm{cm}$, which is comparable with the
 ${\Delta }z_{12}^{\textrm{mag}}$ estimate made previously. We also note that in this shot the magnetic probe at position z 1 detected the passage of yet another region (third bunch) with high level of the magnetic field much later (after ~6.3 μs). This third bunch was not visible in the optical frame image because it was travelling with a long time delay and, therefore, had not yet had enough time to come into the field of view of the optical recorder, the frame exposure of which was only 3 ns.
From the nature of the time dependences measured by magnetic probes at various distances from the end surface of the anode, it follows that the magnetic field in the plasma flow decays strongly (around six or seven times) as it propagates in the drift space of the facility chamber (see curves Bφ(z 1,ri), Bφ(z 2,ri) and Bφ(z 3,ri) in figure 4b). However, the distant coil at the radius of 8 cm shows a relatively high signal level, that is, this coil turns out to be immersed in the plasma flow. The latter circumstance indicates either the displacement of the flow relative to the axis or, most likely, the expansion of the flow as it propagates along the chamber. One of the reasons for the attenuation of the magnetic field may be the development of instabilities at the outer boundary of the plasma flow during its interaction with the background gas in the facility chamber. The duration of the probe signals also increases as the flow propagates along the axis, which may be due to both the expansion of the plasma bunch with a trapped magnetic field in the longitudinal direction and a decrease in its velocity. Indeed, from the time delays measured between the beginnings of the signals from the probes at positions z 1, z 2 and z 3, it follows that the flow is decelerated at the span between z 1 and z 3. In this case, the average propagation velocity Vz of the plasma flow along the chamber axis decreases from 4.0 × 106 cm s−1 to (2.5–3.0) × 106 cm s−1.
3.1.3. Prefilling with a mixture of deuterium and neon
Investigations of plasma flows in discharges in neon allowed us to analyse the effect of radiation losses on the flow structure. However, the PF-1000 facility is optimized for deuterium, which results in inefficient plasma compression during pinching in discharges with neon. Therefore, experiments were carried out using a mixture of working gases of deuterium and neon, which allowed the discharge to be optimized using deuterium while maintaining high radiation losses owing to the presence of a significant amount of neon. In this case, the chamber of the facility was filled with a mixture of gases D2 + (10–20) % Ne as a working gas to a prefill pressure P 0 = 0.5–0.6 Torr.
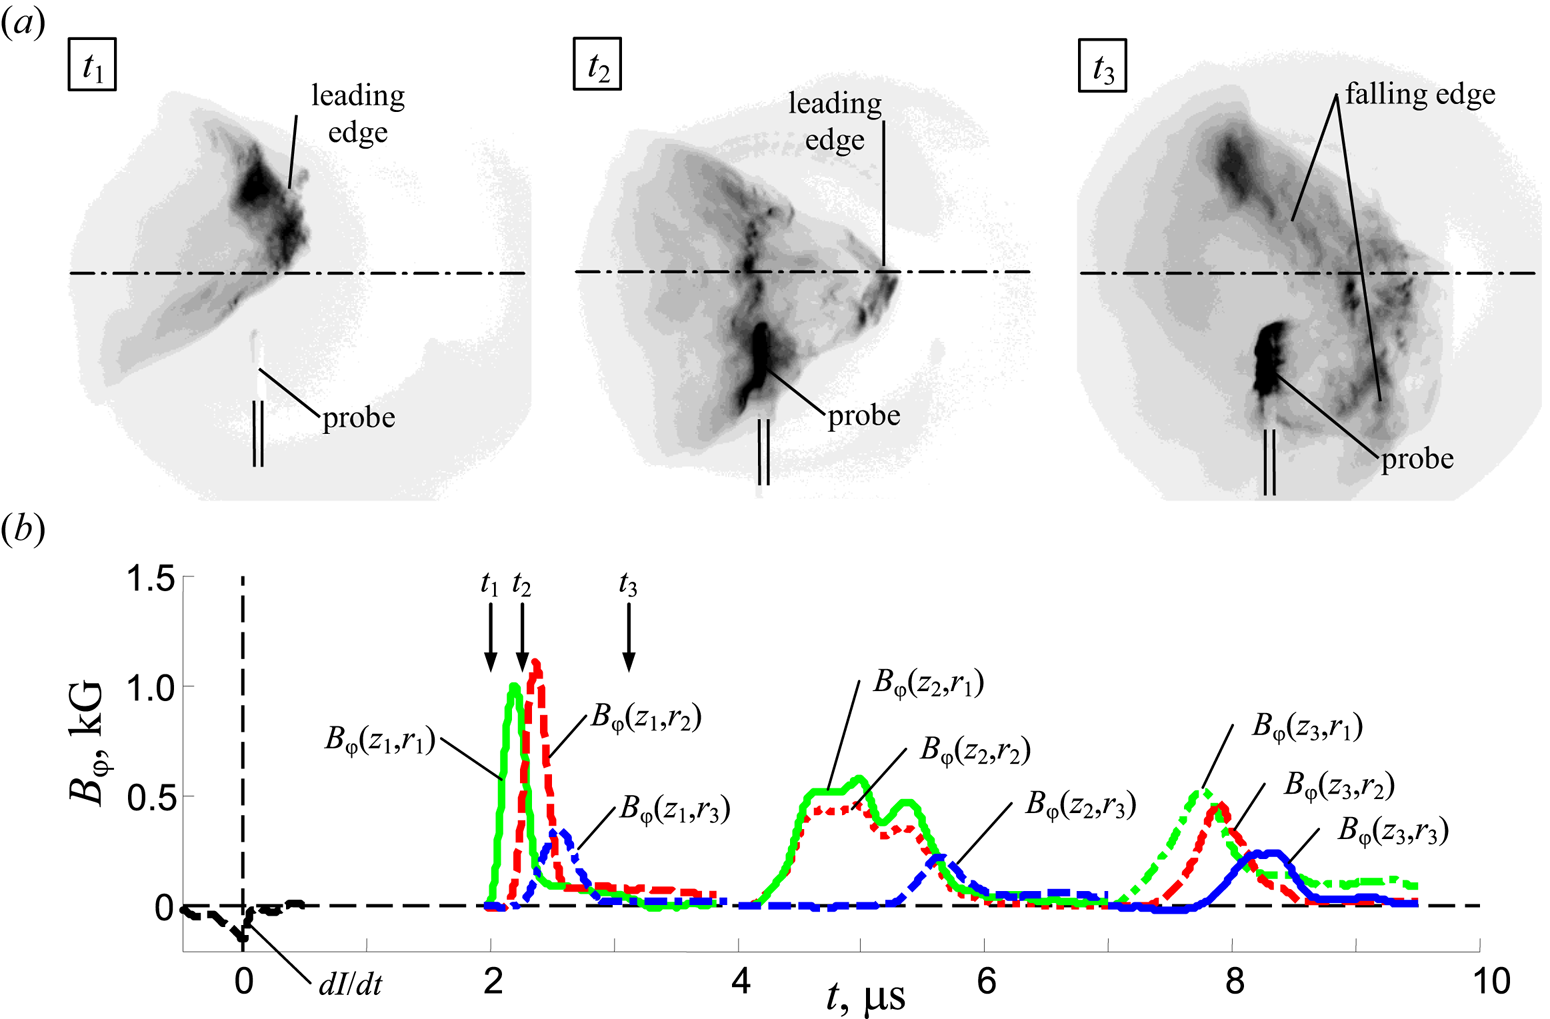
In experiments with a D2 + (10) % Ne gas mixture, the passage of the plasma flow by the magnetic probe at position z 1 was recorded in optical frame images (see figure 5a). As in previous cases, frame images were obtained in different shots with similar discharge characteristics, so it seems possible to analyse them together. Thus, on frames t 1 and t 2 it is visible that the leading edge of the plasma flow has a pronounced conical shape in this case, and the trailing edge of the flow, its tail, has a ragged structure (see frame t 3). A comparison of the optical frame recording data and measurements of the Bφ field shows (see curve Bφ(z 1) in figure 5b) that at time t 1, when the leading conical front of the plasma flow has not yet reached the position z 1 of the magnetic probe, the probe does not register any level of magnetic field. Later, at time t 2, when the leading edge of the plasma flow has reached the magnetic probe and the probe is partially immersed in the plasma volume, the nearest two probe coils at r 1 = 5 cm and r 2 = 6.5 cm record a high magnetic field level of 1–1.1 kG. At the same time, the third, farthest probe coil at r 3 = 8 cm, registers a significantly lower magnetic field level of approximately 350 G, because it is located on the periphery of the plasma flow, where the magnetic field of the central current is small. The non-simultaneous appearance of signals from the coils of the magnetic probe is in good agreement with the conical shape of the flow front, which causes the coils at different heights to be immersed in the plasma flow at different times. After the plasma flow has moved completely ahead of the position of the magnetic probe (moment t 3), the probe registers practically no magnetic field.
The results of studies of the plasma flow (pulses 11 577–11 579, prefilled with 90 % D2 + 10 % Ne, P 0 = 0.6 Torr, U 0 = 16 kV, W 0 = 170 kJ). (a) Optical frame images of the plasma flow incident on a magnetic probe in position r = 5 cm, z 1 = 40 cm at different time moments (shown by arrows ↓ in figure 5b): t 1 = 2.0 μs (pulse 11 578), t 2 = 2.2 μs (pulse 11 579) and t 3 = 3.1 μs (pulse 11 577) counted from the moment of the sharp dip in the time dependence of dI/dt. Exposure of the frames is 3 ns. (b) The results of measurements of magnetic fields in a plasma flow at distances z 1 = 40 cm, z 2 = 60 cm and z 3 = 74 cm from the end face of the anode at radii of 5, 6.5 and 8 cm (pulse 11 579). Time dependences are: dI/dt is the derivative of the total current; Bφ(z 1,ri), Bφ(z 2,ri), Bφ(z 3,ri) are the inductions of the azimuthal magnetic field.

In addition, magnetic field attenuation is observed (see curves Bφ(z 1,ri), Bφ(z 2,ri) and Bφ(z 3,ri) in figure 5b) during the propagation of the plasma flow in a background mixture of deuterium and neon gases, as in the case of an axial plasma flow consisting of neon. In the case under consideration, the magnetic field decreases by around half, and the duration of the signal from the probe measured at position z 1 is shorter than the durations of the signals from the probes at positions z 2 and z 3.
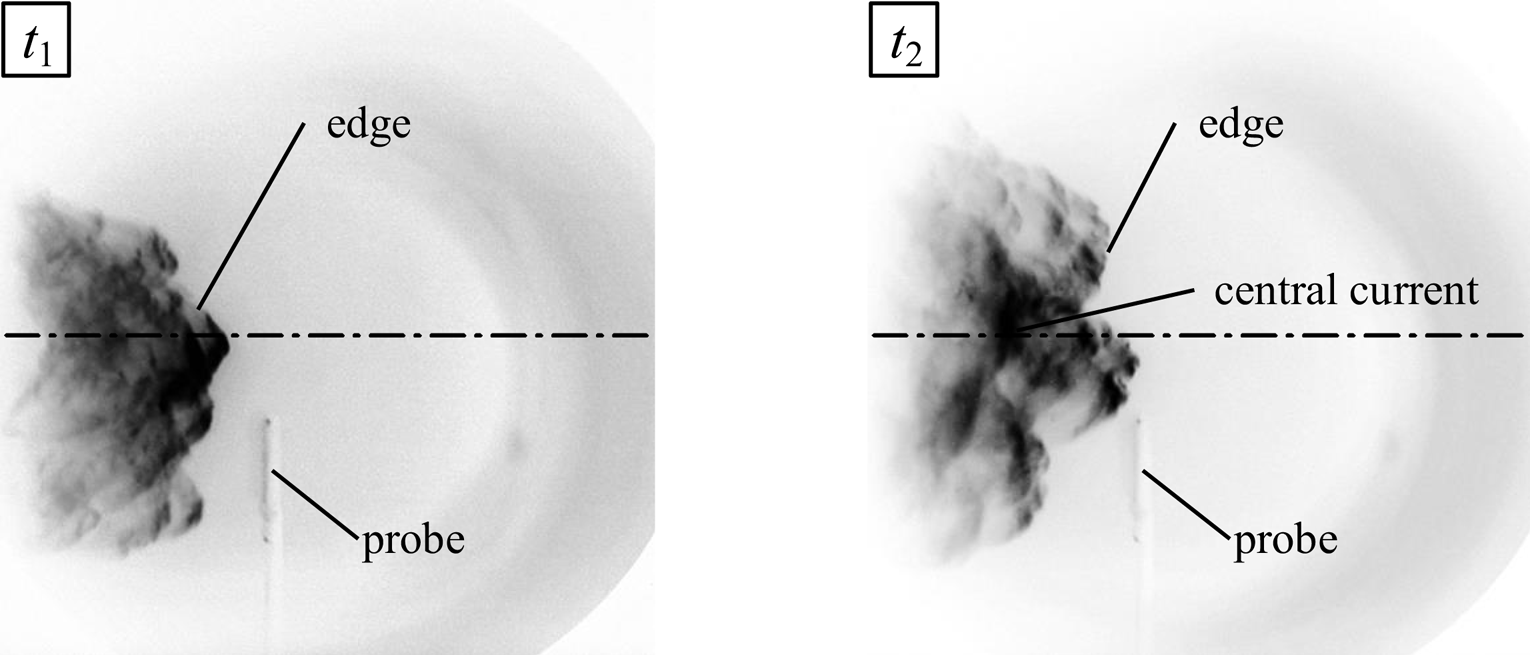
An increase of the neon fraction in the pressure of the working gas mixture from 10 % to 20 % leads to a change in the structure of the head front of the plasma flow (see the optical frames in figure 6). In this case, the shape of the outer boundary of the plasma flow looks more unstable than in the case of low neon content. It approaches the shape of the front at discharge in pure neon. Most likely, such a change in the shape of the outer boundary of the plasma flow is due to processes occurring at this outer boundary (ionization of the background gas, MHD instabilities) during interaction of the plasma flow with the background gas.
The results of studies of the plasma flow (pulses 11 580 and 11 581, prefilled with 80 % D2 + 20 % Ne, P 0 = 0.5 Torr, U 0 = 16 kV, W 0 = 170 kJ). Optical frame images of the plasma flow incident on the magnetic probe in position r = 5 cm, z 1 = 40 cm at different time moments: t 1 = 1.9 μs (pulse 11 580) and t 2 = 2.2 μs (pulse 11 581) counted from the moment of the sharp dip in the time dependence of dI/dt. Exposure of the frames is 3 ns.

3.2. Study of plasma flows generated under a combination of prefilling and axial gas puff
In the following, we consider the results of experiments on the generation of axial flows under conditions of a combined mode of filling the facility chamber with gas. The combined mode of filling with gas allowed the initial conditions to be changed both in the region of axial flow generation and in the region of flow propagation. The remaining experimental conditions were the same as for the prefilling with gas experiments.
3.2.1. Prefilling with deuterium and gas puff with deuterium
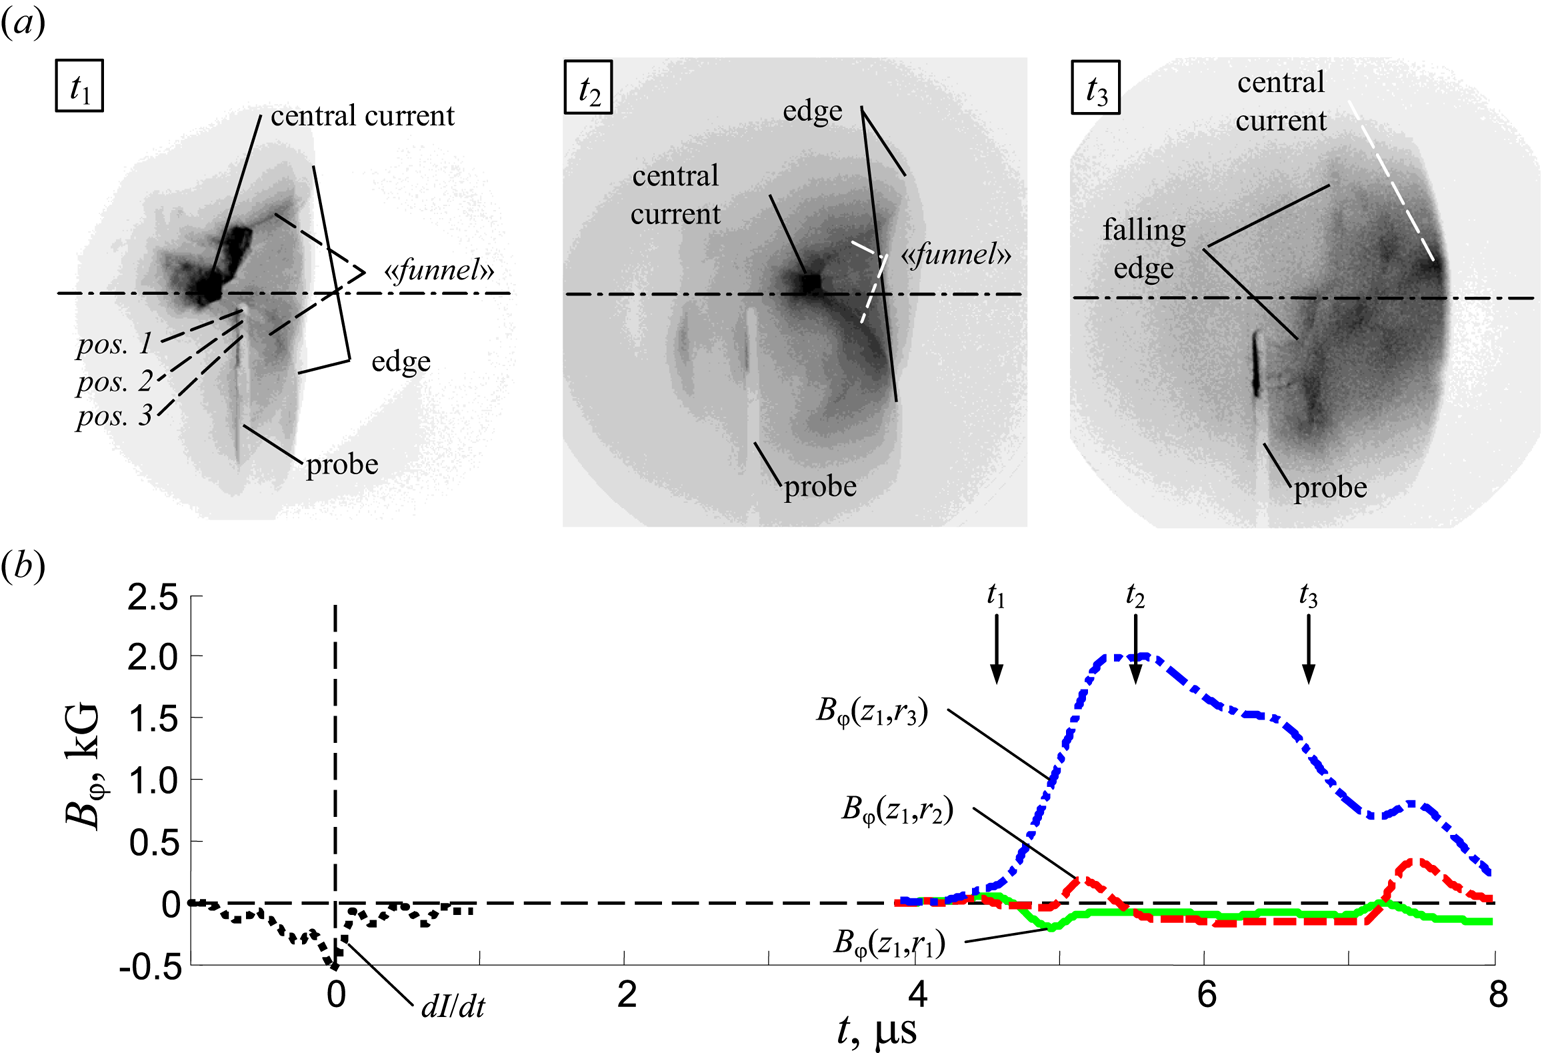
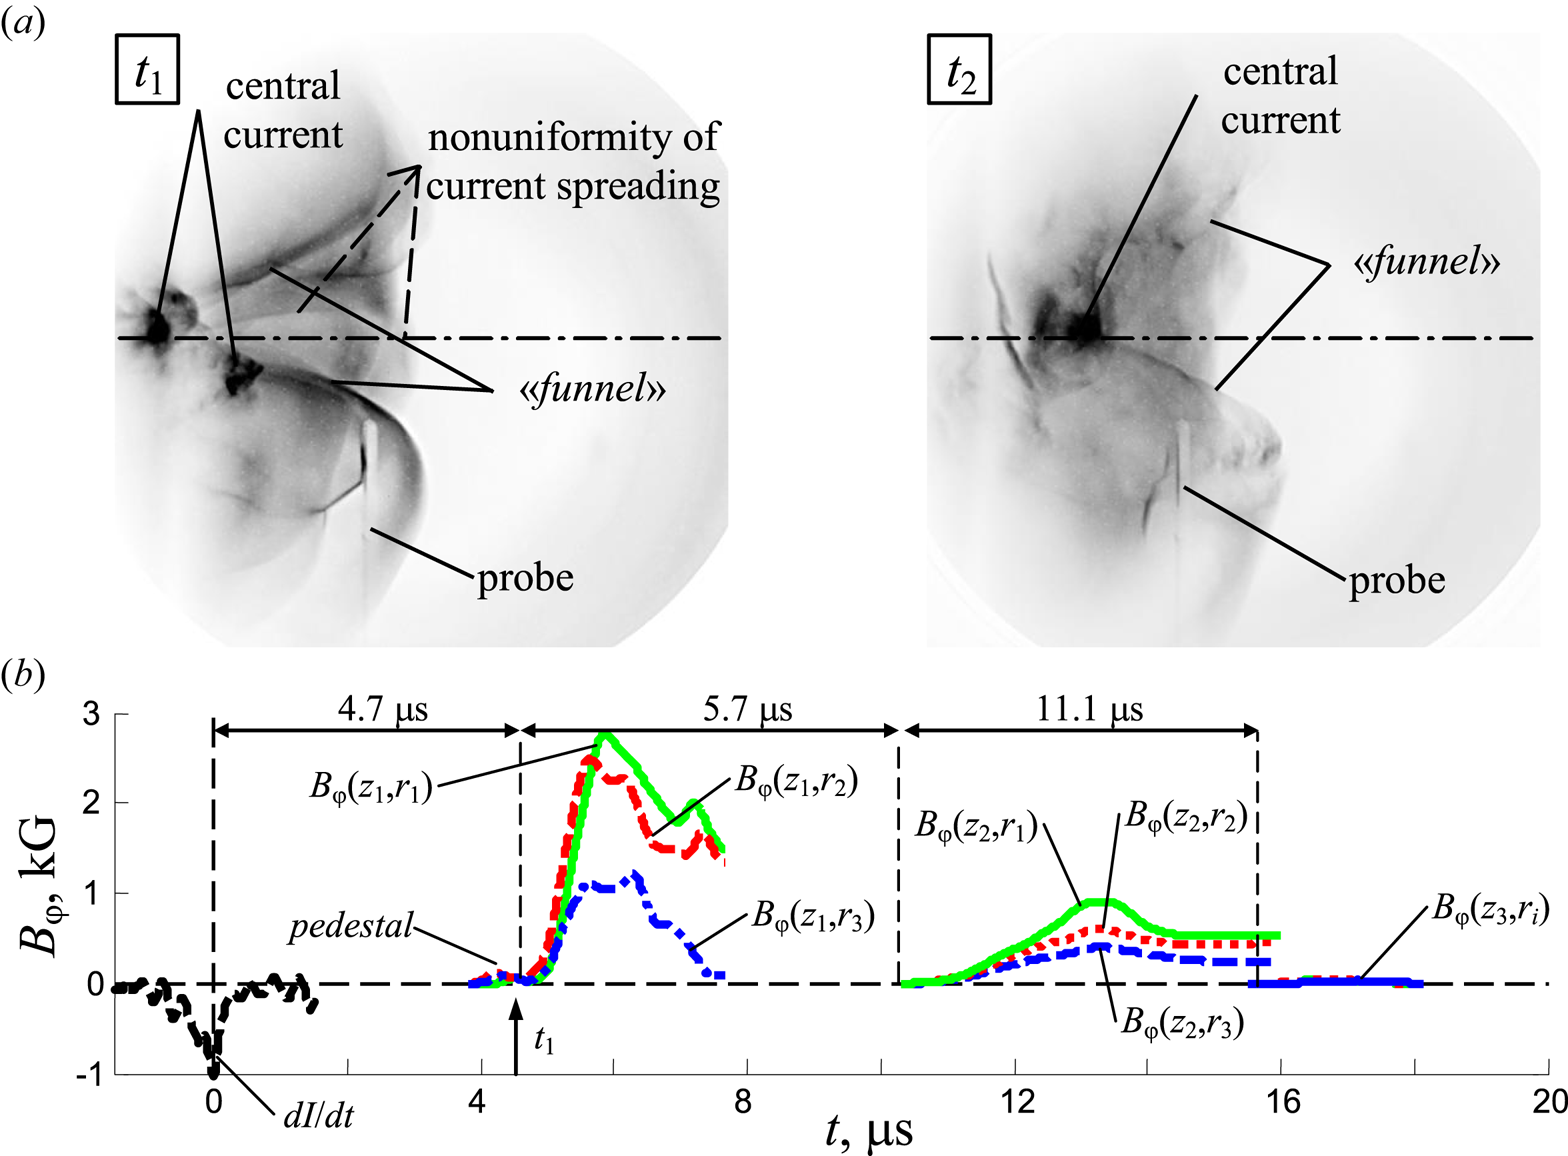
First, we consider experiments with only one type of working gas, when the facility chamber was prefilled with deuterium to an initial pressure of P 0 = 0.9 Torr and deuterium puff was made in the region close to the anode axis 2 ms before the discharge was started. In figure 7 we show the optical frame images of the plasma flow in the vicinity of the magnetic probe installed at position z 1 and the results of magnetic field measurements. In images obtained at time moments t 1 and t 2, a funnel-like structure (‘funnel’) is observed at the leading edge of the flow, and a clearly defined region of increased plasma glow is observed in the centre of the plasma flow. This result is fundamentally different from the case of only prefilling with deuterium, considered in § 3.1, when the leading edge of the plasma flow had a quasi-spherical shape (see figure 3a). It should be noted that, regardless of the method of filling the chamber with deuterium, the pronounced instabilities seem absent at the outer boundary of the leading front of the plasma flow.
The results of studies of the plasma flow (pulses 11 541–11 543, combined mode of filling with gas: prefilled with D2, P 0 = 0.9 Torr and gas puff of D2, U 0 = 16 kV, W 0 = 170 kJ). (a) Optical frame images of the plasma flow incident on a magnetic probe in position r = 2 cm, z 1 = 40 cm at different times (shown by arrows ↑): t 1 = 4.6 μs (pulse 11 541), t 2 = 5.5 μs (pulse 11 542) and t 3 = 6.7 μs (pulse 11 543) measuring from the moment of sharp dip in the profile of dI/dt. Exposure of the frames is 3 ns. (b) The results of measurements of magnetic fields in a plasma flow (pulse 11 541) at a distance z 1 = 40 cm from the anode end and at radii of 2 cm (position 1), 3.5 cm (position 2) and 5 cm (position 3). Time dependences of dI/dt, the derivative of the total current, and of Bφ(z 1,ri), the induction of the azimuthal magnetic field, are plotted.

The magnetic probe in this experiment was located close to the axis of the facility chamber. Namely, the first coil of the probe was located only at r = 2 cm (see position 1 in the frame t 1 in figure 7a), the other two were located at r = 3.5 cm and at r = 5 cm (positions 2 and 3, respectively). At the moment of passage of the plasma flow around the magnetic probe, the two coils closest to the axis of the facility were inside the ‘funnel’ at the leading edge of the flow, as can be seen in the optical frame at time t 1, but the farthest coil was already inside the plasma flow, where the magnetic field was localized.
Moreover, the curves Bφ(z 1,r 1), Bφ(z 1,r 2) and Bφ(z 1,r 3) have different behaviour (see figure 7b). Two coils closest to the axis of the chamber, located at radii r 1 = 2 cm (position 1) and r 2 = 3.5 cm (position 2), recorded a low level of the Bφ field of at most 200 G. Moreover, the closest coil at r 1 = 2 cm (in position 1) registered the opposite direction of the Bφ field compared with the distant coil at r 3 = 5 cm (in position 3), and the coil at r 2 = 3.5 cm (in position 2) registered a signal with alternating sign. This behaviour of the Bφ(z 1,ri) curves is explained by the fact that when the plasma flow passes around the probe, these coils are located in the axial region of the plasma flow, where the central current flows. In this region, the Bφ field is small and has alternating directions relative to the axis of the central current. It follows that the axis of the plasma flow was displaced relative to the axis of the facility chamber and was close to r 2 = 3.5 cm, where the probe coil in position 2 was positioned.
The maximum of the Bφ field at 2 kG measured by the coil at r 3 = 5 cm (in position 3) is reached at time t 2, when the magnetic probe is deep inside the plasma flow (see the corresponding optical frame in figure 7a). By the time t 3 the level of the magnetic field registered by the probe drops by more than half. By this time, the plasma flow has almost completely passed the position of the probe (see the corresponding optical frame). The tail of the plasma flow is visible in the optical frame image (its ‘loose’ trailing front).
3.2.2. Prefilling with deuterium and gas puff with neon
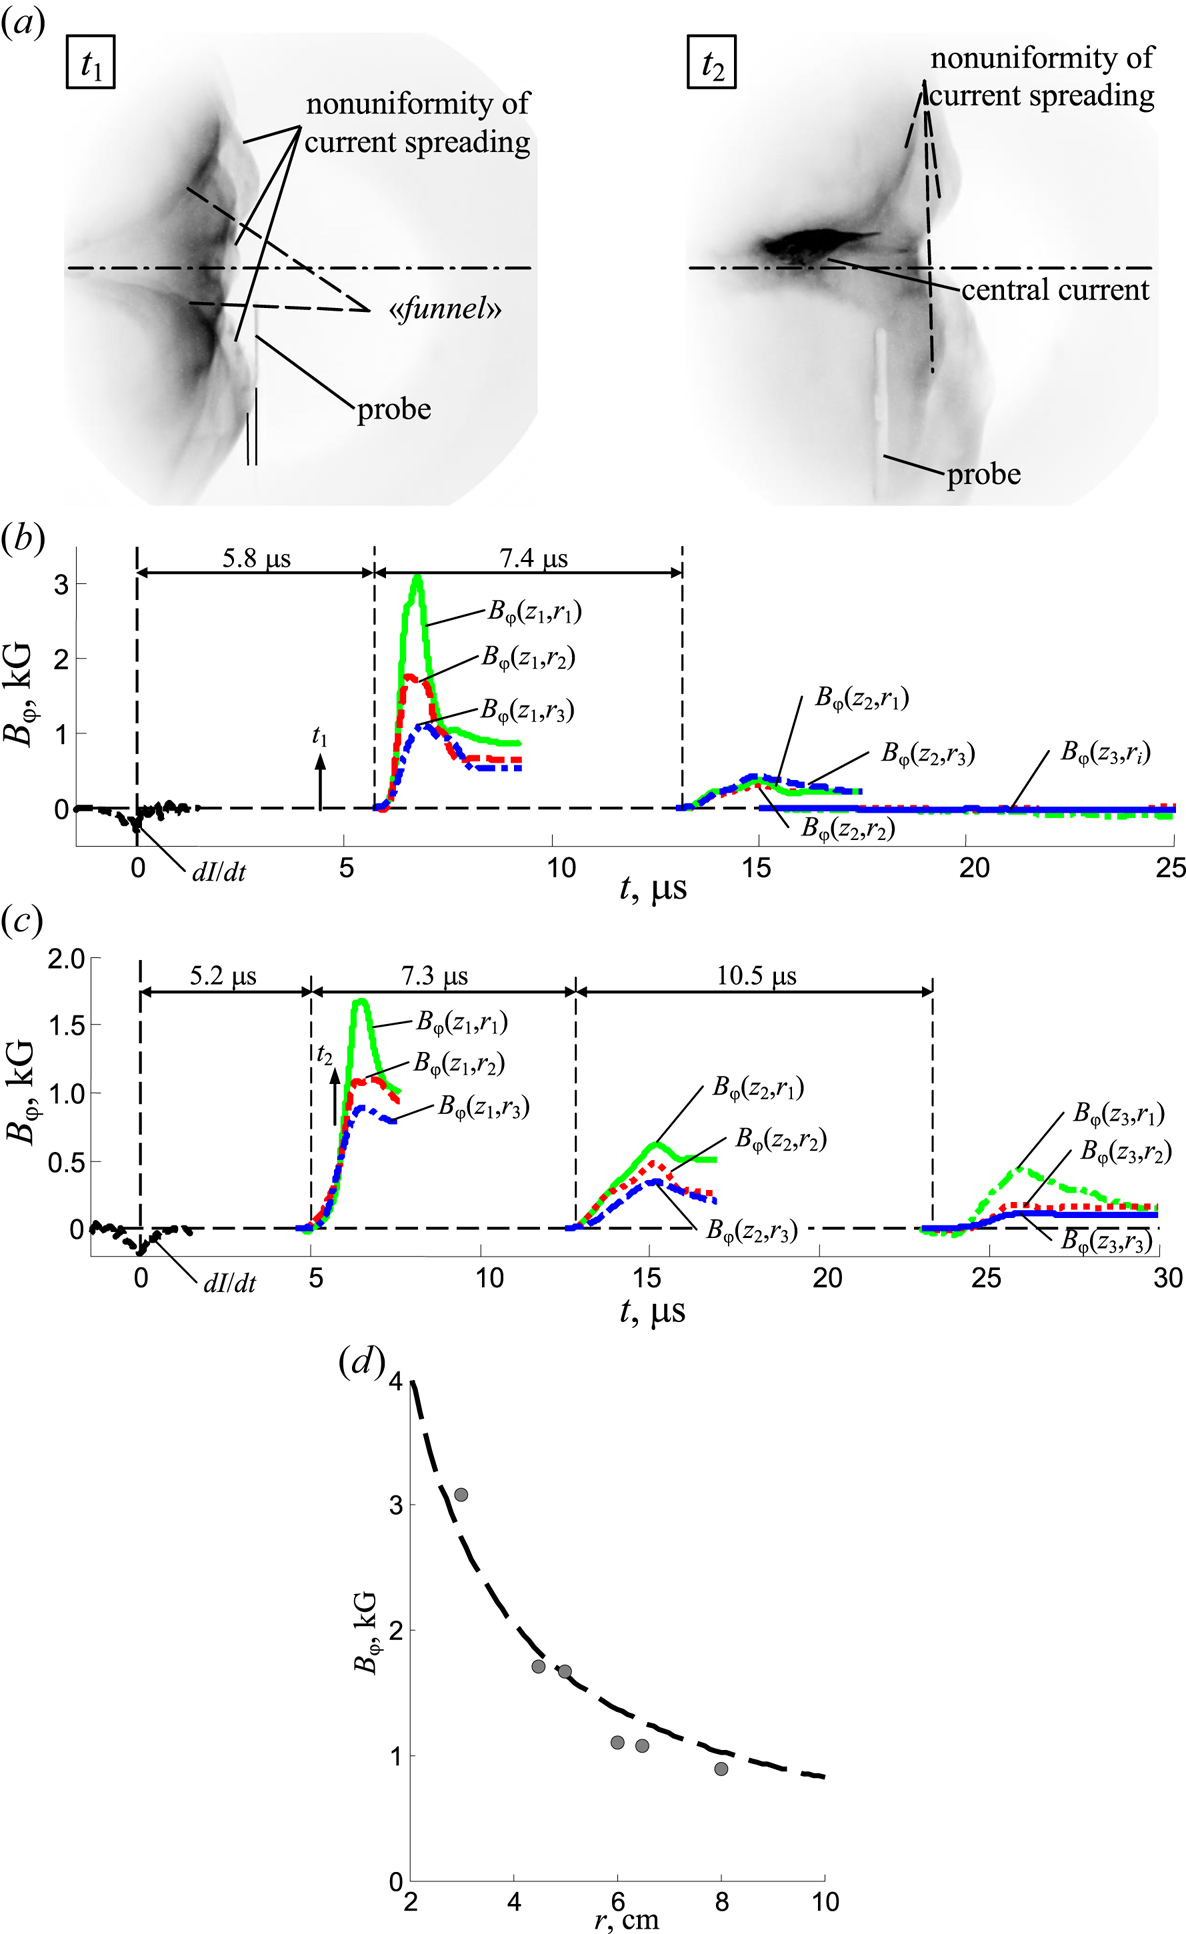
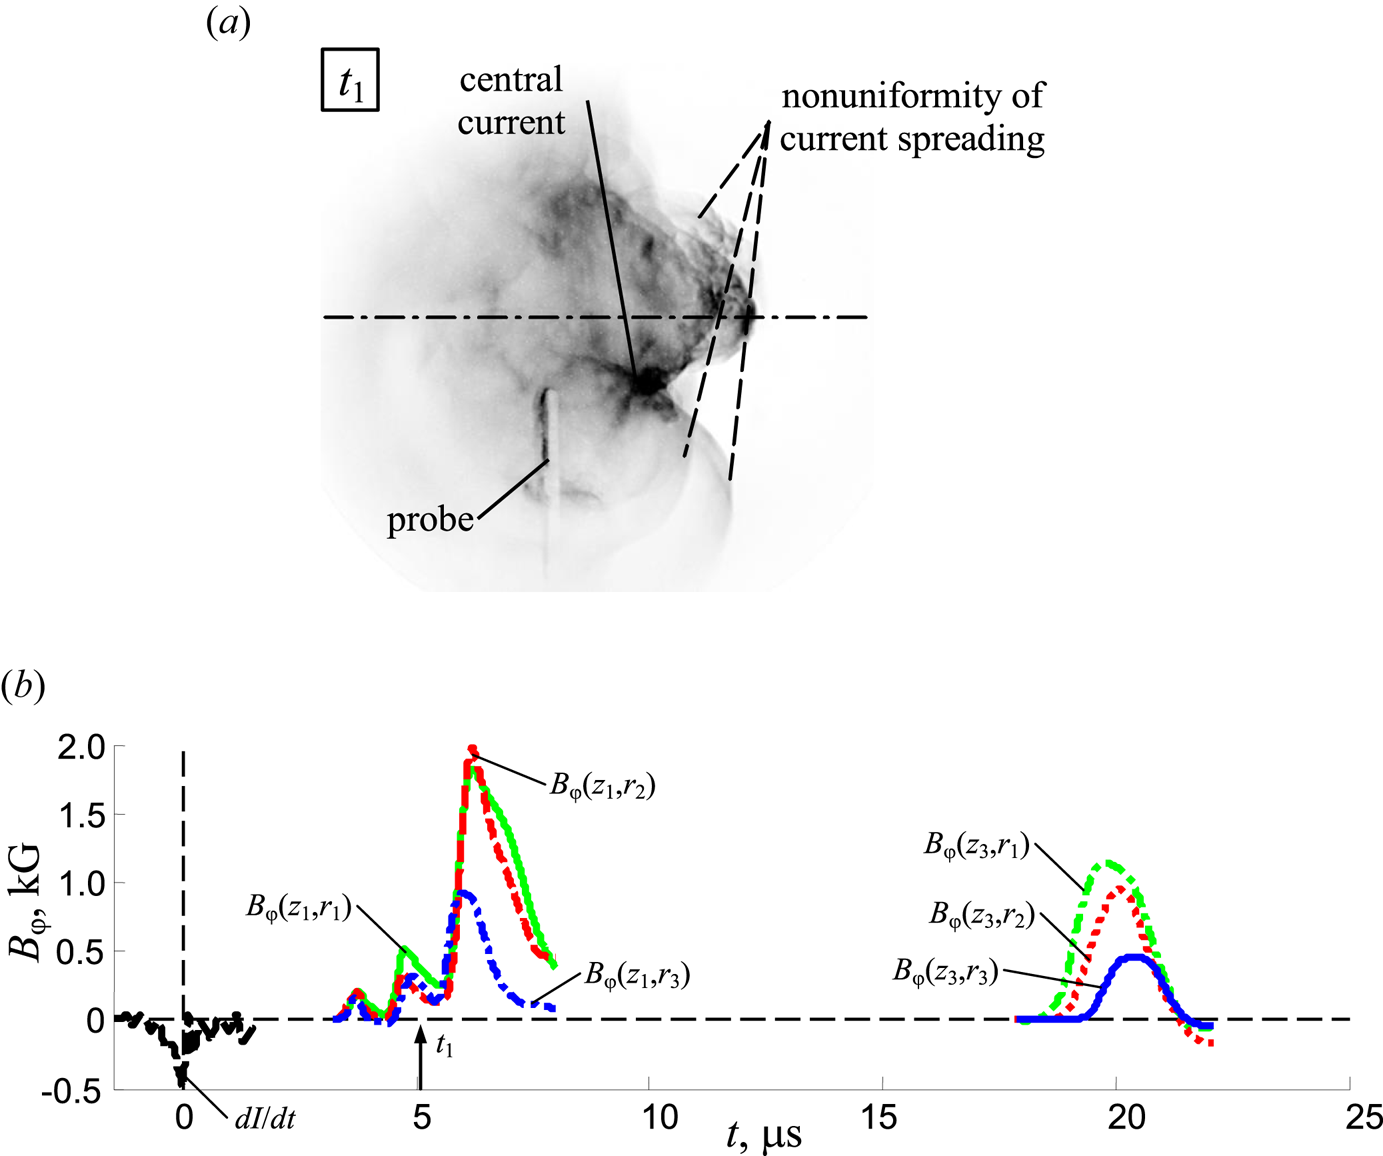
Next, we consider experiments on the generation of axial plasma flow during the combined mode of filling with deuterium and neon. In this case, owing to the neon gas puff into the axial region of compression of deuterium PCS, another type of gas with high Z prevailed in the central part of the axial flow, different from the gas in the drift space of the facility chamber (deuterium). As a result of this combination of gases, the internal and external structure of the plasma flow is more clearly revealed in the optical frame images (see figure 8a). Compared with experiments with deuterium, both with prefill and with gas puffs, in this case the outer boundary of the plasma flow looks inhomogeneous. Along with a funnel-shaped recess in the front, an azimuthally inhomogeneous structure is observed (see frames t 1 and t 2), associated with the non-uniform spreading of the central current towards the periphery of the plasma flow, where the current flows in the opposite direction.
The results of studies of the plasma flow (pulses 11 560 and 11 561, combined mode of filling with gas: prefilled with D2, P 0 = 0.9 Torr and gas puff of Ne, U 0 = 16 kV, W 0 = 170 kJ). (a) Optical frame images of the plasma flow incident on the magnetic probe at the position z 1 = 40 cm and r = 3 cm (t 1) and r = 5 cm (t 2) at different points in time (shown by arrows ↑): t 1 = 4.5 μs (pulse 11 560) and t 2 = 5.7 μs (pulse 11 561), measuring from the moment of sharp dip in the profile of dI/dt. Exposure of the frames is 3 ns. (b,c) The results of measurements of magnetic fields in a plasma flow at distances z 1 = 40 cm, z 2 = 60 cm and z 3 = 74 cm from the anode end at various radii: (b) at radii of 3, 4.5 and 6 cm (pulse 11 560); (c) at radii of 5, 6.5 and 8 cm (pulse 11 561). Time dependences of dI/dt, the derivative of the total current, Bφ(z 1,ri), Bφ(z 2,ri), Bφ(z 3,ri), the induction of the azimuthal magnetic field, are plotted. (d) The dependence of the magnitude of the magnetic field on the radius based on the data of the shots 11 560 and 11 561. The dotted curve corresponds to dependency 1/r.

In these experiments, magnetic probe measurements were carried out at positions z 1, z 2 and z 3 along the axis of the facility chamber and at varying radii. The probe coil closest to the axis of the facility was located at r 1 = 3 cm (see figure 8b) in one of the shots and at r 1 = 5 cm (see figure 8c) in the other shot. These shots correspond to the optical frames obtained at time moments t 1 and t 2, respectively. At time t 1, the plasma flow has not yet reached the location of the magnetic probe and, accordingly, the probe does not register any level of the Bφ field. At time t 2, the leading edge of the plasma flow passes the position of the probe and the magnetic probe is already inside the volume of the plasma flow. In this case, the probe records a sharp increase in the level of the Bφ field. Comparison of the curves Bφ(z 1,ri) in figures 8(b) and 8(c) shows that the farther the coils of the magnetic probe are from the axis of the facility chamber, the lower level of the magnetic field they register. For example, the coil closest to the axis located at r 1 = 3 cm (see figure 8b) records a level of Bφ field of approximately 3 kG, and in the other shot the same coil, but located at r 1 = 5 cm (see figure 8c), registers a lower level of Bφ field of 1.7 kG. It should also be noted that in these shots the magnetic probe recorded the nature of the radial dependence of the Bφ field in the form of  ${B_\varphi }(r) \propto 1/{r^n}$, which corresponds to the central current being concentrated in the central axial region of the plasma flow. At the same time, as the probe measurements show, the axis of the plasma flow was practically not shifted relative to the axis of the facility chamber in these shots.
Figure 8 can also serve as a confirmation of our assumption about good reproducibility of shots. In two consecutive shots carried out under the same conditions, the signals of magnetic probes have a similar shape and they are registered only after the probes appear inside the plasma flow. Moreover, the second coil of the probe in the shot 11 560 (r = 4.5 cm, figure 8b) and the first coil of the probe in the shot 11 561 (r = 5 cm, figure 8c) show close values of the magnetic field. Figure 8(d) shows the dependence of the magnetic field on the distance to the system axis constructed based on the results of two shots, which corresponds well to the 1/r dependence. Approximation of this relationship to the value of the radius r = 1 cm (the assumed radius of the central current) gives a value of 8 kG, which corresponds to the value of the axial current ~40 kA.
Measurements of the magnetic field at various distances z 1, z 2 and z 3 from the anode of the facility show that the magnetic field decreases by a factor of five or more (see the corresponding curves Bφ(z 1,ri), Bφ(z 2,ri) and Bφ(z 3,ri) in figure 8b,c). At the same time, the plasma flow is decelerated. Thus, the measured values of the average velocity in different sections  ${V_z}(0\textrm{--}{z_1}) \approx (6.9\textrm{--}7.7) \times {10^6}\;\textrm{cm}\;{\textrm{s}^{ - 1}}$,
 ${V_z}({z_1}\textrm{--}{z_2}) \approx 2.7 \times {10^6}\;\textrm{cm}\;{\textrm{s}^{ - 1}}$ and
 ${V_z}({z_2}\textrm{--}{z_3}) \approx 1.3 \times {10^6}\;\textrm{cm}\;{\textrm{s}^{ - 1}}$ indicate a more than five fold drop in the velocity. This behaviour of the plasma flow can be explained by its interaction with the background gas, as well as by the attenuation of the currents circulating in the plasma. As a result of this, the Bφ field attenuation, and subsequent decay of the plasma flow as a whole, occur.
3.2.3. Prefilling with deuterium and gas puff with a mixture of deuterium and neon
In this series of pulses, the initial distribution of gas in the facility chamber was created by prefilling of the facility chamber with deuterium and gas puff with a mixture of deuterium and neon gases. In figure 9 we present experimental results for the case when, along with prefilling of the facility chamber with deuterium up to an initial pressure of 0.9 Torr, gas puff with the mixture of deuterium and neon gases with equal partial pressures (50 % D2 + 50 % Ne) was carried out.
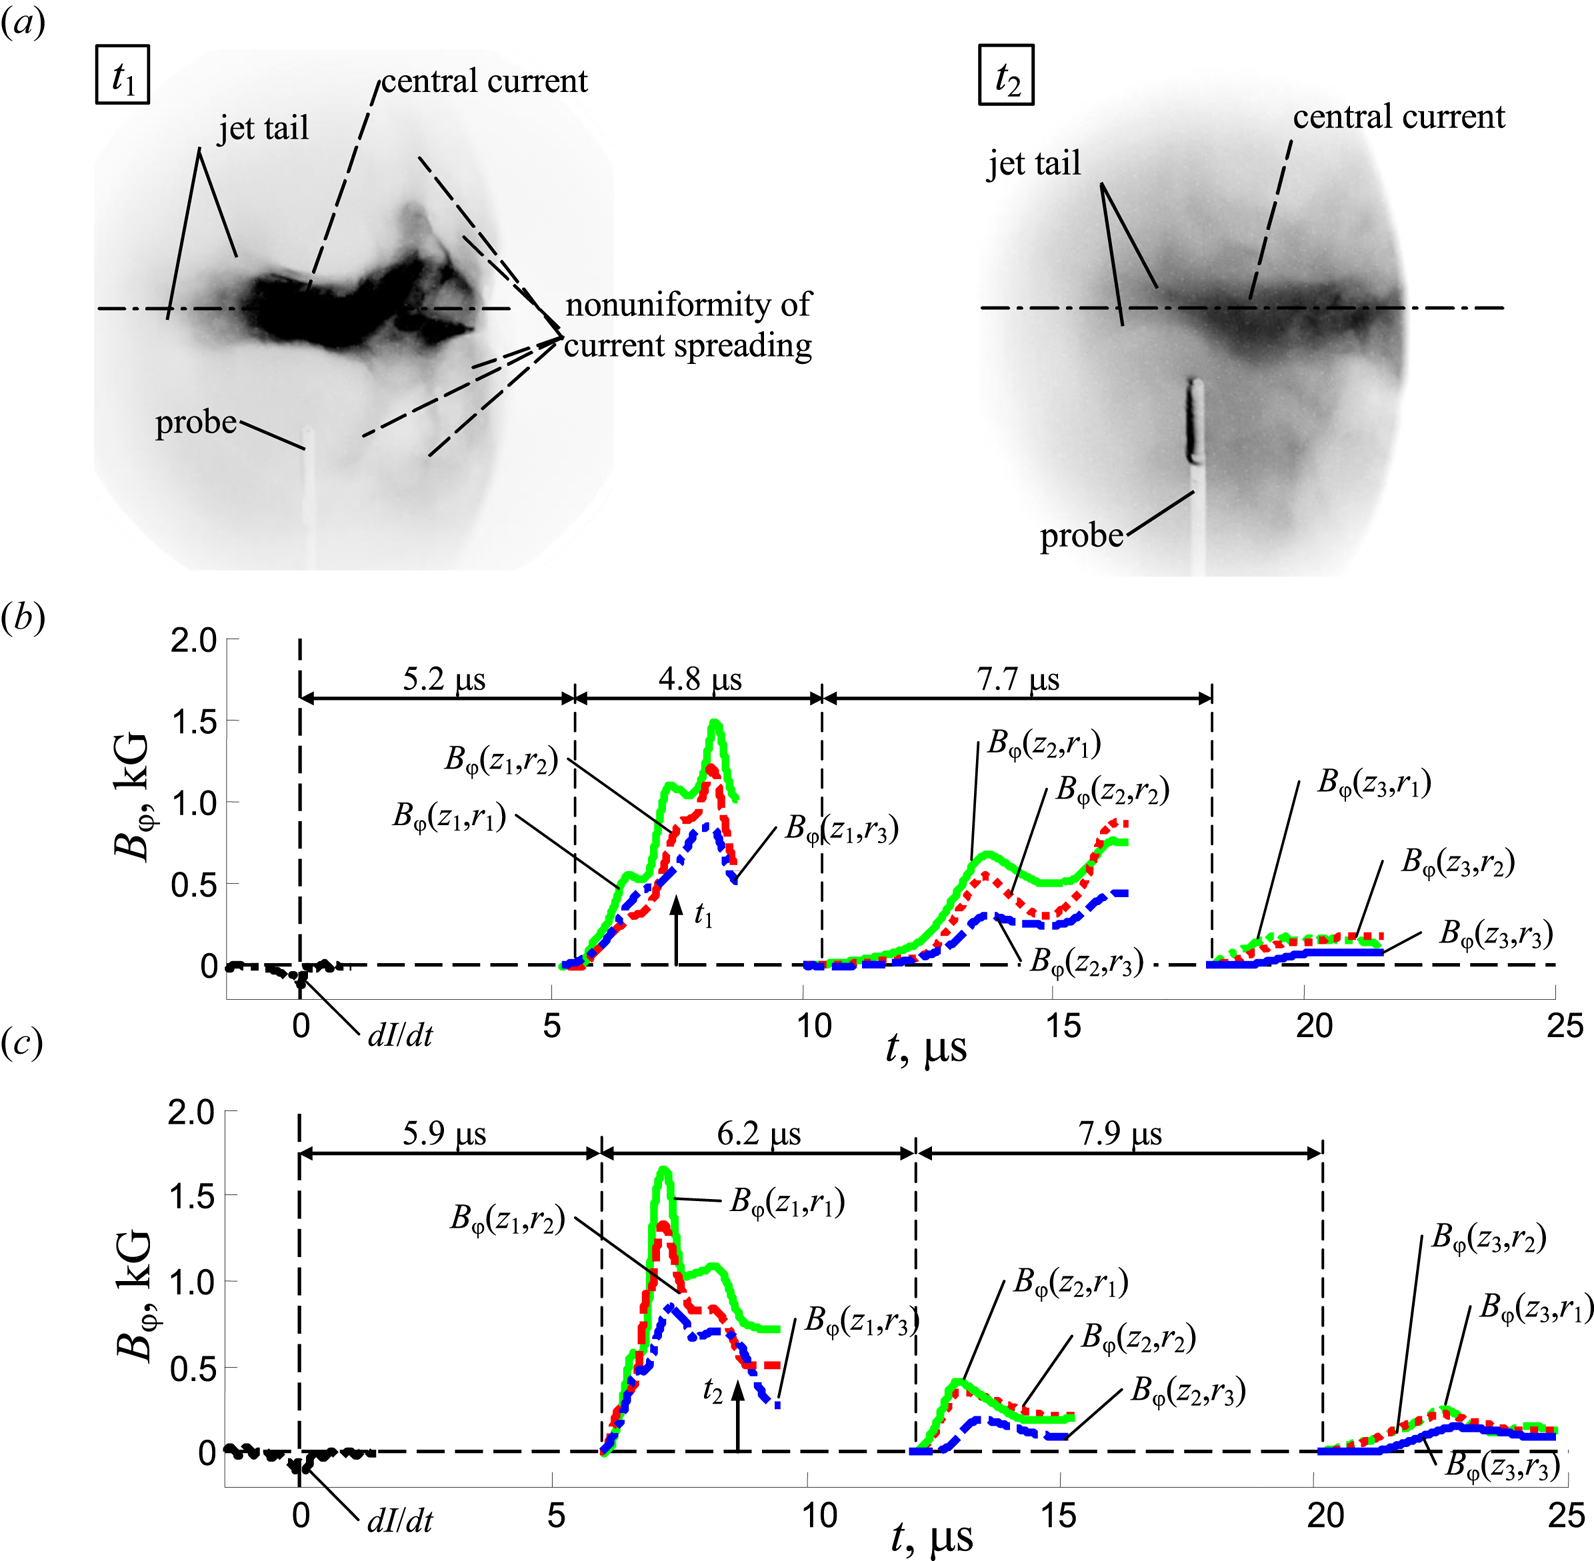
Results of plasma flow studies (pulses 11 563 and 11 564, combined method of filling with gas: prefilled with D2, P 0 = 0.9 Torr and gas puff of the mixture 50 % D2 + 50 % Ne). (a) Optical frame images of the plasma flow passing next to the magnetic probe at the position (r, z 1 = 40 cm), at different times (shown by arrows ↑): t 1 = 7.5 μs (pulse 11 563) and t 2 = 8.5 μs (pulse 11 564) counted from the moment of the dip in the profile of dI/dt. Exposures of the frames are 3 ns. (b) and (c) The results of measurements of magnetic fields in a plasma flow at distances z 1 = 40 cm, z 2 = 60 cm and z 3 = 74 cm from anode end at various radii: (b) at radii of 8, 9.5 and 11 cm (pulse 11 563); (c) at radii of 5, 6.5 and 8 cm (pulse 11 564). Plotted are time dependences: dI/dt is the time derivative of the total current and Bφ(z 1,ri), Bφ(z 2,ri), Bφ(z 3,ri) are the inductions of the azimuthal magnetic field.

Optical frame images of figure 9(a) taken at different time instants indicate that the plasma flow at its leading front has an azimuthally inhomogeneous structure associated with the spreading of current from the central (axial) part of the flow to the periphery (see frame t 1). It should be noted that the axial channel of the central current flow is unstable and has the form of a ‘snake’ or ‘screw’. This optical image was obtained at the moment when the plasma flow passes the magnetic probe located at the position z 1 = 40 mm. Moreover, the probe registers a Bφ field of more than 1 kG (see curves Bφ(z 1,r 1), Bφ(z 1,r 2) and Bφ(z 1,r 3) in figure 9b). In another pulse, optical frame recording was carried out at a late stage of the plasma flow passage through the position of the magnetic probe (see frame t 2 in figure 9a). It can be seen from the optical frame that the plasma flow almost passed ahead the position of the probe at z 1. The probe is located in the tail of the flow and registers the decrease of the Bφ field from a maximum of 1.7 kG to a level of less than 1 kG (see curves Bφ(z 1,r 1), Bφ(z 1,r 2) and Bφ(z 1,r 3) in figure 9c). The intrinsic emission of the plasma in the tail of the plasma flow falls below the threshold of optical frame recording, which is apparently associated with a decrease in the plasma density. The length of the central region of the plasma flow with a high level of optical radiation is Lz ≈ 12 cm. When the magnetic probe is entirely inside the volume of the plasma flow, its three coils are located at three different radii: r 1 = 5 cm, r 2 = 6.5 cm and r 3 = 8 cm (see figure 9c for pulse 11 564) and at r 1 = 8 cm, r 2 = 9.5 cm and r 3 = 11 cm (see figure 9b for pulse 11 563). These coils record signals corresponding to the radial distribution of the magnetic field  ${B_\varphi }(r) \propto 1/{r^n}$. In these experiments the attenuation of the magnetic field inside the plasma flow was also observed as the flow propagated through the z 1–z 3 flight base (see curves Bφ(z 1,ri), Bφ(z 2,ri) and Bφ(z 3,ri) in figure 9b,c), when the magnetic field decreased by a factor of 7–10. Estimation of the mean velocities of plasma with a magnetic field on the intervals between the positions of the probes Vz(0–z 1) ≈ (6.8–7.7) × 106 cm s−1, Vz(z 1–z 2) ≈ (3.2–4.2) × 106 cm s−1 and Vz(z 2–z 3) ≈ (1.7–1.8) × 106 cm s−1 indicates a three fold to five fold drop in the velocity.
When for the same parameters of the prefilling of the facility chamber with gas (D2, 0.9 Torr), a gas puff with mixture of gases was made (75 % D2 + 25 % Ne), a slightly different structure of the leading front of the plasma flow and its central part was observed (see optical frames t 1 and t 2 in figure 10a). A funnel-like structure is clearly visible at the leading front of the flow. On the inner surface of this leading front there are azimuthal inhomogeneities associated with the spreading of the central current to the periphery of the flow. In this case, the length of the central region of the plasma flow with a high level of optical radiation is less than in the case of gas puff with a gas mixture (50 % D2 + 50 % Ne) and is Lz ≈ 6–8 cm. Most likely, this is due to the lower content of the gas with high emissivity (neon) in the central part of the plasma flow.
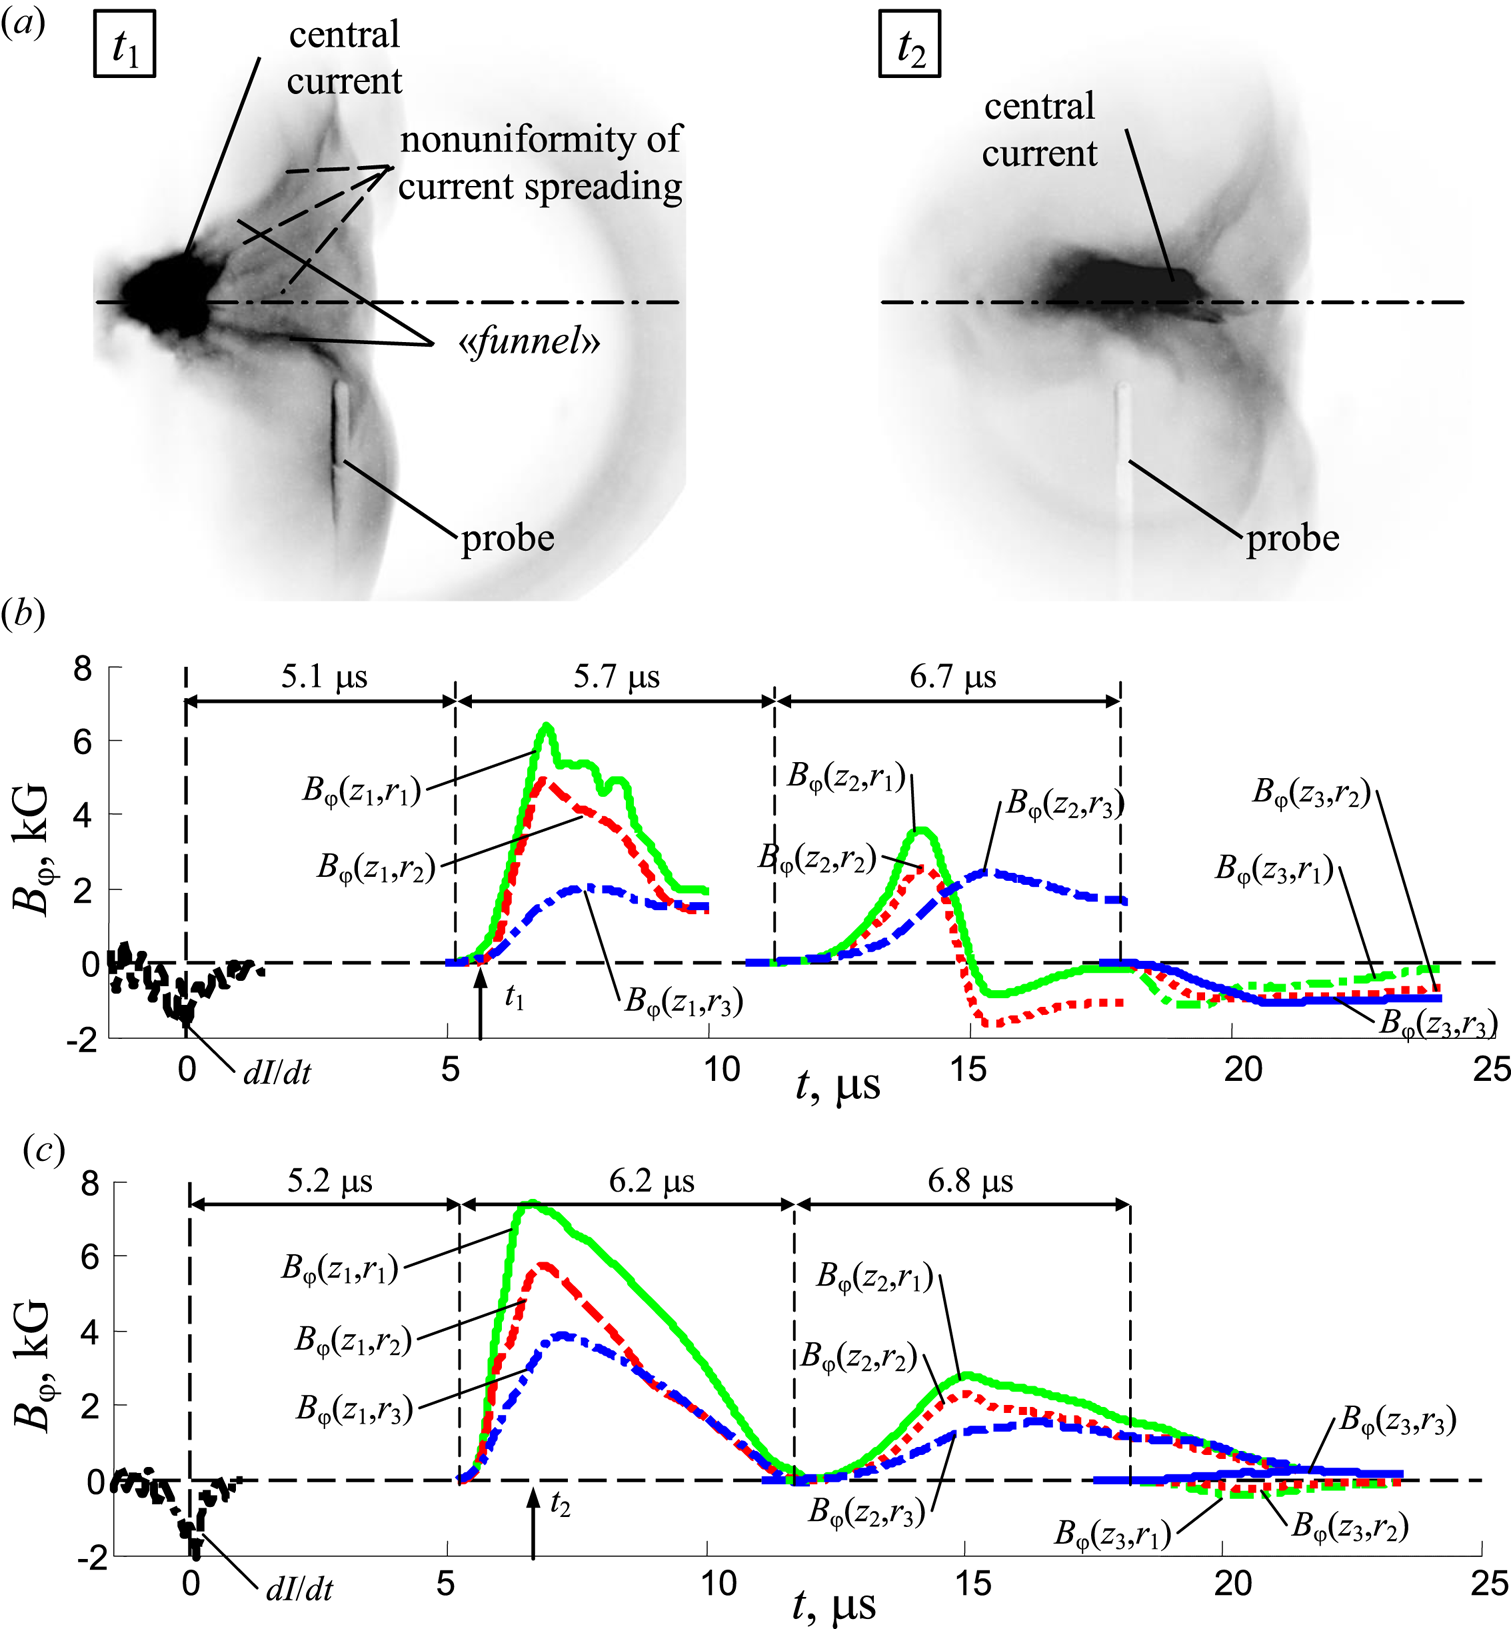
Results of studies of the plasma flow (pulses 11 567 and 11 568, combined method of filling with gas: prefilled with D2, P 0 = 0.9 Torr and gas puff of the mixture 75 % D2 + 25 % Ne, U 0 = 16 kV, W 0 = 170 kJ). (a) Optical frame images of a plasma flow passing next to the magnetic probe at the position r = 5 cm, z 1 = 40 cm at different times (shown by arrows ↑): t 1 = 5.6 μs (pulse 11 567) and t 2 = 6.6 μs (pulse 11 568) counted from the moment of the dip in the profile of dI/dt. Exposures of the frames are 3 ns. (b,c) The results of measurements of magnetic fields in a plasma flow at distances z 1 = 40 cm, z 2 = 60 cm, and z 3 = 74 cm from the anode end at radii of 5, 6.5 and 8 cm for pulses 11 567 and 11 568, respectively. Plotted are time dependences: dI/dt is the derivative of the total current; Bφ(z 1,ri), Bφ(z 2,ri), Bφ(z 3,ri) are the inductions of the azimuthal magnetic field.

Measurements of the magnetic field by the probe at a distance z 1 = 40 cm from the anode in the range of radii from 5 to 8 cm show that the magnetic field decreases in the direction from the axis of the flow to its periphery, sometimes even steeper than the dependence  ${B_\varphi }(r) \propto 1/{r^n}$ (see curves Bφ(z 1,r 1), Bφ(z 1,r 2) and Bφ(z 1,r 3) in figure 10b,c). Comparison of optical frame recording data (see frame t 2 in figure 10a) and Bφ(z 1,ri) curves in figure 10(c) shows that at the moment when the middle of the plasma flow passes the probe position, the magnetic probe registers the maximum level of the Bφ field. As in previous cases, the plasma flow slows down during its propagation along the axis of the facility chamber. Estimations of the mean velocities of plasma with a magnetic field in the intervals between the positions of the probes are Vz(0–z 1) ≈ (7.7–7.8) × 106 cm s−1, Vz(z 1–z 2) ≈ (3.2–3.5) × 106 cm s−1 and Vz(z 2–z 3) ≈ (2.0–2.1) × 106 cm s−1. These estimations indicate a threefold to four fold drop in the velocity. It should be noted that, according to measurements of the magnetic field at distant positions from the anode (z 2 = 60 cm and z 3 = 74 cm), a strong shift of the axis of the plasma flow relative to the facility chamber axis was recorded in some pulses. In this case, the probes recorded signals of reverse polarity (see, for example, curves Bφ(z 3,r 1), Bφ(z 3,r 2) and Bφ(z 3,r 3) in figure 10b,c). The characteristic features of the curves Bφ(z 2,ri) in figure 10(b), such as the decrease in the level of the magnetic field to zero and change in its sign during the passage of the trailing edge of the plasma flow, indicate a non-uniform current flow in this region. It can be assumed that the same picture of the inhomogeneous current flow takes place at the leading front of the flow (see, for example, frame t 1 in figure 10a).
3.2.4. Prefilling with deuterium and gas puff with a mixture of deuterium and helium
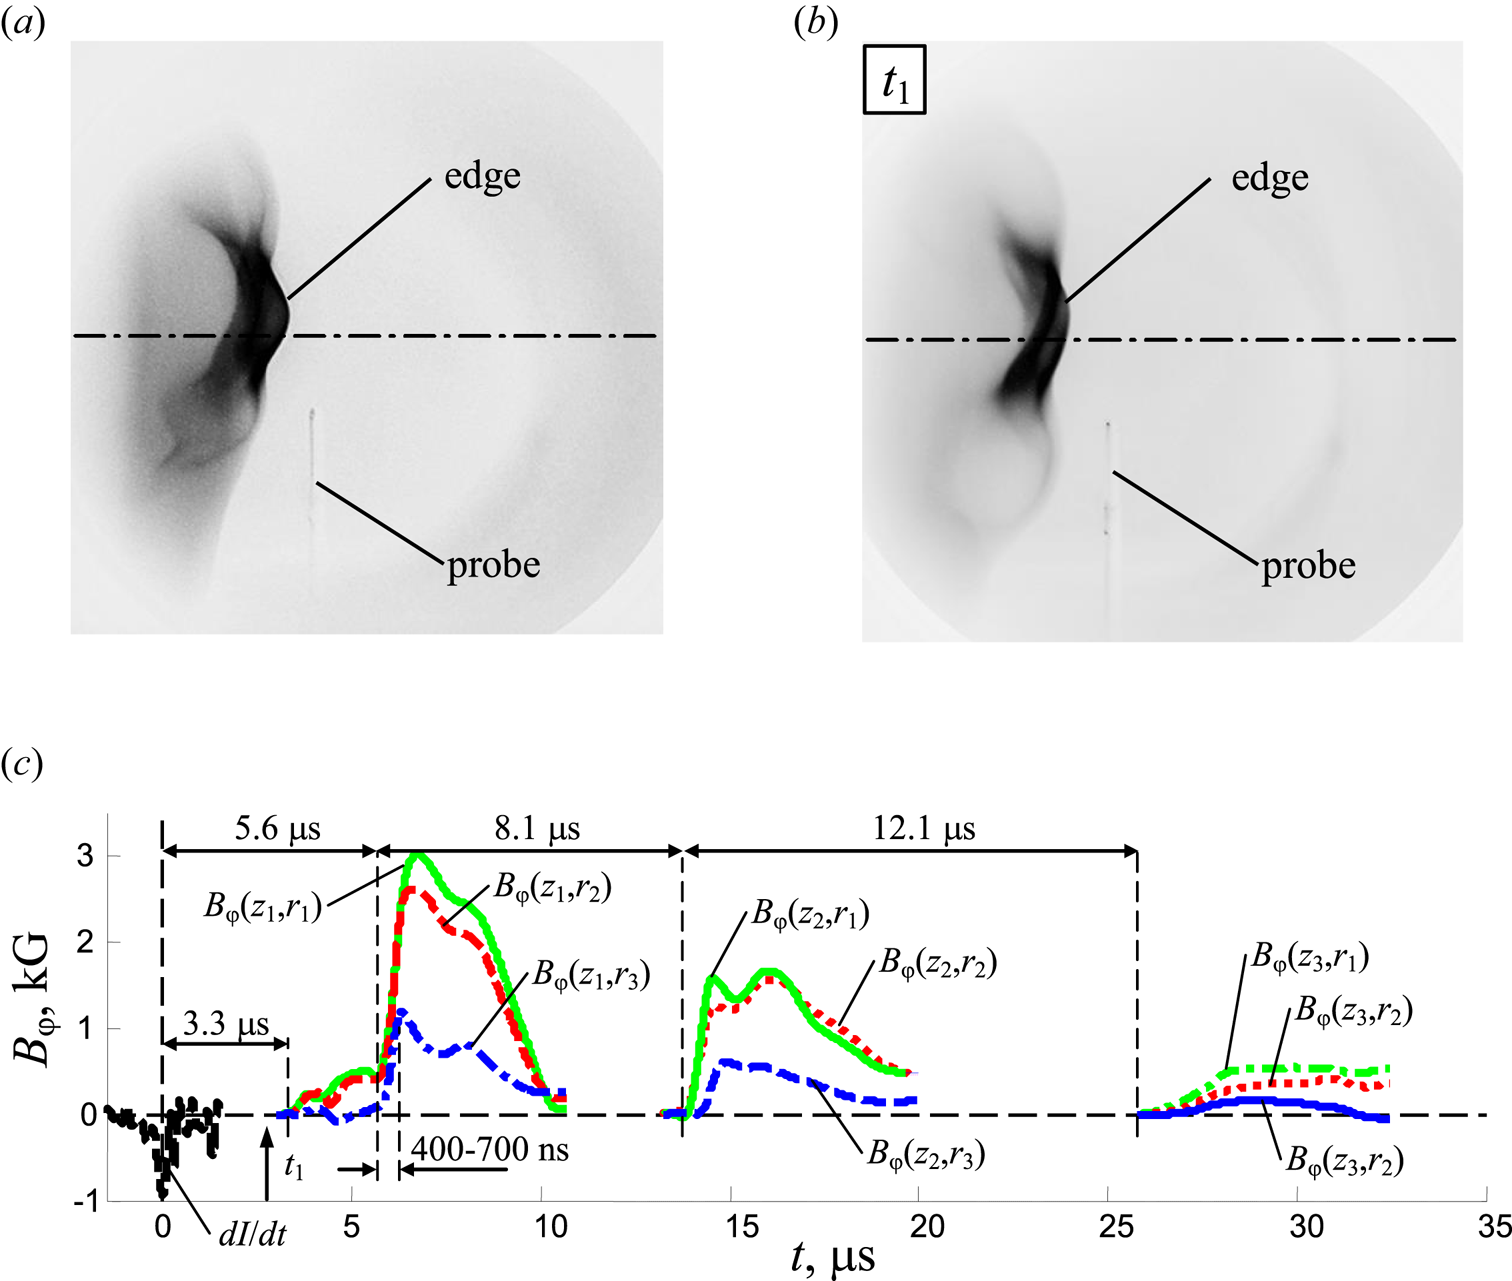
In this series of pulses, a study was made of the propagation of a deuterium plasma flow with helium additives and its interaction with the background gas (D2, 0.9 Torr) in the facility chamber. A mixture of deuterium and helium was injected into the PCS compression area in two versions (50 % D2 + 50 % He and 80 % D2 + 20 % He). The results of these experiments are presented in figures 11(a) and 11(b,c), respectively.
Optical frame images of a plasma flow passing next to the magnetic probe at the position z 1 = 40 cm, r = 5 cm at time 2.7 μs, counted from the moment of the dip in the profile of dI/dt. The exposure of the frame is 3 ns; (a) pulse 11 552, prefilled with D2, P 0 = 0.9 Torr and gas puff of the mixture 50 % D2 + 50 % He; (b) pulse 11 553, prefilled with D2, P 0 = 0.9 Torr + gas-puff of the mixture 80 % D2 + 20 % He. The exposure of the frame is 3 ns. (c) The results of measurements of magnetic fields in a plasma flow at a distance of z 1 = 40 cm from the anode end at radii of 5, 6.5 and 8 cm. Plotted are time dependences: dI/dt is the derivative of the total current; Bφ(z 1,ri), Bφ(z 2,ri), Bφ(z 3,ri) are the inductions of the azimuthal magnetic field (pulse 11 553). The moment t 1 of taking the photo (figure 11b) is shown by an arrow.

It can be seen from optical frame images (see figure 11a,b) that the flow profile weakly depends on the percentage of deuterium and helium in the injected gas. For both versions of the helium content in the gas-puff mixture, the leading front of the plasma flow has the same compact structure along its axis. The longitudinal size of the region of the highest plasma luminosity Lz is no more than 2–3 cm. It should be noted that in these cases the structure of the leading front of the plasma flow looks without highly developed instabilities, in contrast to what was observed in experiments with the gas-puff of mixture D2 + Ne (see figure 10a). The presence of a gas with a high Z in the gas mixture increases the development of instabilities at the outer boundary of the plasma flow. The signals from the probe coils located at the position z 1 = 40 cm in the range of radii of 5–8 cm have a steep rise from level 0.1 to level 0.9 with a duration of only around 400–700 ns (see curves Bφ(z 1,r 1), Bφ(z 1,r 2) and Bφ(z 1,r 3) in figure 11c). This sharp leading edge of the signals from the coils is caused by the passage of a compact shock front of the plasma flow.
It should be noted that in front of the main burst of the magnetic field in time dependences of Bφ(z 1,ri) there is a pedestal-like structure appearing approximately 3.3 μs after the moment of the dip in the profile of dI/dt. The pedestal on the magnetic probe signal is not always observed and is most likely associated with an inhomogeneous current distribution at the flow front. Measurements of the Bφ field at various distances from the anode end also showed the attenuation of the magnetic field in the plasma flow (see curves Bφ(z 1,ri), Bφ(z 2,ri) and Bφ(z 3,ri) in figure 11c). Estimations of the average velocity of plasma with a magnetic field on the intervals between the positions of the probes Vz(0–z 1) ≈ 7.1 × 106 cm s−1, Vz(z 1–z 2) ≈ 2.5 × 106 cm s−1 and Vz(z 2–z 3) ≈ 1.2 × 106 cm s−1 indicate a six fold drop in velocity.
3.2.5. Prefilling with deuterium and gas puff with a mixture of deuterium, neon, and helium
In the following experiments neon was also added to the mixture of gases puffed into the chamber of the facility prefilled with deuterium up to 0.9 Torr. In this case, the gas mixture consisted of deuterium, helium and neon in proportions 80 % D2 + 10 % Ne + 10 % He. In figure 12 we present the results of studies of the propagation of axial plasma flow consisting of various chemical elements. It can be seen that the addition of even a small amount of neon brings the shape of the flow profile closer to the profile observed upon gas puff of pure neon.
Results of studies of the plasma flow (pulses 11 591 and 11 592, combined mode of gas filling: prefilled with D2, P 0 = 0.9 Torr and gas puff of the mixture 80 % D2 + 10 % Ne + 10 % He, U 0 = 16 kV, W 0 = 170 kJ). (a) Optical frame images of a plasma flow passing next to the magnetic probe at a position r = 5 cm, z 1 = 40 cm at various points in time: t 1 = 4.5 μs (pulse 11 591 shown by arrow ↑ in figure 12b) and t 2 = 4.7 μs (pulse 11 592) counted from the moment of the dip in the profile of dI/dt. Exposures of the frames are 3 ns. (b) The results of measurements of magnetic fields in a plasma flow of pulse 11 591 at distances z 1 = 40 cm, z 2 = 60 cm and z 3 = 74 cm from the anode end at radii of 5, 6.5 and 8 cm. Plotted are time dependences: dI/dt is the derivative of the total current; Bφ(z 1,ri), Bφ(z 2,ri), Bφ(z 3,ri) are the inductions of the azimuthal magnetic field.

The leading front has a funnel-shaped structure, and inhomogeneities associated with instabilities are visible on its outer surface (see frames t 1 and t 2 in figure 12). We note once again that in all experiments when an admixture of neon was included in the plasma flow, instabilities were observed on the outer surface of the plasma flow, even when neon was part of the background gas.
Measurements of the Bφ field in the position z 1 = 40 cm show that when the leading front of the plasma flow passes through the position of the magnetic probe, as shown in frame t 1 of figure 12(a), the probe begins to register a signal (see a small pedestal on curves Bφ(z 1,r 1), Bφ(z 1,r 2) and Bφ(z 1,r 3) in figure 12b). Further, the readings of the probe coils located in the range of radii from 5 to 8 cm strongly depend on the distance from the flow axis. Specifically, the coils closest to the flow axis at r 1 = 5 cm and r 2 = 6.5 cm in this experiment turned out to be close to the region of the current flow due to the displacement of the axis of the plasma flow relative to the axis of the facility chamber. The Bφ field recorded by these coils turned out to be the same within the accuracy of the measurement of the magnetic field by the probe. The farthest coil of the probe at r 3 = 8 cm recorded a three times lower level of Bφ field.
As in all cases considered previously, probes located at different distances from the anode end record strong attenuation of the Bφ field (an order of magnitude or more) during the propagation of the plasma flow along the axis of the facility (see curves Bφ(z 1,ri) and Bφ(z 3,ri) in figure 12b). Estimations of the average velocity of plasma with a magnetic field on the intervals between the probe positions Vz(0–z 1) ≈ 8.5 × 106 cm s−1, Vz(z 1–z 2) ≈ 3.5 × 106 cm s−1 and Vz(z 2–z 3) ≈ 1.3 × 106 cm s−1 indicate a seven fold drop in velocity.
3.2.6. Prefilling with a mixture of deuterium and neon and gas puff with a mixture of deuterium and neon
Finally, we performed a study of the propagation of an axial flow consisting of plasma of deuterium and neon gases (75 % D2 + 25 % Ne) in a background gas, which was the same kind of a mixture of gases (90 % D2 + 10 % Ne, P 0 = 0.6 Torr). The results of optical frame recording and magnetic field measurements are presented in figures 13(a) and 13(b), respectively. An optical frame image was obtained at time t 1 of the passage of the plasma flow around the magnetic probe, when the probe body was already completely inside the flow (see figure 13a). The time dependence of the Bφ field around time t 1 is a non-monotonically increasing dependence (see curves Bφ(z 1,r 1), Bφ(z 1,r 2) and Bφ(z 1,r 3) in figure 13b). Several bursts are visible on the profiles of Bφ(z 1,ri), apparently related to the spatially inhomogeneous plasma structure along the flow axis, which can arise due to various kinds of instabilities. The leading front of the plasma flow is funnel shaped. It should also be noted that instabilities are observed at the leading front of the plasma flow, as they are also observed in all the cases considered previously, when neon was part of the working gas. We determined from the optical image that the axis of the plasma was shifted relative to the axis of the facility chamber towards the probe in this pulse. In addition, two coils of the probe turned out to be near the central current flow region and recorded a high level of the Bφ field of approximately 2 kG. The probe farthest from the anode, installed at position z 3, recorded a decrease of the magnetic field in the plasma flow down to 1 kG.
The results of plasma flow studies (pulse 11 588, combined mode of filing with gas: prefilled with the mixture of 90 % D2 + 10 % Ne, P 0 = 0.6 Torr and gas puff of the mixture 75 % D2 + 25 % Ne, U 0 = 16 kV, W 0 = 170 kJ). (a) Optical frame image of the plasma flow next to the magnetic probe in position r = 5 cm, z 1 = 40 cm at time t 1 = 5.1 μs (shown by arrow ↑ on figure 13b) counted from the moment of the dip in the profile of dI/dt. Exposure of the frame is 3 ns. (b) The results of measurements of magnetic fields in a plasma flow at distances z 1 = 40 cm and z 3 = 74 cm from the anode end at radii of 5, 6.5 and 8 cm. Plotted are time dependences: dI/dt is the derivative of the total current; Bφ(z 1,ri), Bφ(z 3,ri) are the inductions of the azimuthal magnetic field.

4. Discussion of results and conclusions
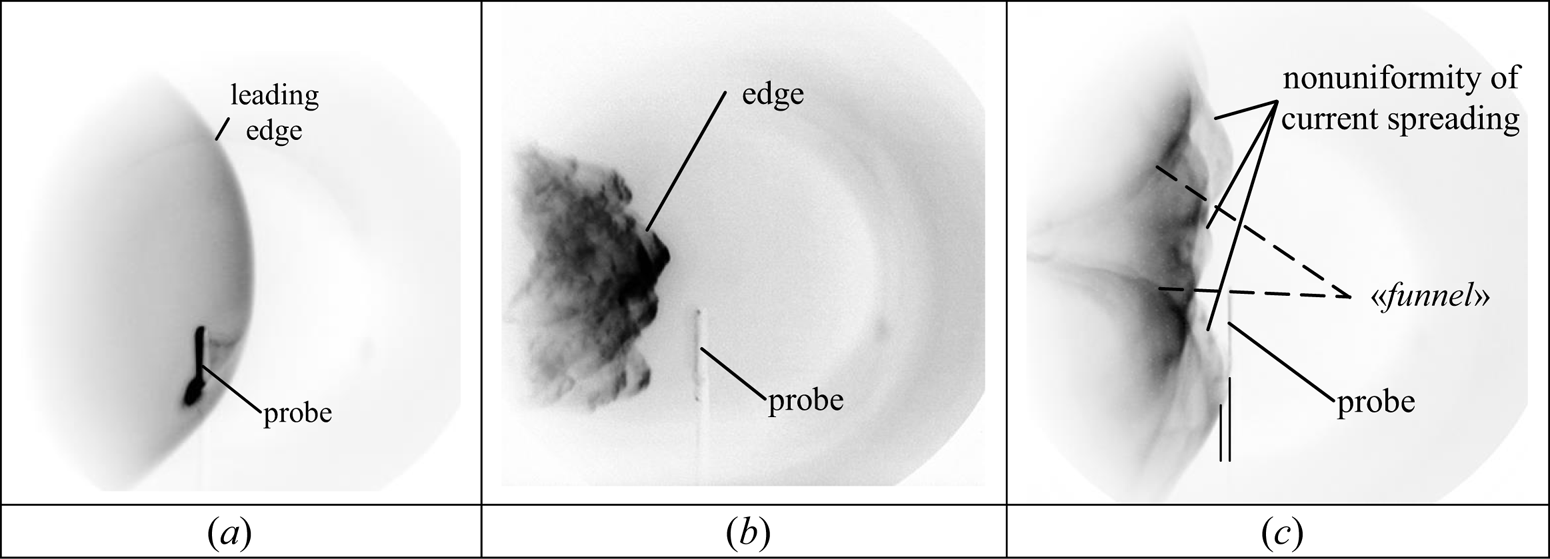
The experimental results presented here demonstrate a strong dependence of the plasma flow shape on the mode of filling the chamber with the working gas. Figure 14 shows the main types of observed profiles: quasi-spherical when the chamber is filled with deuterium, quasi-conical when using neon or a mixture of deuterium and neon as a working gas and funnel-shaped when using additional axial injection, which is most clearly manifested when there is neon in the injected mixture.
Examples of the main types of flow profile depending on gas filling: (a) prefilled with D2, (b) prefilled with mixture 80 % D2 + 20 % Ne and (c) prefilled with D2 and gas puff of the mixture 75 % D2 + 25 % Ne.

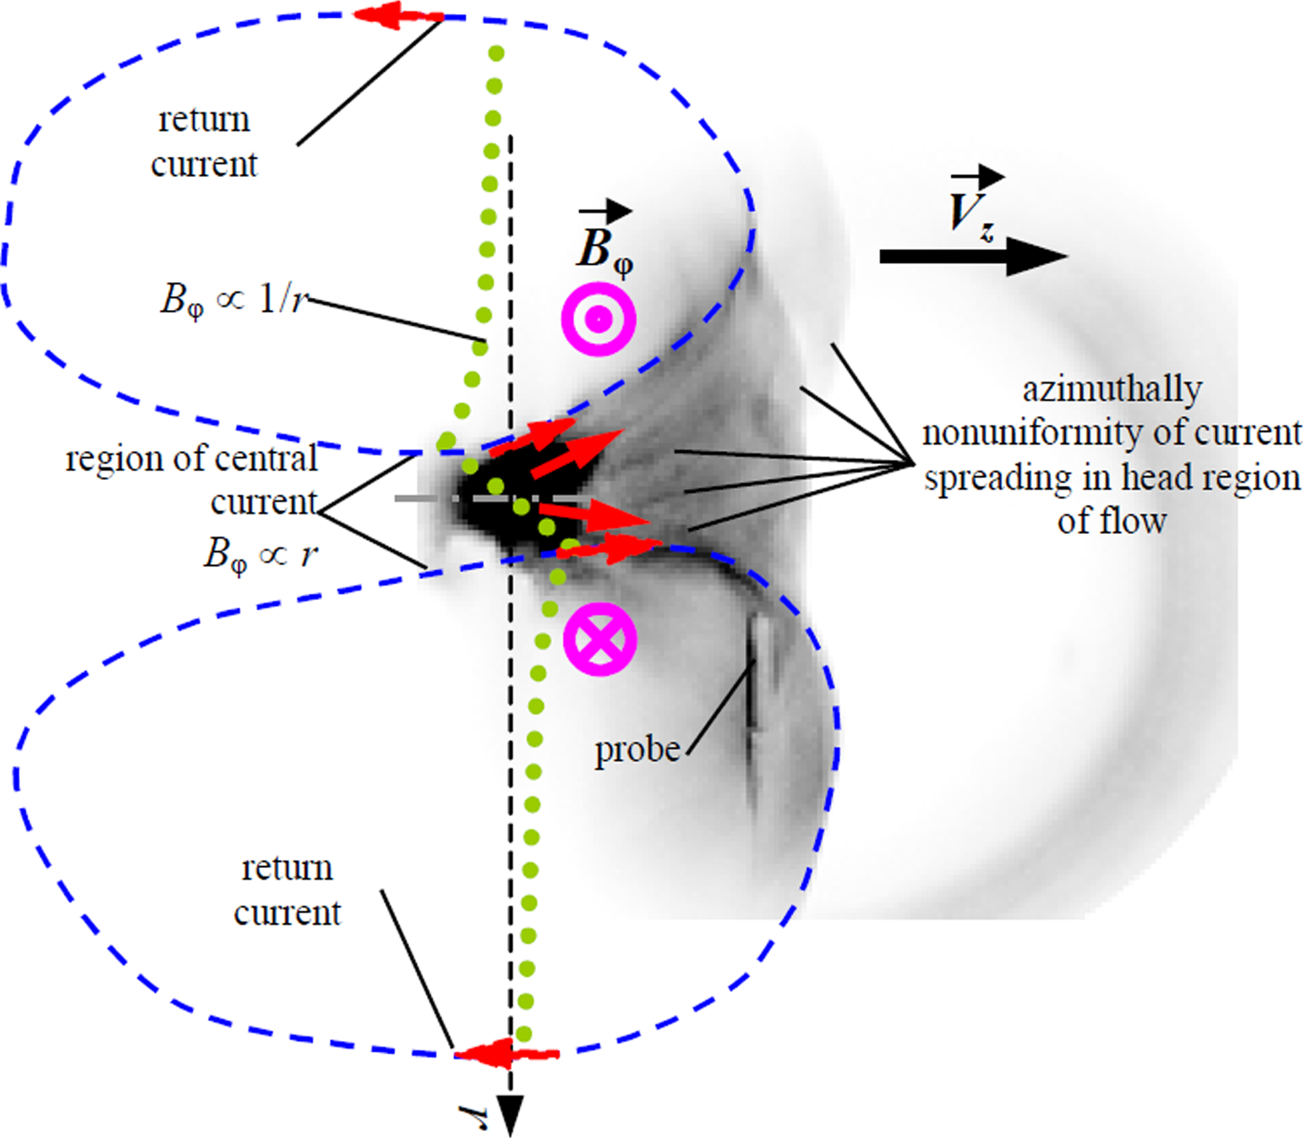
At present, we do not have enough information to clearly understand this dependency. One of the main results is the detection of compact formations at distances from anode more than an order of magnitude larger than their size (figure 14c). These formations are most pronounced when additional neon is injected. Based on the experimental results on the spatiotemporal structure of the magnetic field and optical frame recordings, the structure of a plasma flow with currents circulating inside the flow for this mode can be represented schematically as shown in figure 15. For clarity, the same figure shows the actually obtained optical frame image of the plasma flow. The internal structure of the plasma flow can be represented as follows. On the axis of the flow there is a region with increased plasma density and, accordingly, with increased emission in the optical range of the spectrum. As the magnetic probe measurements of the Bφ-field have shown, a central current flows in this region, and outside this region the radial distribution of the magnetic field has the form  ${B_\varphi }(r)\propto1/{r^n}$. For most cases, the radial distribution corresponds well to the 1/r dependence in the region between the central and reverse currents. Closer to the periphery of the plasma flow, where, as we believe, the reverse current flows, toroidal magnetic field Bφ drops sharply. A more detailed study of magnetic field inside the core of a plasma flow (in the region of the central current flowing) and at the periphery of the plasma flow will be carried out in the next series of experiments.
The possible interpretation of the structure of the axial plasma flow. Current circulation diagram is depicted by dashed lines with arrows (→, red). Radial dependence of the azimuthal magnetic field in the plasma flow Bφ(r) is shown by circles (•••, green) in the central part and on the periphery of the flow.

Thus, the central current from the axial region of the flow spreads along the leading front of the flow in the form of a funnel (in the case shown in figure 15). In this case, inhomogeneities associated with the azimuthal inhomogeneity of current spreading in this region are visible on the inside of the funnel. We can assume that the same picture of the inhomogeneous current flow takes place at the trailing edge of the stream, in its tail part. At the periphery of the plasma flow, the current flows in the opposite direction to the central current (reverse current).
We assume that the reverse current closes in the tail part of the plasmoid, and not on the electrodes of the system. This assumption is based primarily on the finite duration of the magnetic probe signals, which is only a few microseconds. For typical velocities of around 5 × 106 cm s−1, this means that the size of a plasma with a magnetic field has a limited size of approximately 10 cm, and this plasmoid with a magnetic field moves along the axis, maintaining its compactness even at a distance of 74 cm.
A similar pattern with a pronounced central core is observed in all modes with gas puff. Some differences may be due to instabilities developing at the shock front. This aspect requires further more-detailed studies. A different pattern is observed in modes without gas puff (figures 3–6, 14a and 14b). We do not see a pronounced core behind the quasi-spherical (deuterium) or conical (neon, a mixture of neon and deuterium) shock front. However, the nature of the magnetic field distribution shows the presence of a longitudinal current flowing in a fairly narrow axial region. The fundamental distinction between these two modes is the difference in the elemental composition of the plasmoids and the ambient plasma. In modes without additional injection, a deuterium plasmoid propagates in a chamber filled with deuterium, or a neon plasmoid propagates in a chamber filled with neon. In the case of gas puff, a plasmoid containing elements with a large Z, and therefore characterized by higher emissivities, always propagates in a chamber filled with deuterium. According to our estimates (Krauz et al. Reference Krauz, Levashova, Karakin, Krokhin, Lisitsa, Mokeev, Myalton, Nikulin, Oginov and Smirnov2008) the intensity of neon plasma radiation is more than an order of magnitude higher than the intensity of hydrogen plasma radiation at a temperature of 5 eV owing to the presence of intense lines of Ne I and Ne II.
We can assume that this is what allows us to distinguish brightly radiating structures. To clarify this assumption, work has begun on implementing laser shadow diagnostics on the PF-1000U installation. The difference in the profiles of the shock waves during discharges in deuterium and neon can be caused by the development of various types of thermal instabilities at the conditions of the significant difference in the ion-sound velocity owing to the large differences in radiation losses and ion masses.
Let us make some estimates of the physical parameters in axial plasma flows. To be specific, let us consider the case when, along with prefilling of the facility chamber with deuterium, gas puff of a mixture of deuterium and neon gases with equal partial pressures of 50 % of D2 and 50 % of Ne in a gas mixture is carried out. The experimental results for this case are presented in figure 9. We estimate parameters from experimental measurements as follows: total number density of electrons obtained from spectroscopic measurements is ne ≈ 4 × 1017 cm−3, the electron temperature is Te ≈ 5 eV (Skladnik-Sadowska et al. Reference Skladnik-Sadowska, Dan'ko, Kwiatkowski, Sadowski, Zaloga, Paduch, Zielinska, Kharrasov and Krauz2016, Reference Skladnik-Sadowska, Dan'ko, Kharrasov, Krauz, Kwiatkowski, Paduch, Sadowski, Zaloga and Zielinska2018), the characteristic radius of the central axial current is r ≈ 1 cm, and the characteristic value of the azimuthal magnetic field at radius 8 cm is Bφ ~ 1.5 × 10³ G. From here we can estimate the density of the gas mixture in the plasma ejection. Owing to equal partial pressures, the number densities of D2 and Ne in the gas puff are equal. After the discharge, deuterium dissociates into atoms D and is ionized. We assume that neon is singly ionized inside the plasma flow region. Therefore, the number density of deuterium ions n D is twice the number density of neon single charged ions n Ne: n D = 2n Ne. Each atom of either Ne or D contributes one electron, therefore, the total number density of electrons is n e = n D + n Ne = 3n Ne. Then, n Ne = n e/3 and n D = 2n e/3. Now we can estimate the mass density of plasma inside the flow as ρ ≈ (2 × 2mp + 20mp) n e/3 ≈ 5.3 × 10⁻⁶ g cm−3. An estimate of the adiabatic speed of sound is  ${c_s}=\sqrt {\gamma 2kT{n_e}/\rho }=1.4 \times {10^6}\;\textrm{cm}\;{\textrm{s}^{ - 1}}$, where the adiabatic exponent is γ = 5/3 for a mixture of monatomic gases, and the electron pressure is taken into account. We can extrapolate the value of the azimuthal magnetic field to the radius of the current carrying flow r = 1 cm from that at r = 8 cm using the experimentally found dependence
 ${B_\varphi } \propto 1/r$. This results in an estimate of
 ${B_\varphi } = 1.2 \times {10^4}\;\textrm{G}$ at r = 1 cm. The Alfvén velocity corresponding to this value of the azimuthal magnetic field is
 ${v_{A\varphi }} = {B_\varphi }/\sqrt {4{\rm \pi} \rho } = 1.5 \times {10^6}\;\textrm{cm}\;{\textrm{s}^{ - 1}}$. The Alfvén speed is about the same as the sound speed, therefore, the magnetic forces associated with the central current are important in pressure balance and should be taken into account as a major contributor in the subsequent modelling of confinement of the central part of the plasma flow.
Next, let us evaluate the dissipative effects associated with finite conductivity and viscosity. Spitzer conductivity across magnetic field lines is estimated as
 \begin{equation}\sigma = \frac{1}{{{\eta _ \bot }}} = \frac{1}{{1.15 \times {{10}^{ - 14}}Z\ln \Lambda {{({T_{\textrm{eV}}})}^{ - 3/2}}}} \approx 9.7 \times {10^{13}}\;{\textrm{s}^{ - 1}},\end{equation}
where Z = 1 is the ion charge, assuming a single degree of ionization,  $\ln \Lambda \approx 10$ is the Coulomb logarithm,
 ${T_{\textrm{eV}}} = 5$ is the electron temperature expressed in units of electronvolts. Using expression (4.1), we estimate the magnetic field dissipation time on the typical scale of the plasma flow L = 8 cm:
 \begin{equation}{\tau _d} = \frac{{4{\rm \pi} {r^2}\sigma }}{{{c^2}}} = 9 \times {10^{ - 5}}\;\textrm{s} \approx 90\; \mu \textrm{s}.\; \end{equation}
For comparison, the Alfvén time is  ${\tau _{A\varphi }} = r/{v_{A\varphi }} = 7 \times {10^{ - 7}}\;\textrm{s}$, while the sound crossing time is
 ${\tau _{\textrm{sound}}} = r/{c_s} = 7 \times {10^{ - 7}}\;\textrm{s}$, that is, about the same as the Alfvén time. This means that confinement of the central plasma occurs mainly by magnetic tension. Both Alfvén and sound crossing times are order of magnitude shorter than the transit time of the plasma formation (typically
 $20\;\mu \textrm{s}$), so the plasma reaches equilibrium configuration in radial direction and dynamical evolution of the plasma formation occurs primarily in axial direction.
We see that the experimentally observed magnetic field dissipation time of approximately 20 μs corresponds to the estimated time from expression (4.2) within a difference of several times. Theoretical prediction (4.2) gives too long dissipation time, because it does not take into account the decrease of conductivity  $\sigma $ away from the central axis and actual two-dimensional distribution of axial currents in the flow.
We do not have measurements of the temperature in the region where we do not observe optical emissivity, but the absence of optical emissivity and ambient plasma temperature data (Skladnik-Sadowska et al. Reference Skladnik-Sadowska, Dan'ko, Kwiatkowski, Sadowski, Zaloga, Paduch, Zielinska, Kharrasov and Krauz2016, Reference Skladnik-Sadowska, Dan'ko, Kharrasov, Krauz, Kwiatkowski, Paduch, Sadowski, Zaloga and Zielinska2018) allows us to put an upper limit of 1 eV on the temperature. With the expected ionization degree of around 0.1, still high enough for the formula (4.1) to be approximately applicable, conductivity  $\sigma $ decreases by approximately a factor of 10. The drop of the conductivity away from the central region near the symmetry axis causes current to be concentrated in the central core of about 1 cm. There are almost no currents flowing in the region of much higher resistivity from around 1 cm to 8 cm from the axis. The central current is closed at the periphery of the plasma flow (blue closed loops in figure 14), where conductivity of the plasma rises again, most likely, because of heating of the plasma behind the front shock. This hotter plasma flows on the sides of the moving central plasma formation and also creates the path of lower resistivity for the return current to flow (see the outer loop of return current in figure 14). If we use 10 times lower conductivity in (4.2) we obtain an estimate for dissipation time of approximately 9 μs, which is about half the length of the observed magnetic field dissipation time of approximately 20 μs. A more detailed calculation involving knowledge of the actual distribution of conductivity and actual geometry of the plasma formation should lead to a more accurate theoretical prediction for the dissipation time, but it is not practical to do in the present work owing to our poor knowledge of temperature distribution in the plasma flow.
Magnitude of the velocity vz decreases by a factor of three to five in the region between the position of the first probe z 1 = 40 cm and the position of the third probe z 3 = 74 cm. Transit time of the plasma formation between positions z 1 and z 3 can be estimated from the plots of the azimuthal magnetic field measured by the probes in figure 9(b,c) and is approximately 15 μs. Accordingly, we obtain an estimate approximately 15 μs of the braking time of the plasma flow. An elongated formation of ionized plasma with magnetic field propagates in an external neutral gas with a characteristic velocity vz ~ 5 × 106 cm s−1. This is a supersonic motion with respect to the speed of sound inside the plasma formation of approximately 1.4 × 106 cm s−1 and supersonic with respect to the speed of sound in an ambient neutral or weakly ionized (ionization degree up to 0.1) gas. The plasma flow can be slowed down due to the viscous force of the circumfluent external deuterium gas or due to the ram pressure of the external gas. The density of the external deuterium at an initial temperature of 293 K when prefilling the facility chamber and at a filling pressure of 0.9 Torr is  ${\rho _{\textrm{ext}}} = 2 \times {10^{ - 7}}\;\textrm{g}\;\textrm{c}{\textrm{m}^{ - 3}}$. Owing to conservation of mass this density remains approximately the same when molecular deuterium dissociates and is partially ionized due to heating from the pinch and plasma flow. To estimate the dynamic viscosity of atomic deuterium at a temperature of around 1 eV, let us first look up the dynamic viscosity of atomic hydrogen at 6000 K,
 ${\eta _\textrm{H}} = 6 \times {10^{ - 4}}\;\textrm{g}\;{(\textrm{cm\ s})^{ - 1}}$ (Vargaftik Reference Vargaftik1975). Both H and D are monoatomic gases with almost identical structures of electron clouds, therefore, the cross-sections for collisions are the same for both gases, the only difference being the factor of two in the mass of nuclei. As kinetic theory equations show (see, e.g., Hanley, McCarty & Intemann Reference Hanley, McCarty and Intemann1970, formula 1b), the dynamic viscosity is proportional to the square root of the weight of an atom and is proportional to the square root of the temperature. Thus, we arrive at an estimate of
 $\eta = 1.1 \times {10^{ - 3}}\;\textrm{g}\;{(\textrm{cm}\ \textrm{s})^{ - 1}}$ for the dynamic viscosity of atomic deuterium at 1 eV temperature. Viscous drag force is approximated by the Stokes formula for the laminar flow around a spherical body (the head front of the plasma flow) with radius 8 cm
 \begin{equation}F = 6{\rm \pi} \eta r{v_z} \approx 8 \times {10^5}\;\textrm{dyn} = 8\, \textrm{N}.\; \end{equation}
The length of the plasma formation can be estimated from the optical images in figure 9(a) to be 10 cm. Mass is concentrated within the central core of around 1 cm in radius, where optical emission is visible. Then, the total mass of the plasma flow is estimated as  $M = 1.6 \times {10^{ - 4}}\;\textrm{g}$. The viscous force (4.3) gives the plasma formation a negative acceleration
 $a = F/M = 5 \times {10^{9}}\;\textrm{cm}\;{\textrm{s}^{ - 2}}$, which would lead to deceleration of the plasma formation in a characteristic time
 ${\tau _{\textrm{visc}}}={v_z}/a \approx {10^{ - 3}}\;\textrm{s}$ in the absence of other retardation forces. This time is 70 times greater than the observed deceleration time of approximately 15 μs. Therefore, viscous friction does not play a role in the dynamics of the plasma flow.
The ram pressure of the external gas on the leading edge of the plasma flow is estimated as  ${\rho _{\textrm{ext}}}v_z^2 \approx 5 \times {10^6}\;\textrm{dyn}\;\textrm{c}{\textrm{m}^{ - 2}}$. It slows down the plasma formation of mass M and radius r = 1 cm with a force of
 $\sim {\rm \pi} {r^2}{\rho _{\textrm{ext}}}v_z^2 \approx 1.5 \times {10^7}\;\textrm{dyn}=1.5 \times {10^2}\;\textrm{N}$ and an acceleration of approximately 1.0 × 1011 cm s–2. The characteristic deceleration time of the plasma formation is
 ${\tau _{\textrm{ram}}}=5 \times {10^{ - 5}}\;\textrm{s}=50\;\mu \textrm{s}$. This time is close to the observed braking time of approximately 15 μs within the accuracy of our approximate estimates. From this we conclude that the ram pressure force of the external gas, in which the head of the plasma flow is moving, is the likely cause of the retardation of the flow. A comparison of figures 9 and 10 shows that a lighter plasma flow consisting of 75 % deuterium and 25 % neon mixture is decelerated faster, in approximately 12 μs. This tendency can be associated with a smaller mass M of the moving plasma formation in the latter case and, accordingly, a shorter retardation time under the action of the same ram pressure force of the incident flow of the external gas.
Thus, the results of a laboratory plasma focus experiment give an idea of the interaction of the head parts of astrophysical jets with the external environment, similar to the observed Herbig–Haro objects (Reipurth & Bally Reference Reipurth and Bally2001; Bally Reference Bally2007; Frank et al. Reference Frank, Ray, Cabrit, Hartigan, Arce, Bacciotti, Bally, Benisty, Eislöffel, Güdel, Beuter, Klessen, Dullemond and Henning2014) and hot spots at the ends of extended jets in radio galaxies. An estimate of hydrodynamic Reynolds number in the experiment is  $Re={v_z}L{\rho _{\textrm{ext}}}/\eta \approx 7 \times {10^3}$ and magnetic Reynolds number is
 $Rm=4{\rm \pi} \sigma {v_z}L/{c^2}\approx 60$, where we use typical size of the plasma formation
 $L=8\;\textrm{cm}$. For comparison, typical values of the Reynolds numbers in non-relativistic astrophysical jets are Re,
 $Rm \gg 1$. Therefore, a similarity criterion applies to both experimental and astrophysical settings, albeit with some stretch in the case of Rm describing the importance of resistivity: clearly, experimental plasma is much more resistive than astrophysical plasmas. Thus, laboratory measurements reflect the physical picture of astrophysical jet emissions, but with some caution regarding resistive effects.
Based on the results of the experiments described previously, we can draw the following conclusions.
(1) At the PF-1000 facility, the conditions typical for supersonic jets from young stellar objects were modelled. This makes it possible to study both the internal structure of jets and their interaction with the ambient gas.
(2) A mode with additional gas puff into the axial region of the discharge was implemented. Compact plasma formations of several centimetres with the shape dependent on the type of injected gas were obtained at a distance of 40 cm from the anode. An axial current flows inside these formations. This current creates an azimuthal (toroidal) magnetic field and is closed at the periphery of the plasma flow.
(3) Magnetic probe measurements of the Bφ field with radial resolution showed that the form of the radial distribution of the magnetic field outside the central current flow region has a form close to the functional dependence
 ${B_\varphi }(r)\propto 1/{r^n}$.
(4) As the plasma flow propagates along the axis of the facility from the generation site (anode) to a distance of 74 cm, the magnetic field and the associated currents were detected to fade whereby the level of the Bφ field decreased by more than an order of magnitude in some cases. At the same time, the longitudinal dimension of the plasma formation increased as it moved along the axis of the facility, and the flow decelerated during its interaction with the background gas. In some pulses a shift of the plasma flow as a whole relative to the axis of the facility was recorded.
(5) Compared with the case of prefilling with deuterium, when the leading front of the plasma flow had a quasi-spherical shape, in the case of combined mode of filling with deuterium a ‘funnel’ appears at the front of the flow in its axial part. It should be noted that, regardless of the method of filling the facility chamber with deuterium, the leading front of the axial plasma flow is observed not to develop pronounced instabilities at its outer boundary.
(6) Additions of gas (neon) with increased emissivity compared with deuterium result in radical change in the shape of the leading front of the plasma flow (funnel-shaped and conical). The information obtained on the shape of the leading front of the axial flow and the instabilities arising on its surface is important for verifying numerical codes used for modelling astrophysical jets of young stars, taking into account the possible admixtures of substances with high emissivity both inside the jet and in interstellar gas, with which it interacts.

Acknowledgements
The reported study was funded by Russian Foundation for Basic Research, project 18-29-21006_mk, and by the Research Program under Grant IAEA Nos 23071 and 23225, as well by the Polish Ministry of Science and Higher Education within a framework of the international co-financed projects.
Editor Troy Carter thanks the referees for their advice in evaluating this article.
Declaration of interests
The authors report no conflict of interest.