At the end of the nineteenth and early twentieth centuries, crude death rates from infectious illnesses fell dramatically in the United States. Between 1900 and 1930, the crude death rate from tuberculosis dropped by 63 percent and that of influenza and pneumonia fell by 82 percent (U.S. Census Bureau 1960, p. 26). The substantial decreases in mortality from infectious illnesses were followed by large gains to life expectancy and decreases in death rates for all age groups. Between 1900 and 1925, the infant mortality rate fell by 53 percent, and the death rate for those aged 45 to 54 fell by 15 percent (U.S. Census Bureau 1960, p. 29). In this research, I investigate to what extent rising individual income levels explain these rapid and profound declines in morbidity and mortality experienced by the United States.
The literature on the U.S. mortality transition between 1870 and 1930 attributes the sharp decrease in death rates from infection illnesses to the emergence of public health interventions in the period (Cutler and Miller Reference Cutler and Miller2005; Ferrie and Troesken Reference Ferrie and Troesken2005)]. With the acceptance of the germ theory of disease during the 1880s and 1890s, macro public health initiatives to improve sanitation, construct sewer systems, and chlorinate or filter municipal water sources have been credited as the drivers of the large declines in mortality. The literature on the U.S. mortality transition has also focused on the great advances in medical science during the early twentieth century and its role in reducing morbidity and mortality. While there were few effective medical treatments in the late 1800s, vaccines, which were discovered in the 1920s, and sulfa drugs, which were used in the 1930s, have been shown to contribute to early twentieth century declines in mortality (Jayachandran, Lleras-Muney, and Smith Reference Jayachandran, Lleras-Muney and Smith2010; McKinlay and McKinlay Reference McKinlay and McKinlay1977).Footnote 1
Abstracting from public health interventions and medical advances, I focus on the effects of improvements in socioeconomic status stemming from increases in individual income and show how profoundly income effects contributed to the mortality decline experienced between 1893 and 1906 in the United States. I contribute to a wide literature of income effects both on health and on channels, which led to changes in health status. As shown by Dora Costa (Reference Costa1995), increased income in this period led to a rise in retirement rates and allowed individuals to exit hazardous work environments. Increases in income also allowed individuals to alter their living arrangements and reduce crowding (Costa Reference Costa1997), which decreased prevalence rates of contagious illnesses. In addition, rising income led to improved nutrition levels: Thomas McKeown (Reference McKeown1976) argued that improvements in nutrition explain the majority of the mortality decline before 1900 in the industrialized world.Footnote 2 Similarly, Robert Fogel (Reference Fogel2004) shows that improvements in socioeconomic status over time led to increases in net nutritional status, body size, and longevity. However, Fogel emphasizes that increases in socioeconomic status come not just in the form of increased wages but also in the form of medical care to the individual as well as public health interventions. Fogel, therefore, highlights the difficulty in disentangling the effect of income on health as opposed to the effects of public health interventions or advancements in medical science.
By estimating the effect of income on health status at a time when effective medical care for the individual is largely absent, and by finding an exogenous source of variation in income which does not operate on health status through public health interventions, I disentangle confounding effects to estimate the impact of income on health. I investigate the contribution of increases in individual income to the decrease in adult morbidity and mortality by examining the cohort of Union Army soldiers who enlisted in the American Civil War. There are several advantages to using the Union Army dataset to examine my research question. First, the data set includes demographic and socioeconomic information for veterans until death. Second, the data include detailed information regarding a veteran's health that is not self-reported but rather recorded by surgeons employed by the Pension Bureau. Third, Union Army veterans received sizable and varying pension payments from the United States government that were documented from the time of a soldier's enlistment until his death. Finally, Union Army veterans are a representative sample of Northern white men of their birth cohort (as described in the Data section).
One drawback of using the Union Army dataset in this analysis is that veterans received pensions for disabilities. Since I test whether increases in pension income caused a decrease in morbidity and mortality, using cases in which veterans receive higher pensions for new disabilities will bias estimates. To circumvent the problem of reverse causality, the case in which an individual's health could influence his income, I use an exogenous source of variation in pension income: the presence of close elections for Republican Congressional candidates in the individual's district. As I show, there is evidence that Republican Congressional candidates boosted the pension income of veterans in an effort to secure votes in elections. The exclusion restriction is the following: Republican Congressional candidates affected the health of Union Army veterans through changes in pension amounts and not through another channel.Footnote 3 By providing quantitative and qualitative evidence, this analysis highlights the pervasiveness of patronage politics in the nineteenth century United States and shows how it helped shape the largest entitlement program the country had ever seen, one which absorbed 40 percent of the federal budget by 1890.
I use a proportional hazard model to estimate the effect of monthly pension income on the probability of contracting or dying from a set of illnesses. Estimating income semi-elasticities and proportional hazards for a variety of diseases, I find that the onset of respiratory, cardiovascular, and digestive conditions are significantly responsive to income.Footnote 4 In particular, I find that an extra dollar of monthly pension income, which is equivalent to 4 percent of a farm laborer's monthly earnings in 1900 (Preston and Haines Reference Preston and Haines1991, p. 212–20) or a 9 percent increase in the average veteran's monthly pension income, decreases the likelihood of developing a cardiovascular illness by an average of 25 percent, reducing the prevalence rate from 49 per 1,000 to 37 per 1,000.
When exploring the mechanisms by which pension income operates on health, I find that augmented pensions caused veterans to increase the number of children present in the household, which has differential effects on health depending on occupation of the veteran. The evidence suggests that the health of farmers improved most, relative to those in other occupations, because their children likely made positive contributions both within the household and on the farm. Conversely, an increasing number of children in the household worsened the health of manual laborers, most likely because these children did not contribute positively to the household. Instead, the children of manual laborers likely just contributed to crowding, which resulted in increased morbidity and mortality from contagious conditions. With regard to an increase in caloric intake, which has been highlighted in the literature as a main channel through which income affects health, I do not find evidence that veterans used increased pension income to improve their health through increased caloric intake. Finally, the estimates presented in this analysis are conditional on whether the veteran lived in an urban or rural setting and thus the effects found are not the result of differences in the urban/rural disease environment.
THE UNION ARMY PENSION IN THE PATRONAGE ERA
The U.S. political climate at the end of the nineteenth century was defined by protectionist tariffs, patronage politics, and, with the exception of the Cleveland administrations, Republican domination of the White House. In nearly every election cycle, Republicans and Democrats fought over how to spend the budget surplus, which resulted from the high tariffs, and the proper way of reforming the patronage system. In this political environment, the Union Army pension system, initiated in 1862 to provide assistance to veterans suffering from war-related disabilities, evolved into a large-scale entitlement program. When campaigning, Republicans advocated spending the budget surplus on augmenting the Union Army pensions. As benefits increased, the budget surplus quickly became a deficit. Therefore, the Republican strategy to boost votes led to a budget deficit and thus the loss of a Republican majority in Congress in 1891.
PASSAGE OF THE GENERAL LAW OF 1862 AND INVALID PENSIONS ACT OF 1890
During the Civil War, 2.7 million men enlisted, and 87 percent of recruits survived the war (Dyer Reference Dyer1959). These veterans could qualify for public assistance. Under the General Law passed on 14 July 1862, veterans became eligible for a pension if their physical disabilities were shown to result from the war experience. Therefore, the General Law excluded veterans whose disabilities resulted from aging or any incidents unrelated to the war. Disabilities pensioned under the General Law included loss of sight, hearing, limbs or their usage, and illnesses caught while in the camps. To determine whether a causal link existed between illnesses/injuries and war experience, veterans were required to undergo medical examinations by physicians, called examining surgeons, hired by the Pension Bureau. Upon completion of each exam, examining surgeons filled out a surgeons’ certificate, which was then sent to the Pension Bureau and added to the veteran's application for pensions.
Under the Invalid Pensions Act of 27 June 1890, which awarded pensions to veterans with disabilities from causes other than the war, previously excluded veterans were finally able to claim pensions on the basis of disability status (Glasson Reference Glasson1918, p. 126). The passage of the Invalid Pensions Act of 1890 enabled thousands of veterans to begin receiving pensions causing the federal government to go into deficit. By 1892, expenditure on veterans’ compensation and pensions accounted for approximately 40 percent of the federal budget (U.S. Census Bureau 1960, p. 718).
In 1907, the pension system changed once again, by granting payouts based on the veteran's age. Pension payments were substantial for the time and large enough to allow veterans to retire (Costa Reference Costa1995). In 1900, the average pensioner received $10.02 per month, which was approximately one-half of the average monthly income of a farm laborer (Preston and Haines Reference Preston and Haines1991, pp. 212–20). By 1890, the Union Army pension was comparable to today's Social Security Program in that approximately 42 percent of income is replaced by the Social Security Administration upon retirement.
THE PENSION OFFICE: A POLITICAL MACHINE
During the 1870s and 1880s, many Republican candidates began boosting pensions awarded to veterans in their constituency in an effort to secure the veteran vote. Evidence of this practice is abundant. Perhaps the best set of evidence regarding Republican practices at the Pension Bureau comes from the testimony and evidence given at the 48th Congress’ session of the Committee on the Payment of Pensions, Bounty and Back Pay, in which the adjudication of pensions was investigated.Footnote 5 The Committee Report, which contains more than 400 pages of testimony of the Commissioners, special examiners, clerks, and medical reviewers of the Pension Bureau between 12 January 1885, and 27 February 1885, provides detailed information on the process by which pensions were boosted during election seasons.
To secure the votes of Union Army veterans, Republican Congressional candidates wrote letters to the Commissioner of the Pension Bureau on behalf of constituents who had previously applied for pensions. For cases in which a veteran was still waiting for his application to be processed by the Bureau, the candidate asked that the Commissioner speedily review the case and send special examiners to the district if there were remaining questions about a veteran's claim. For veterans already receiving pensions and having applied for an increase, candidates requested that the Commissioner either increase the pensions or that he similarly send a special examiner to the district to reassess the case. In their letters, Republican candidates frequently were found expressly stating that they were interested in boosting pensions in order to win the upcoming election.Footnote 6
The Commissioner, who hired mostly Republican clerks at the Bureau, gave priority to the processing of the claims of veterans in the Republican candidate's district, especially during election seasons.Footnote 7 Clerks were not in charge of deciding the amount of pension paid to veterans. Instead, the Medical Reviewers of the Pension Bureau decided the dollar amount (United States Pension Bureau 1882, p. 9). Clerks had the power to stall the application of veterans during election seasons to prevent the loss of votes to Democrats.Footnote 8 Clerks also had the power to reject an application but were advised not to do so during election seasons. Therefore, the Pension Office remained a Republican political machine used to secure the veteran vote throughout the patronage era.
Democratic candidates for Congress were unable to boost the pension payments of their veteran constituents because of the partisan nature of the Bureau during this period. Additionally, there is evidence that veterans supporting Democratic candidates were threatened with the loss of their pension or with having their applications stalled indefinitely by special examiners sent from Washington into districts during election season to aid the Republican cause.Footnote 9
The partisan practices of the Pension Bureau continued through the late 1880s and into the 1890s. During the election of 1888, Civil War veteran and New York commander of the Grand Army of the Republic James Tanner “had, by his own account, ‘plastered Indiana with promises’ of more generous pensions under the Republicans. ‘God help the surplus revenue!’ the new commissioner declared, as he set about handing out new and readjusted pensions with gusto.”Footnote 10
DATA
I study these issues using the Union Army data set, which consists of information about the military experience, post-war health conditions, and socioeconomic status of veterans (uadata.org). The dataset is compiled from three sources: the military, pension and medical records; surgeons’ certificates; and census records. The military records contain demographic and socioeconomic information about the soldier at the time of his enlistment. The pension and medical records provide detailed information regarding the veterans’ experiences with the Union Army pension.
Since two-thirds of white men between the ages of 20 and 45 served in the Union Army, the more than two million men who served were representative of the general population of white men in the North (Costa and Kahn Reference Costa and Kahn2008, pp. 2–3).Footnote 11 Of the men who served in the Union Army, records for 35,570 white men were compiled. Regiments in the Union Army were comprised of ten companies. The Fogel group compiled information for men within 303 companies selected at random.
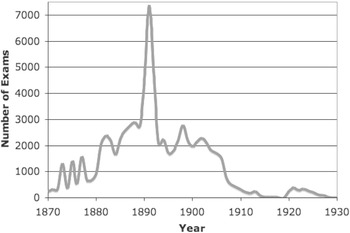
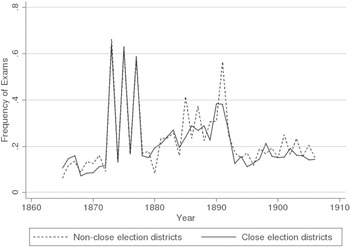
Figure 1 shows the total number of exams undergone by veterans applying for new pensions and pension increases between the years 1865 and 1935. Since veterans underwent many physical examinations, either to apply for the first time or to apply for an increase, health information is available over time. One applicant could undergo as many as 30 exams. Of those on the pension rolls by 1893, each veteran had an average of 5.45 exams. The average exam year for all veterans in the sample was 1892 (the median was 1891), coinciding with the passing of the 1890 Act, which awarded pensions for disabilities. Given the dramatic spike in the number of exams shortly after 1890, it is unlikely that over 4,000 veterans suddenly contracted pensionable illnesses between 1890 and 1892. Instead, veterans were most likely reporting illnesses they faced during the 1870s and 1880s, which were not pensionable under the Law of 1862. Because veterans underreported non-war-related illnesses during the 1870s and 1880s, I focus on the sub-sample of those who were pensioned by 1893. When constructing the dependent variables of disease onset, I use information on illnesses reported prior to 1893 as a control but not as an outcome variable of disease onset because these illnesses were likely to be reported years after the veteran faced initial symptoms. Disease conditions for the sample are sometimes the result of the war experience and sometimes the result of aging. I choose the year 1893, as opposed to 1891 or 1892, as the starting year so that the dataset includes nearly all eligible veterans and not just the set of veterans who managed to get onto the rolls right after the passage of the 1890 law. I also restrict the subsample to those who were admitted onto the pension rolls.Footnote 12
NUMBER OF EXAMS PER YEAR

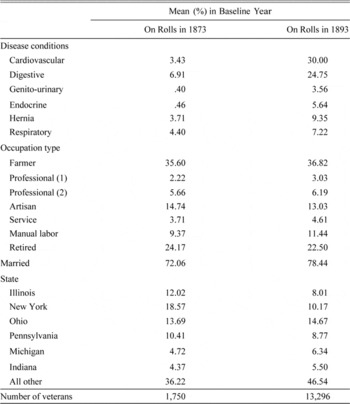
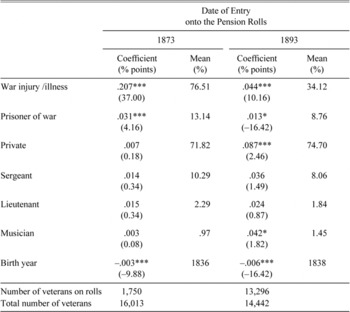
Table 1 shows summary statistics for the veterans who were on the pension rolls by 1873 and for those who were on the rolls by 1893 to highlight the way in which changes in pension laws affected the type of veteran who became a pension recipient in the late nineteenth century. For those on the rolls in 1873, 4.4 percent suffered from respiratory conditions, 6.91 percent suffered from digestive conditions, and 3.43 percent suffered from a cardiovascular condition in 1873. For those on the rolls in 1893, 7.22 percent suffered from a respiratory condition, 24.75 percent suffered from digestive conditions, and 30 percent suffered from cardiovascular conditions. Veterans of both the 1873- and 1893-sample were likely to be farmers or retired. Few veterans were professionals of type 1 or 2.Footnote 13 Veterans from both samples come largely from New York, Pennsylvania and the Midwest. Table 2 presents probit regressions in which I use wartime indicators to predict the likelihood that a veteran would be in the 1873- or 1893-sample in the baseline year. Veterans were 20.7 percent more likely to be on the pension rolls by 1873 if they were wounded or had a wartime illness. Of veterans in the 1873-sample, 76.51 percent were wounded or suffered a wartime illness as compared with only 34.12 percent in the 1893 sample. From Table 2, it is clear that veterans on the pension rolls by 1893 were on average two years younger than those on the rolls by 1873.
In order to determine the Republican Congressional vote share of each veteran's district, it was first necessary to determine the district of residence for veterans in each year. Since the Union Army sample contains the state and city of residence as well as the exact street address of veterans from first pension receipt until death, I matched each veteran to his associated Congressional district between 1870 and 1910.Footnote 14 Since district boundaries change rapidly during this period, veterans had to be rematched to districts to account for border changes. Even during years in which a veteran remained at the same residence, he could still be counted as being in a new district if boundaries were redrawn.
SUMMARY STATISTICS FOR UNION ARMY VETERANS

Note:
Conditions listed can be the result of aging or the war experience.
Source:
Author's calculations.
To account for changes in district lines, I matched each veteran's address to district maps for census years 1870 to 1910.Footnote 15 Having matched veterans to their district in each year, I then collected election returns for each district in the United States between the years 1870 and 1910.Footnote 16 It was necessary to collect this new dataset of Congressional Election returns by district and to create new district maps, as opposed to using the Inter-university Consortium for Political and Social Research (ICPSR) Historical Election Returns Series and Geographic Information System (GIS) county maps from the National Historical Geographic Information System's (NHGIS) Historical state and county boundary files (1790–2000), for two reasons. First, while the ICPSR data set links counties to districts, it is not possible to be certain of a veteran's district simply by determining his county. This is because many counties were split into multiple districts. Therefore, matching a veteran's address to a county, using GIS county maps, and linking the county to an associated district, using the linkages provided in the ICPSR's Historical Election Returns, 1824–1968, is an inaccurate approach.Footnote 17
PROBIT REGRESSION—PREDICTING VETERAN'S ENTRY ONTO PENSION ROLLS

Notes:
t statistics in parentheses. *p < 0.05, **p < 0.01, ***p < 0.001.
Source:
Author's calculations.
Second, the ICPSR series contains vote totals by county as opposed to district. While counties are matched to districts in this series, it is not possible to compute the Republican vote share for a district by summing Republican votes over the counties in a district (and dividing by total votes) because one county could lie in two different districts. Therefore, I collected a new series of election returns by district that are linked to a new set of GIS maps with historical Congressional district boundaries.
In the analysis, I use county-level data from the ICPSR's Historical Demographic, Economic and Social Data: The United States, 1790–2002. In particular, I use farm values per acre as a proxy for changing wealth levels in the county. Information on the population size of U.S. cities is from the U.S. Census Bureau.Footnote 18
IDENTIFICATION
Under the pension acts prior to 1907, veterans could only receive pensions based on health status. Because of this fact, pension income is endogenous to health outcomes. Since veterans receiving larger pensions were likely to be in worse health and likely to have continually deteriorating health, relative to those who received smaller pensions, it is difficult to identify the true effects of income on health without finding an exogenous source of variation in pension income. In addition, it is likely that estimates of the effect of pension income on health will be biased downward causing it to seem as though pensions increase the chance of sickness in veterans. However, in actuality, it may simply be that poor health status initially has overshadowed the effects of income. While controlling for prior health status partly controls for this effect, it is preferable to use an exogenous source of variation in pension income. I use variation in Republican Congressional vote share.
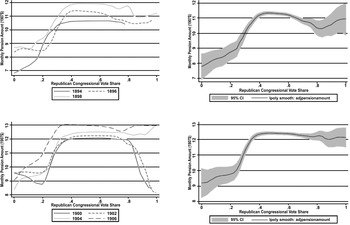
Figure 2 shows graphs of the relationship between the average monthly pension amount and the Republican Congressional vote share in a district both with and without 95 percent confidence intervals. In particular, it is clear that as the Republican Congressional vote share increases, the average monthly pension amount awarded to veterans first increases and then usually tapers off once the vote share nears 40 percent. Since third party candidates sometimes absorbed nearly 10 percent of the vote share in a Congressional election, a Republican vote share of 40 percent would represent a close race for a Republican candidate. While pension amounts are maximized when Republican vote share is above 40 percent, veterans living in staunchly Republican districts with Republican vote shares of more than 60 percent received more pension income than their counterparts living in staunchly Democrat districts. Therefore, it appears that the highest pension awards went to those living in close districts, lower awards went to those in staunchly Republican districts, and the lowest awards went to those in Democratic districts. I construct a panel over individuals and years. Since Congressional elections are bi-annual (with the exception of special elections), the Republican vote share in non-election year t is equal to the Republican vote share in election year t − 1. To capture the upward-trending curve seen in Republican vote share, I use the following first-stage specification in which the Republican vote share variable enters quadratically:
DISTRICT VOTE SHARE AND PENSIONS FOR ELECTION YEARS 1894–1906


where p = monthly pension income in 1907 dollars, v = Republican congressional vote share, i = individual, t = year, C = set of demographic and socioeconomic controls, and e is the error term. Controls include rank while in the army, birth year, time trend, county population, average farmland value per acre, prior health status, prisoner-of-war status, battle wounds, population of the county, and state fixed effects. Each of these can affect income. High-ranking veterans received higher pensions than their lower-ranked counterparts. It is important to control for birth year because incidence of disease increases with age. County-level average farmland values per acre are used to control for increasing wealth in the county. County-level population counts (per 100,000), which are only available for census years, were linearly interpolated for years between census years.Footnote 19 Controlling for population size of the veteran's county and including state fixed effects is necessary because the ability to access the Pension Bureau and attain a pension could vary between rural and urban counties as well as across states.Footnote 20
For the purpose of hypothesis testing, I cluster the standard errors by district and year in the first stage. This is because the unit of observation is the individual in a particular year. However, the vote share variables are the same within a district-year. Therefore, they are perfectly correlated across all individuals within a district-year.
HAZARD MODEL USING CONTROL FUNCTION APPROACH
A seemingly simple method to estimate elasticities of income on health in this setting would be to use a two-stage least squares approach. However, this approach will lead to biased estimates because 33.5 percent of veterans who are on the rolls by 1893 died prior to 1906.Footnote 21 If a two-stage least squares approach is used, results will be biased to reflect the disease and mortality experience of veterans who live the longest and are thus observed for more periods in the sample.
Therefore, to estimate semi-elasticities, I use a Weibull proportional hazard model to predict the effect of an extra dollar of monthly pension income on the probability of mortality (or disease onset). Using specific disease outcomes in the analysis, I group the morbidity and mortality events (failures) into one of the following six categories: respiratory, cardiovascular, digestive, endocrine, genito-urinary, and hernia.Footnote 22 Therefore, I estimate the probability of failure f, when multiple causes of failure are possible, by treating failures other than f as censored cases (by right-censoring on death). An assumption of the model is that competing risks are independent.Footnote 23
Because the model is non-linear, I choose not to use instrumental variables.Footnote 24 Instead, I use the control function approach in which the monthly pension income, control variables, and the residual from the first stage is included in the hazard regression.
In the second-stage, I choose

to maximize the likelihood function
![\[
\begin{array}
/Sigma _i=1^N /Sigma_b=1893^1906 {a_it log[e^k_it/beta /alpha t^/alpha ^-1] + (1 - a_it)(-t^/alpha e^k_it^/beta)},
\end{array}
\](https://static.cambridge.org/binary/version/id/urn:cambridge.org:id:binary:20160921010134415-0988:S0022050715000674:S0022050715000674_eqnU3.gif?pub-status=live)
where

The term a it is an indicator variable equal to one if the veteran is alive and 0 if dead or if t = 1907. Veterans who have died do not contribute to the likelihood after their death although the hazard model treats them as at risk for the illnesses that they have not yet had.Footnote 25
Since the model is a proportional hazard model, it is possible to interpret the effects of a change in income on the hazard. A negative coefficient indicates that the time until failure increases as income increases, which is equivalent to a negative effect on the hazard or the probability of disease onset.
The standard errors of the second stage do not take account of the fact that the residual from the first stage, which enters in the second stage, is estimated with error. Because of the difficulty in making the usual correction for this in a non-linear setting, I bootstrap the standard errors. However, bootstrapping is only necessary if the coefficient on the residual is significantly different from zero in the second stage (Imbens and Wooldridge Reference Imbens and Wooldridge2007, p. 9).
RESULTS
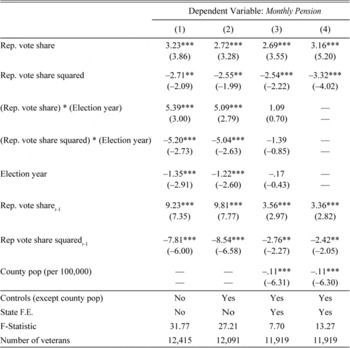
First-stage results are presented in Table 3. The magnitude of the coefficients on Republican vote share and the square of Republican vote share are similar. This suggests that pension income is maximized when elections are close. When the controls are included, an increase in the Congressional Republican vote share of a veteran's district from 0 percent to 48 percent (the maximum) is associated with an approximately $0.75 increase in monthly pension income. The coefficients on Republican vote share in period t – 1 and Republican vote share squared in period t – 1 suggest that living in previously close election districts are rewarded by pension boosts in the current period.Footnote 26
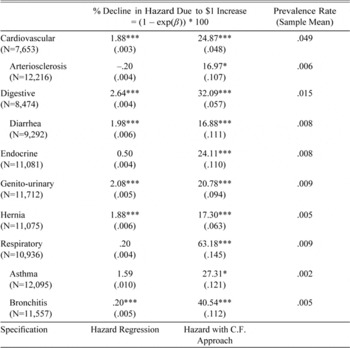
Table 4 shows hazard regression estimates of disease onset, which is separated into anatomical groups. Regressions with and without the control function are presented as well as the prevalence rate for each disease condition, which is equivalent to the sample mean of the morbidity indicator. Table 4 shows that respiratory conditions are income sensitive using the control function approach to correct for reverse causality. Correcting for reverse causality, an extra dollar of monthly pension income, which was usually a permanent increase, decreases the probability of the onset of a respiratory condition by 63.2 percent, which is equivalent to a reduction in the prevalence rate of 6.1/1000. Of veterans with a respiratory condition, 32 percent had asthma, and 13 percent had bronchitis. As shown in Table 4, an extra dollar of monthly pension income lowers the onset of asthma by 27.3 percent and bronchitis by 40.5 percent. Both of these disease conditions are usually chronic and brought on by infection and/or poor air quality associated with crowding.
Table 4 also shows effects for the onset of other disease conditions. In particular, an extra dollar of monthly pension income causes a 32.1 percent decline in the prevalence rate of the onset of any digestive condition. As with respiratory illnesses, digestive illnesses in this period were often the result of infection.
With regard to cardiovascular illnesses, an extra dollar of pension income decreases the likelihood of the onset of a cardiovascular illness by 24.9 percent a decrease of 12.2 per 1,000 in the prevalence rate. Cardiovascular conditions such as arteriosclerosis and enlarged heart are conditions associated with affluence and seen in high rates in developed nations. However, individuals who suffered from acute infections, such as rheumatic fever, could sustain damage to their heart valves. Therefore, inasmuch as income could ward off infectious illnesses, it could also prevent the likelihood of heart disease resulting from acute infections.
FIRST STAGE RESULTS FOR HAZARD MODEL SPECIFICATION

Notes:
Election Year is a dummy variable equal to one in an election year. The specification in column (4) is used in hazard specification. t statistics in parentheses. Monthly pension income in 1907 dollars. Controls: Rank in the army, prisoner-of-war status, war wounds and dummies for previous illnesses, birth year, time trend, and average farm value per acre. * p < 0.05, ** p < 0.01, *** p < 0.001. Clustered by year and district. Number of veterans: 12,091.
Details on sample: A balanced panel (over individuals i and years t) has been constructed. The sample spans the years 1893 to 1906 inclusive.
Source:
Author's calculations.
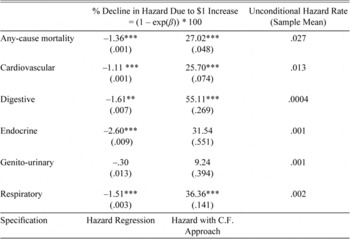
Table 5 shows the effects of income on the crude death rate (any-cause mortality) and on cause of death. I find that an extra dollar of pension income lowers the unconditional hazard rate by 27.0 percent from 27 per 1,000 to 20 per 1,000. I also find large income effects for respiratory, digestive and cardiovascular illnesses. However, I do not find significant income effects for endocrine and genito-urinary conditions.
HAZARD REGRESSION ESTIMATES OF THE ONSET OF DISEASE

Notes:
Standard errors of coefficient in parentheses. * p < 0.05, ** p < 0.01, *** p < 0.001.
Controls: County population, state dummies, time trend, first-stage residual, birth year, county-level average farm value per acre, rank in the army, prisoner-of-war status, war wounds, and previous illnesses. Clustered by year and district.
Source:
Author's calculations.
While the morbidity and cause-specific mortality results are informative, the most robust estimate is that of the coefficient on pension income when mortality from any cause is the dependent variable in the regression. This is because of the following reasons: (1) Most obviously, death from any cause is easy to determine; (2) Cause of death is often omitted from death certificates in the period; (3) Specific cause of death can be difficult to ascertain if a physician is not present at the time of the veteran's death; and (4) Even if a physician is present at the veteran's time of death, it may still be difficult to distinguish the cause of death from contributing causes of death. For these reasons, I focus on death from any cause when considering the mechanisms by which income can affect health in the next section.
HAZARD REGRESSION ESTIMATES FOR MORTALITY

Notes:
Standard errors of coefficient in (). Number of vets: 12,091. * p < 0.05, ** p < 0.01, *** p < 0.001. Controls: County population, state dummies, time trend, first-stage residual, birth year, county-level population average farm value per acre, rank in the army, prisoner-of-war status, war wounds, and previous illnesses. Clustered by year and district.
Source:
Author's calculations.
MECHANISM
Income changes can alter an individual's standard of living and thus their health by allowing individuals to improve their nutritional status. Fogel (Reference Fogel2004) emphasizes the relationship between body mass index (BMI) and mortality. Individuals have benefitted from increased control over their environment (food production, in particular), have become more physically robust, and have developed progressively stronger vital organs over the past 300 years. To explore whether changes in BMI may be driving the results of this research, I use the same first-stage specification outlined previously but instead replace monthly pension income with BMI as the dependent variable and include individual fixed effects.Footnote 27 The coefficient on vote share was not significant, which suggests that changes in net caloric intake amongst veterans varied independently of vote share. Since the average BMI in the sample is 22.7 in 1893, and since less than 5 percent of veterans had a BMI below 18.5, veterans were likely not suffering from calorie deprivation. It may be however that increased income operated on health by improved quality of food consumed as opposed to the quantity measured in calories.
Other possible ways in which pension income may have operated on health is through changes in living arrangements and by increasing the likelihood of retirement as Costa has shown (Costa Reference Costa1997; Costa Reference Costa1995). To determine whether living arrangements might be a mechanism by which income affects health, I first consider whether increases in pension income cause the number of children living in the household to increase in 1900. Instrumenting for pension income, I find that an extra dollar of monthly pension income causes the number of children in the household to increase by approximately 0.1 children.Footnote 28 Then, I explore the differential effects of increases in the number of children in the household on health outcomes by veteran's occupation type.Footnote 29
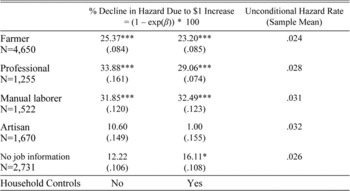
Table 6 shows the coefficient estimates on pension income when the sample is split by occupation type and when household composition controls are included. The two controls for household composition are the following: (1) the ratio of the number of children under age six in the household relative to the total number of people in the household. This is a measure of dependents to workers in the household; (2) Dummy variables for the number of individuals in the household ranging from 1, 2, …14, and 15 or more. Table 6 shows that when I control for household composition, the percent decline in the hazard shifts from 25.4 percent to 23.2 percent for farmers, which suggests that pension income operates on health through the increase in the number of children in the household. In the case of farmers, increasing the number of children in the household may be beneficial if children can provide labor on the farm or in the household itself. Conversely, when considering manual laborers, controlling for household composition increases the coefficient on pension income, which suggests that increasing the number of children in the household hurts the health of manual laborers. This perhaps may be because children cannot contribute to the household and instead only drain resources. However, given data limitations, it is not possible to directly observe the contributions of children to the households of farmers or manual laborers.
MECHANISMS: HAZARD REGRESSIONS FOR DEATH FROM ANY CAUSE (WITH FAMILY COMPOSITION CONTROLS)

Notes:
Standard errors of coefficient in (). * p < 0.05, ** p < 0.01, *** p < 0.001.
Controls: County population, state dummies, time trend, first-stage residual, birth year, county-level population average farm value per acre, rank in the army, prisoner-of-war status, war wounds, and previous illnesses. Household controls include the ratio of number of children under age six to total household members and dummy variables for the number of people in the household. Clustered by year and district.
Source:
Author's calculations.
ROBUSTNESS CHECK—MIGRATION
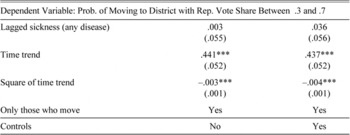
The results of this research hinge on the assumption that sick veterans do not migrate to districts in which Republican Congressional candidates face close elections in order to secure higher pensions. For simplicity, I check whether veterans that move are likely to move to districts in which a Republican Congressman may perceive the election to be “close” and therefore define “close” as a Republican vote share lying between 0.3 and 0.7 inclusive. Candidates were likely to perceive an election as being close simply if the race had a candidate from another party present. Therefore, I use the wide span of 30 percent to 70 percent to define a “close” vote. Of veterans that move to new districts, an average of 10.44 percent (st. dev. = 0.306) migrate from districts in which Republican vote share was below 30 percent or above 70 percent to districts in which Republican Congressional candidates faced close elections. Therefore, veterans who moved chose districts with closer elections. However, to more concretely determine whether sicker veterans migrated to more Republican districts, I use a simple conditional logit model of migration. The dependent variable is the probability that a veteran moves to a new district with close elections when the originating district did not have close elections. The independent variable is the incidence of any disease in the year t – 1. The model has the following form:
![\[
\begin{array}
Prob(move_it =1) = 1/(1 + exp[-(/beta_0 + /beta_1 sick_i,t-1 + /Gamma C)])
\end{array}
\](https://static.cambridge.org/binary/version/id/urn:cambridge.org:id:binary:20160921010134415-0988:S0022050715000674:S0022050715000674_eqnU5.gif?pub-status=live)
where sick is a dummy variable equal to 1 if a veteran has any illness in a given year and C are a set of controls. Controls include a quadratic time trend, BMI, rank in the army, marital status, occupation, retirement status, prisoner-of-war-status, and war wounds.Footnote 30
The results presented in Table 7 show that if a veteran was sick with any illness in the previous period, he is not more likely to move to a district in which the Republican Vote Share lies between 0.3 and 0.7. Therefore, while many veterans were migration in the period, they did not appear to be moving to close election districts upon falling sick.
ROBUSTNESS CHECK—FARMLAND VALUES
If Republican Congressional candidates were able to raise income and wealth levels in their districts through means other than increasing the pensions of Union Army veterans, then the identification strategy of this research breaks down. One check on the candidates’ abilities to affect the health of their constituents through practices, which increased income or wealth, other than boosting pensions is to determine the effect of close elections on farmland values. Farmland values are a particularly good measure of overall economic prosperity in a veteran's district because the majority of veterans lived in rural areas.
LOGIT MODEL OF MIGRATION

Notes:
Number of veterans: 8,193. Controls include BMI, rank, marital status, occupation, retirement status, prisoner-of-war status, and war wounds.
p < 0.05, ** p < 0.01, *** p < 0.001. Standard errors in parentheses.
Source:
Author's calculations.
Data on the average value of farm land per acre stratified by county over the years 1870 to 1930 come from Michael Haines’ ICPSR's Historical, Demographic, Economic and Social Data: The United States, 1790–2002, Dataset 2896 Part 106. I match each county to its associated district and Republican Congressional vote share.Footnote 31 I use the following specification:

where logfarm is the log of average farmland value per acre, vote is an indicator variable equal to 1 if Republican vote share is between 0.3 and 0.7 inclusive, C is a set of controls including year fixed effects, district time trends, and district fixed effects, d denotes the district, and t denotes time.
There is no significant effect of the closeness of elections for Republican Congressional candidates on farmland values per acre. The coefficient on the close-election indicator variable is −0.006 and is not significant.Footnote 32
ROBUSTNESS CHECK—FREQUENCY OF EXAMS ACROSS DISTRICTS
In order to use the presence of close elections for Republican Congressional candidates in a pensioner's district as an exogenous source of variation in pension income, it cannot be the case that the likelihood to apply for a pension (and then undergo exams) varies between close election districts and non-close election districts. Since the quadratic first-stage specification does not easily translate graphically, I once again define a “close” election to be one in which the Republican vote share lies between 0.3 and 0.7 inclusive. Figure 3 shows the frequency of exams per year for those already on the pension rolls. Between 1893 and 1906, which are the exam years in the estimation sample, there is little difference in the frequency of applications between close and non-close election districts.
FREQUENCY OF EXAMS PER YEAR FOR THOSE ALREADY ON THE ROLLS

ROBUSTNESS CHECK—FRAUDULENT MEDICAL CLAIMS
The empirical strategy of this research hinges on the validity of the statements testifying to the diseases faced by veterans on surgeons’ certificates. It does not affect this research if examining surgeons embellished the severity of illnesses faced by veterans because I am testing the effect of pension income on the first incidence of the disease.Footnote 33 Physicians were instructed to rate the severity of the illness as opposed to stating opinions as to how much money a veteran deserved based on his illness.Footnote 34 In data cleaning, disease conditions preceded by adjectives such as “severe” or “acute” were ignored as were explicit descriptions. For example, if a surgeon states that a veteran has “severe” asthma and had “prolonged inspiration, shortened expiration, and whistling heard all over the lungs” during an exam, as was the case for veteran Henry Greeley during his first exam in 1888, the dummy variable for asthma would be one for the year 1888 until Greeley's death. Alternatively, if the examining surgeon had simply described Greeley's condition as “asthma caught at camp Banks at Georgetown,” the dummy variable would still equal one. Therefore, the asthma variable is simply a dummy equal to one if the surgeon diagnoses the veteran with asthma, using the exact word “asthma,” and zero otherwise.
It is, however, imperative that surgeons report the correct disease conditions as opposed to fabricating a story of illness when the veteran is perfectly healthy. If surgeons made honest mistakes when diagnosing patients, this would just create noise in the dependent variable but would not bias coefficient estimates. However, if surgeons diagnosed veterans with fictitious illnesses when in fact they were perfectly health, then this would bias income effects downward because otherwise healthy veterans with high pension incomes would look sick. However, since veterans did not see the same surgeon at each exam, and since surgeons did not receive disease information for a veteran prior to each exam, it is possible to test whether veterans exhibit the same disease conditions across exams.
To test whether veterans exhibit the same disease across exams, it is necessary to consider an illness that cannot resolve between exams. Therefore, I check whether the presence of any type of hernia, which was normally permanent amongst the Union Army cohort, changes within an individual's record over time (as individuals undergo new exams). Of veterans who had ever had a hernia period to their last exam, 97.4 percent still had the hernia at the time of their last exam. Other conditions such as arteriosclerosis are considerably more difficult to diagnose across exams. Of those who had arteriosclerosis prior to their last exam, only 84.4 percent still had the condition on their last exam. Similarly, of those with emphysema, which is an incurable lung condition, prior to their last exam, 87.9 percent are shown to still have the condition on their last exam.
ROBUSTNESS CHECK—UNDERREPORTING OF NEW ILLNESSES AFTER RECEIPT OF PENSION
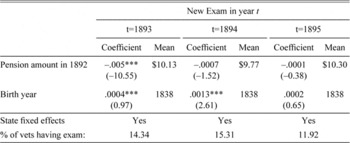
One concern is that those receiving large pensions by 1893 would not be incentivized to report new illnesses because they would not be able to attain another increase in pension income. Conversely, veterans who were receiving relatively low pensions might be more incentivized to go for a new exam in hopes of increasing their pension awards. If veterans were incentivized to apply for increases, and therefore go for more exams, conditional on their previous pension awards, then the results of the disease onset regressions presented in Table 4 could be biased upwards.
To test this concern, I use a probit model to test whether the monthly pension amount received at the end of 1892 predicts a new exam in 1893, 1894, and 1895. The results are reported in Table 8. Receiving an extra dollar of monthly pension income in 1892 is associated with a 0.5 percent decrease in the chance that a veteran has an exam in 1893. In 1894 and 1895, the pension amount received in 1892 does not significantly predict whether a veteran will have an additional exam. Therefore, while receiving a lower pension income does predict an increased chance of a new exam in 1893, the effect is small and disappears in subsequent years.
ROBUSTNESS CHECK—“OVER-REPORTING” ON SURGEONS’ CERTIFICATES
In this research, I show that veterans living in close elections districts received increased pension awards. This may be because surgeons more closely examined veterans from close election districts, and thus described more of the veteran's health conditions on the surgeons’ certificate, in order to help the veteran secure a pension for disability. By contrast, in landslide districts surgeons may have only included a minimal number of conditions on the surgeons’ certificate because providing a pension increase and courting the veteran's vote was not a priority in these districts. Therefore, this type of bias present among examining surgeons would downwardly bias the coefficient on pension income in Tables 4 and 5. This is because it would appear as though living in a close election district brought about an increased number of illnesses relative to the number faced by those living in landslide districts. However, the bias, if present, strengthens the main results of the article.
PROBIT REGRESSION—PREDICTING NEW EXAMS FOR THOSE ON ROLLS BY 1893

t statistics in parentheses. * p < 0.05, ** p < 0.01, *** p < 0.001. Number of veterans: 11,755.
Source:
Author's calculations.
CONCLUSION
In this research, I explore the impact of income on adult health at the end of the nineteenth and early twentieth century. To circumvent reverse causality—the scenario in which health influences income—I use an exogenous source of variation in pension income: the presence of close elections for Republican candidates of a pensioner's Congressional district. I find large effects and conclude that increases in income, in the absence of public health interventions or medical advancements, profoundly influenced the health trajectories of male cohorts born in the mid-nineteenth century for the better. In particular, I do not find that increased pension income operated on health through increased caloric intake, which is a mechanism widely discussed in the literature on the U.S. mortality transition (Fogel Reference Fogel2004; McKeown Reference McKeown1976). Instead, I find that increased pension income caused veterans to have more children, which had differential effects on health depending on the occupation of the veteran. In particular, the health of farmers was more improved relative to the health of those in other occupations.
The results of this research shed light on current debates regarding the health benefits of cash transfers to adults living in developing nations in which the socio-economic status (SES) gradient in health is large, as was the case in the United States a century ago. Entitlement programs providing cash transfers, of particular interest today, are the South African pensions and Mexico's Oportunidades system. Anne Case (Reference Case and Wise2004) uses data on the South African pension system to determine the effect of income on health status, but is unable to make specific assessments regarding the health of recipients because health status is self-reported in the sample. Investigators of income's effect on health using data from the Oportunidades program suffer from the same problem as most information on health status is similarly self-reported. For regions in which individuals suffer from high rates of infectious illnesses, the results of this research suggest that cash transfers have large benefits. In light of the results, it appears that the tradeoffs between providing cash transfer to adults in developing countries as opposed to public health interventions is narrower than previously thought.
The results of this research are also pertinent to discussions of the relationship between income and retirement, as income may act on retirement through health. First, the design of pension systems in countries with wide SES gradients in health must account for positive income effects on longevity. Second, since income affects current health status and expected longevity, individual decisions regarding labor force participation and retirement are ambiguous and would be an interesting avenue for further research.