1. Introduction
Collisionless shocks are among the most efficient particle accelerators in space. When viewed in the shock frame, ions are the energy source for heating and acceleration of all species and also shape the shock transition region. It is well known that non-gyrotropic reflected ions are responsible for the foot and overshoot in supercritical quasi-perpendicular shocks (Woods Reference Woods1971; Leroy Reference Leroy1983; Sckopke et al. Reference Sckopke, Paschmann, Bame, Gosling and Russell1983, Reference Sckopke, Paschmann, Brinca, Carlson and Luehr1990; Scudder et al. Reference Scudder, Aggson, Mangeney, Lacombe and Harvey1986; Burgess, Wilkinson & Schwartz Reference Burgess, Wilkinson and Schwartz1989). While it is believed that at sufficiently high Mach numbers quasi-perpendicular shocks become rippled (Newbury, Russell & Gedalin Reference Newbury, Russell and Gedalin1998; Lowe & Burgess Reference Lowe and Burgess2003; Burgess Reference Burgess2006; Moullard et al. Reference Moullard, Burgess, Horbury and Lucek2006; Burgess & Scholer Reference Burgess and Scholer2007; Lobzin et al. Reference Lobzin, Krasnoselskikh, Musatenko and de Wit2008; Yang, Lembège & Lu Reference Yang, Lembège and Lu2012) and non-stationary (Krasnoselskikh et al. Reference Krasnoselskikh, Lembège, Savoini and Lobzin2002; Bale et al. Reference Bale, Balikhin, Horbury, Krasnoselskikh, Kucharek, Möbius, Walker, Balogh, Burgess and Lembège2005; Lobzin et al. Reference Lobzin, Krasnoselskikh, Bosqued, Pinçon, Schwartz and Dunlop2007, Reference Lobzin, Krasnoselskikh, Musatenko and de Wit2008; Lembège et al. Reference Lembège, Savoini, Hellinger and Trávníček2009; Yang, Lembège & Lu Reference Yang, Lembège and Lu2011; Krasnoselskikh et al. Reference Krasnoselskikh, Balikhin, Walker, Schwartz, Sundkvist, Lobzin, Gedalin, Bale, Mozer and Soucek2013), low-Mach-number oblique shocks (Greenstadt et al. Reference Greenstadt, Scarf, Russell, Formisano and Neugebauer1975; Russell et al. Reference Russell, Hoppe, Livesey, Gosling and Bame1982; Mellott & Greenstadt Reference Mellott and Greenstadt1984; Farris, Russell & Thomsen Reference Farris, Russell and Thomsen1993) and at least some high-Mach-number oblique shocks (Scudder et al. Reference Scudder, Aggson, Mangeney, Lacombe and Harvey1986; Gedalin, Newbury & Russell Reference Gedalin, Newbury and Russell1998; Newbury et al. Reference Newbury, Russell and Gedalin1998) possess a well-defined stationary one-dimensional magnetic profile. The main magnetic field increase occurs at the scale of the order of or less than the ion inertial length (Farris et al. Reference Farris, Russell and Thomsen1993; Newbury et al. Reference Newbury, Russell and Gedalin1998; Hobara et al. Reference Hobara, Balikhin, Krasnoselskikh, Gedalin and Yamagishi2010), thus the ion dynamics inside this transition is non-adiabatic (Gedalin Reference Gedalin1997a ).
For a long time, the appearance of the coherent structure, like the foot, the overshoot and the downstream magnetic oscillations, was attributed to ion reflection at the shock front. Thus, the magnetic profiles of subcritical shocks were expected to be monotonic, with only weak time-dependent fluctuations superimposed due to travelling waves (Greenstadt et al. Reference Greenstadt, Scarf, Russell, Formisano and Neugebauer1975; Mellott & Greenstadt Reference Mellott and Greenstadt1984; Farris et al. Reference Farris, Russell and Thomsen1993). Recent observations of the Venusian bow shock (Balikhin et al. Reference Balikhin, Zhang, Gedalin, Ganushkina and Pope2008) and later of interplanetary shocks (Russell et al. Reference Russell, Jian, Blanco-Cano and Luhmann2009; Kajdič et al. Reference Kajdič, Blanco-Cano, Aguilar-Rodriguez, Russell, Jian and Luhmann2012) have shown that downstream magnetic oscillations are present even in very low-Mach-number shocks. Theory (Gedalin Reference Gedalin1997b ; Balikhin et al. Reference Balikhin, Zhang, Gedalin, Ganushkina and Pope2008) and hybrid simulations (Ofman et al. Reference Ofman, Balikhin, Russell and Gedalin2009; Ofman & Gedalin Reference Ofman and Gedalin2013) have shown that it is the directly transmitted gyrating ions that cause the observed large-amplitude downstream magnetic oscillations.
In the normal incident frame, the upstream ion distribution is often approximated as a Maxwellian centred at the upstream flow velocity
 $V_{u}$
. Upon crossing the ramp, the ions begin to gyrate (Sckopke et al.
Reference Sckopke, Paschmann, Bame, Gosling and Russell1983, Reference Sckopke, Paschmann, Brinca, Carlson and Luehr1990; Burgess et al.
Reference Burgess, Wilkinson and Schwartz1989). Even if there are now reflected ions, the transmitted ion distribution gyrates as a whole and is therefore non-gyrotropic (Burgess et al.
Reference Burgess, Wilkinson and Schwartz1989; Ofman et al.
Reference Ofman, Balikhin, Russell and Gedalin2009). The non-gyrotropy should be smoothed out gradually by collisionless gyrophase mixing (Gedalin, Friedman & Balikhin Reference Gedalin, Friedman and Balikhin2015b
). Eventually, this gyration results in collisionless ion heating (Gedalin Reference Gedalin1996, Reference Gedalin1997b
). Observations confirm that the ion distribution just behind the shock is manifestly non-gyrotropic (Sckopke et al.
Reference Sckopke, Paschmann, Bame, Gosling and Russell1983, Reference Sckopke, Paschmann, Brinca, Carlson and Luehr1990; Li et al.
Reference Li, Lewis, LaBelle and Phan1995). There have been theoretical attempts to include phenomenologically reflected ions in the shock jump conditions (Dasgupta et al.
Reference Dasgupta, Burrows, Zank and Webb2006) and to take into account non-gyrotropic ions and the cross-shock potential in Rankine–Hugoniot conditions (Gedalin & Balikhin Reference Gedalin and Balikhin2008). Lack of theoretical knowledge of the shock structure and mathematical difficulties in the determination of the ion distribution features from first principles (equations of motion in the shock front) make these attempts only partly successful, since unknown free parameters (such as fraction and/or temperature of reflected ions) have to be used and no relation to the basic shock parameters can be established. The terrestrial bow shock is typically a high-Mach-number shock (Scudder et al.
Reference Scudder, Aggson, Mangeney, Lacombe and Harvey1986). However, the vast majority of the observed interplanetary shocks are low-Mach-number shocks (Russell et al.
Reference Russell, Jian, Blanco-Cano and Luhmann2009; Neugebauer Reference Neugebauer2013), and knowledge of their structure is important for understanding of the micro-processes at the shock front.
One of the major consequences of the non-gyrotropy is the appearance of magnetic oscillations. Indeed, the distribution of the gyrating ions is approximately spatially periodic. Thus, the ion pressure, both dynamic and kinetic, becomes spatially periodic (Gedalin Reference Gedalin1996). In a one-dimensional stationary shock, the sum of the ion pressure, electron pressure and magnetic pressure should remain constant throughout the shock. The electron contribution is small relative to the ion contribution (see e.g. Schwartz et al. Reference Schwartz, Thomsen, Bame and Stansberry1988). Therefore, the oscillations of the ion pressure must be counterbalanced by the oscillations of the magnetic field in the opposite phase, to ensure the required pressure balance (Gedalin Reference Gedalin1996). Owing to the gyrophase mixing, these oscillations should gradually damp with distance further downstream from the ramp. Although predicted theoretically, this collisionless relaxation of the downstream non-gyrotropic ion distribution was first observed only recently (Balikhin et al. Reference Balikhin, Zhang, Gedalin, Ganushkina and Pope2008; Russell et al. Reference Russell, Jian, Blanco-Cano and Luhmann2009) and reproduced later in simulations (Ofman et al. Reference Ofman, Balikhin, Russell and Gedalin2009; Ofman & Gedalin Reference Ofman and Gedalin2013).
The ability to observe the phenomenon would depend on the shock parameters. Indeed, smaller angles between the shock normal and the upstream magnetic field, and higher upstream ion temperatures, would enhance the gyrophase mixing, thus making the downstream train of oscillations shorter and weaker (Gedalin et al.
Reference Gedalin, Friedman and Balikhin2015b
). Thus, knowledge of the dependence of the effect on the basic shock parameters is necessary for comparison of the theory with observations. Gedalin et al. (Reference Gedalin, Friedman and Balikhin2015b
) proposed analytical expressions for the collisionless relaxation in the weak shock case, treating the shock parameters (Alfvénic Mach number, magnetic compression ratio, upstream ion
 ${\it\beta}$
and shock angle) as independent arguments. In reality, these shock parameters are interrelated. It was shown that the precision of the derived analytical approximations rapidly drops with decrease of the shock angle and increase of
 ${\it\beta}$
. It seems, that, unfortunately, analytical treatment is not possible at present, except in the very weak shock case, and we have to resort to numerical methods. Here we study the dependence of the oscillation amplitude and damping on the shock angle, the magnetic compression and the upstream ion temperature, by performing a test particle analysis in a model shock front. The proposed method (Gedalin, Dröge & Kartavykh Reference Gedalin, Dröge and Kartavykh2015a
) is an improvement of the standard test particle analysis, since the effect of the ion distributions on the magnetic field is calculated and used to iteratively adjust the shock parameters so that the affected and the original asymptotic fields are consistent.
It is widely believed that quasi-parallel shocks differ substantially from quasi-perpendicular ones in that the former do not have a well-defined structure of the transition layer and are significantly non-stationary. Observations at the Earth bow shock brought about the paradigm of the ‘patchwork’ shock, formed by converging magnetic pulsations convected with the upstream plasma flow (Thomsen et al.
Reference Thomsen, Gosling, Bame and Russell1990; Schwartz & Burgess Reference Schwartz and Burgess1991; Burgess et al.
Reference Burgess, Lucek, Scholer, Bale, Balikhin, Balogh, Horbury, Krasnoselskikh, Kucharek and Lembège2005; Burgess & Scholer Reference Burgess and Scholer2013). While initially proposed for a limited number of rather high-Mach-number shocks, this paradigm is often implicitly applied to most quasi-parallel shocks, including low-Mach-number ones. Indeed, if the magnetic pulsations originate well upstream of the shock front, the shock Mach number is irrelevant. Two-dimensional hybrid simulations and full-particle simulations of supercritical quasi-parallel shocks (Scholer Reference Scholer1993; Scholer, Fujimoto & Kucharek Reference Scholer, Fujimoto and Kucharek1993; Scholer, Kucharek & Shinohara Reference Scholer, Kucharek and Shinohara2003) support the conclusion that magnetic pulsations, generated upstream, strongly affect the shock front, making it time-dependent and reforming. Simulations of low-Mach-number quasi-parallel shocks, however, showed a stable shock front with adjacent upstream wave trains (Scholer & Fujimoto Reference Scholer and Fujimoto1993). Most of the quasi-parallel shocks observed in the heliosphere are low-Mach-number interplanetary shocks, and the internal structure of these shocks has important implications for acceleration and transport of high-energy ions. At the Earth’s bow shock, reflected ions produced at the quasi-perpendicular part of the shock may propagate to the foreshock of the quasi-parallel part and thus affect the structure of the shock, thereby exciting waves, which further form a patchwork. This process may be suppressed in interplanetary shocks. A study of a quasi-parallel interplanetary shock has shown a clear shock transition (Kennel et al.
Reference Kennel, Edmiston, Russell, Scarf, Coroniti, Smith, Tsurutani, Scudder, Feldman and Anderson1984). Other previous observations of interplanetary quasi-parallel shocks (Mandt, Kan & Russell Reference Mandt, Kan and Russell1986) and of weak shocks on the flank of the terrestrial bow shock (Greenstadt et al.
Reference Greenstadt, Coroniti, Moses, Tsurutani, Omidi, Quest and Krauss-Varban1991) have shown the variety of the shock profiles and dependence on the upstream
 ${\it\beta}$
. In the low-Mach-number range, quasi-parallel shocks may have structures similar to those of quasi-perpendicular shocks, even for
 ${\it\theta}$
well below
 $45^{\circ }$
. The effects can be expected to be strongly dependent on
 ${\it\beta}$
. Thus, analysis of the collisionless relaxation in the marginally quasi-parallel regime would provide us with predictions that could be directly compared with observations to understand the relative role of collisionless dynamics in the macroscopic fields and the influence of time-dependent fields, in this range of parameters.
2. Numerical analysis
In order to study the behaviour of the ion pressure as a function of the shock parameters, we trace numerically an initially Maxwellian ion distribution across a model shock front and derive the moments of the developing ion distribution. The model shock profile is given by the following expressions:
 $$\begin{eqnarray}\displaystyle & \displaystyle b_{z}(x)=\frac{B_{z}}{B_{u}}=\sin {\it\theta}\left[\frac{R+1}{2}+\frac{R-1}{2}\tanh \frac{3x}{D}\right], & \displaystyle\end{eqnarray}$$
 $$\begin{eqnarray}\displaystyle & \displaystyle b_{x}=\frac{B_{x}}{B_{u}}=\cos {\it\theta}, & \displaystyle\end{eqnarray}$$
 $$\begin{eqnarray}\displaystyle & \displaystyle b_{y}=\frac{B_{y}}{B_{u}}=b_{m}\left(\frac{\cos {\it\theta}}{\mathit{Ma}}\right)\left(\frac{c}{{\it\omega}_{pi}}\right)\frac{\text{d}b_{z}}{\text{d}x}, & \displaystyle\end{eqnarray}$$
 $$\begin{eqnarray}\displaystyle & \displaystyle {\it\phi}(x)=\frac{e{\it\varphi}(x)}{m_{i}V_{u}^{2}/2}=s\frac{b_{z}(x)-\sin {\it\theta}}{(R-1)\sin {\it\theta}}, & \displaystyle\end{eqnarray}$$
 $B_{u}$
is the upstream magnetic field magnitude. The relation between
 $b_{y}$
and
 $b_{z}$
follows the expression derived by Gedalin (Reference Gedalin1998). In what follows we vary the ratio
 $R=B_{zd}/B_{zu}=B_{zd}/(B_{u}\sin {\it\theta})$
, the upstream
 ${\it\beta}_{i}=8{\rm\pi}nT_{i}/B_{u}^{2}=0.1$
and the angle between the shock normal and the upstream magnetic field
 ${\it\theta}$
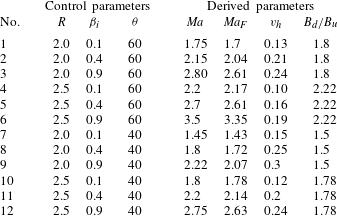
. These control parameters are listed in the first columns of table 1. The normalized cross-shock potential is
 $s=2e{\it\varphi}(x)/m_{i}V_{u}^{2}=0.5$
in all these runs. We have also used
 $s=0.6$
and
 $s=0.4$
but the differences were barely noticeable and did not warrant presentation here. The ramp half-width
 $D$
was taken equal to one ion inertial length, while the non-coplanar magnetic profile parameter was chosen as
 $b_{m}=0.5$
. The Alfvénic Mach number is a free parameter, which is derived numerically to achieve consistency, as described below.
The control (
 $R$
,
 ${\it\beta}_{i}$
,
 ${\it\theta}$
) and derived (
 $\mathit{Ma}$
,
 $\mathit{Ma}_{F}$
,
 $v_{h}$
,
 $B_{d}/B_{u}$
) parameters for the presented runs.

An ion, taken from the initial Maxwellian distribution of 40 000 ions, starts moving at
 $x=-3(V_{u}/{\it\Omega}_{u})m$
where
 $V_{u}$
is the upstream plasma velocity and
 ${\it\Omega}_{u}=eB_{u}/m_{i}c$
is the upstream ion gyrofrequency. The ion motion is governed by the equations
 $$\begin{eqnarray}m\dot{\boldsymbol{v}}=e\left(\boldsymbol{E}(x)+\frac{\boldsymbol{v}}{c}\times \boldsymbol{B}(x)\right),\quad \dot{\boldsymbol{r}}=\boldsymbol{v}.\end{eqnarray}$$
The distribution at a given coordinate
 $x$
is built using the staying time method. Namely, each ion is caught in the thin slice
 $(x-{\it\delta}x,x+{\it\delta}x)$
as many times as it appears there. Each time the ion is caught, it contributes to the phase space the three components of its velocities and the weight proportional to the initial component of the ion velocity along the shock normal,
 $|v_{0x}|$
. Since the fields are time-stationary and depend only on the coordinate along the shock normal, this is equivalent to the Liouville mapping (see proof in Gedalin & Dröge (Reference Gedalin and Dröge2013)). With a sufficiently small time step, a good coverage of the relevant phase space is achieved. Performing this procedure for a large number of slices (2500 in these runs), one obtains numerically the distribution function
 $f(\boldsymbol{v},x)$
throughout the shock. The calculated distribution function allows one to calculate also the density
 $n(x)$
, the hydrodynamic velocity
 $\boldsymbol{V}(x)$
and the total pressure tensor
 $\unicode[STIX]{x1D617}_{ij}(x)$
as the moments of the distribution function:
 $$\begin{eqnarray}\displaystyle & \displaystyle n(x)=\int f(\boldsymbol{v},x)\,\text{d}^{3}\boldsymbol{v}, & \displaystyle\end{eqnarray}$$
 $$\begin{eqnarray}\displaystyle & \displaystyle n(x)\boldsymbol{V}(x)=\int \boldsymbol{v}f(\boldsymbol{v},x)\,\text{d}^{3}\boldsymbol{v}, & \displaystyle\end{eqnarray}$$
 $$\begin{eqnarray}\displaystyle & \displaystyle \unicode[STIX]{x1D617}_{ij}(x)=m_{i}\int v_{i}v_{j}f(\boldsymbol{v},x)\,\text{d}\boldsymbol{v}. & \displaystyle\end{eqnarray}$$
 $$\begin{eqnarray}n\rightarrow \frac{n}{n_{u}},\quad B\rightarrow \frac{B}{B_{u}},\quad \unicode[STIX]{x1D617}_{ij}\rightarrow \frac{\unicode[STIX]{x1D631}_{ij}}{n_{u}m_{i}V_{u}^{2}}.\end{eqnarray}$$
The pressure tensor is of particular interest for our purposes, since in a stationary one-dimensional shock the following pressure balance must be maintained throughout:
 $$\begin{eqnarray}\unicode[STIX]{x1D617}_{xx}+p_{e}+\frac{B^{2}}{8{\rm\pi}}=\text{const}.\end{eqnarray}$$
The validity of the pressure balance in laminar shocks has been tested against observations (Zilbersher et al.
Reference Zilbersher, Gedalin, Newbury and Russell1998). In the present analysis, we apply the method proposed by Gedalin et al. (Reference Gedalin, Dröge and Kartavykh2015a
), as follows. We choose a set of the shock parameters, trace the trajectories and calculate
 $\unicode[STIX]{x1D617}_{xx}$
. Equation (2.10) was used to calculate the magnetic field that would be consistent with the numerically found ion distributions. The derived magnetic field magnitude was compared to the assumed model profile. The Alfvénic Mach number was varied until the upstream and downstream asymptotic magnetic fields were equal to the asymptotic magnetic field magnitudes prescribed by the adopted model profile. This procedure requires also knowledge of the electron pressure. Electron kinetics cannot be studied within the same test particle analysis. Electrons are sensitive to inhomogeneous electric fields at the scales of the electron inertial lengths (Bale et al.
Reference Bale, Hull, Larson, Lin, Muschietti, Kellogg, Goetz and Monson2002; Hull et al.
Reference Hull, Larson, Wilber, Scudder, Mozer, Russell and Bale2006; Bale & Mozer Reference Bale and Mozer2007; Schwartz et al.
Reference Schwartz, Henley, Mitchell and Krasnoselskikh2011; Dimmock et al.
Reference Dimmock, Balikhin, Krasnoselskikh, Walker, Bale and Hobara2012) that are observed in the shocks. They should also be affected by small-scale fast-changing time-dependent fields, which are not included in the present model and do not affect ion motion. There is still no good knowledge of the details of electron heating in the shock front although the overall energy is found to be determined by the cross-shock potential (Schwartz et al.
Reference Schwartz, Thomsen, Bame and Stansberry1988). It is widely accepted to use, in theory and hybrid simulations, the polytropic approximation
 $p_{e}\propto n^{5/3}$
. Fortunately, the electron pressure contribution is small in laminar (low-Mach-number and low-
 ${\it\beta}$
) shocks, so that uncertainty in their pressure does not introduce any noticeable error. Here
 ${\it\beta}_{e}={\it\beta}_{i}$
was assumed throughout also. Once the appropriate Mach number
 $\mathit{Ma}=V_{u}/v_{A}$
is found, we calculate also the fast Mach number
 $\mathit{Ma}_{F}=V_{u}/v_{F}$
and the ratio of the upstream thermal ion velocity to the upstream plasma velocity,
 $v_{h}=\sqrt{{\it\beta}_{i}/2\mathit{Ma }^{2}}$
. The last derived parameter column in the table shows the total magnetic compression
 $B_{d}/B_{u}$
. In the described calculation of the ion pressure, it is assumed that the contribution of the back-streaming ions is negligible. Although, in principle, some ions can be reflected and escape upstream as a beam (Burgess Reference Burgess1987; Gedalin, Liverts & Balikhin Reference Gedalin, Liverts and Balikhin2008), no such particles were found for the conditions used in this paper.
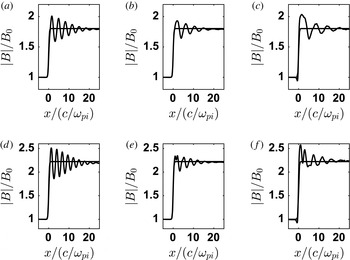
Results for
 ${\it\beta}_{i}=0.1$
(a,d), 0.4 (b,e), 0.9 (c,f);
 $R=2$
(a–c), 2.5 (d–f). Other parameter:
 ${\it\theta}=60^{\circ }$
. In each panel the monotonic curve is the magnitude of the initial magnetic field profile used for ion tracing. The oscillating curve is the magnetic field magnitude derived from the pressure balance condition (2.10) with the numerically found ion pressure.

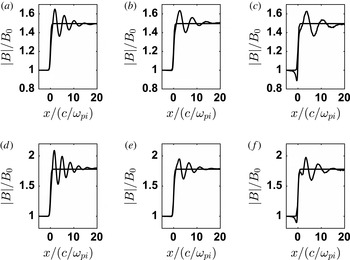
The results of adjusting the derived and assumed profiles are shown in figure 1 for
 ${\it\theta}=60^{\circ }$
and in figure 2 for
 ${\it\theta}=40^{\circ }$
. Reliability of the numerical modelling can be estimated using the deviation of the derived magnetic field from the assumed one, measured as
 $|B_{max}/B_{d}-1|$
, where
 $B_{d}$
is the asymptotic downstream magnetic field and
 $B_{max}$
is the maximum magnitude of the derived magnetic field. This deviation is largest in figure 2(d), where it is about 17 %. Given the uncertainty in our knowledge of some of the shock parameters, like the shock width and cross-shock potential, the largest deviation of about 15 % of the derived magnetic field from the model should be considered quite satisfactory. The magnetic oscillations of these relative amplitudes would not significantly affect the ion motion and would not noticeably alter the distributions obtained by ion tracing in the chosen model field.
Results for
 ${\it\beta}_{i}=0.1$
(a,d), 0.4 (b,e), 0.9 (c,f);
 $R=2$
(a–c), 2.5 (d–f). Other parameter:
 ${\it\theta}=40^{\circ }$
. In each panel the monotonic curve is the magnitude of the initial magnetic field profile used for ion tracing. The oscillating curve is the magnetic field magnitude derived from the pressure balance condition (2.10) with the numerically found ion pressure.

It is clearly seen from the figures that the magnetic oscillations damp with distance faster, that is, exhibit less clear periods, with the increase of
 ${\it\beta}_{i}$
and/or decrease of
 ${\it\theta}$
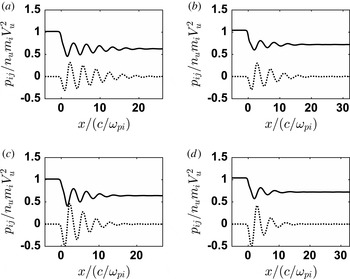
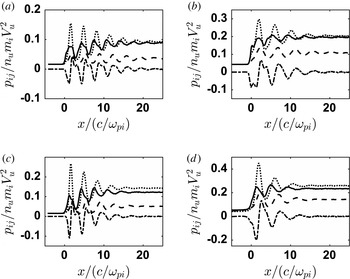
. This effect is presented even better in figure 3 showing the spatial behaviour of the total ion pressure
 $\unicode[STIX]{x1D617}_{ij}(x)$
. The pressure components are normalized with the upstream dynamic pressure
 $n_{u}m_{i}V_{u}^{2}$
. The oscillations of the pressure damp faster for larger
 ${\it\beta}_{i}$
and smaller
 ${\it\theta}$
. If the initial distribution were cold,
 ${\it\beta}_{i}=0$
, upon crossing the shock, all ions would drift along
 $x$
with the same velocity and gyrate with the same gyroradius. In this case there would be no gyrophase mixing and the downstream pressure would be spatially periodic, with no damping at all. The dispersion of the initial velocities leads to different gyroradii for different ions and, more importantly, to different drift velocities along
 $x$
for different ions. The spread of the drift velocities is of the order of
 ${\it\delta}v\sim v_{T}\cos {\it\theta}_{d}=v_{T}B_{x}/B_{d}$
, where
 ${\it\theta}_{d}$
is the angle between the shock normal and the downstream magnetic field. The drift velocity itself is
 $V_{d}\approx V_{u}B_{u}/B_{d}$
. At the distance
 $L$
, the dispersion of the positions of the gyrocentres is
 $L{\it\delta}v/V_{d}$
. Gyrophases mix when
 $L{\it\delta}v/V_{d}\sim r_{g}$
, where
 $r_{g}$
is the mean gyroradius. Combining these estimates, one finds the damping distance as
 $L\sim r_{g}(V_{u}/v_{T}\cos {\it\theta})$
. The ratio
 $L/2r_{g}$
gives a rough estimate of the number of oscillations as
 ${\sim}\!1/(v_{h}\cos {\it\theta})$
.
Total pressure tensor components
 $\unicode[STIX]{x1D617}_{xx}$
(solid line) and
 $\unicode[STIX]{x1D617}_{xy}$
(dotted line) for: (a,b)
 ${\it\theta}=60^{\circ }$
, (c,d)
 ${\it\theta}=40^{\circ }$
; and (a,c)
 ${\it\beta}_{i}=0.1$
, (b,d)
 ${\it\beta}_{i}=0.4$
. In both cases
 $B_{d}/B_{u}\approx 1.8$
.

Kinetic pressure tensor components
 $\unicode[STIX]{x1D631}_{xx}$
(solid line),
 $\unicode[STIX]{x1D631}_{yy}$
(dotted line),
 $\unicode[STIX]{x1D631}_{zz}$
(dashed line) and
 $\unicode[STIX]{x1D631}_{xy}$
(dash-dotted line) for: (a,b)
 ${\it\theta}=60^{\circ }$
, (c,d)
 ${\it\theta}=40^{\circ }$
; and (a,c)
 ${\it\beta}_{i}=0.1$
, (b,d)
 ${\it\beta}_{i}=0.4$
. In both cases
 $B_{d}/B_{u}\approx 1.8$
.

The total pressure oscillates due to the gyration of the ion distribution as a whole and due to the intrinsic non-gyrotropy of the ion distribution relative to its centre. The latter is described by the kinetic pressure
 $\unicode[STIX]{x1D631}_{ij}=\unicode[STIX]{x1D617}_{ij}-nm_{i}V_{i}V_{j}$
. Figure 4 visualizes the dependence on the distance of the diagonal components
 $\unicode[STIX]{x1D631}_{xx}$
,
 $\unicode[STIX]{x1D631}_{yy}$
and
 $\unicode[STIX]{x1D631}_{zz}$
, and the off-diagonal component
 $\unicode[STIX]{x1D631}_{xy}$
. The diagonal components are closely related to the ion heating
 $T_{i}=\unicode[STIX]{x1D631}_{ii}/n$
. Just behind the ramp the heating in the non-coplanarity direction is the strongest. The collisionless relaxation results in the isotropization of the temperature in the plane perpendicular to the magnetic field (approximately
 $x{-}y$
plane), while the heating in the direction parallel to the magnetic field,
 $z$
, remains much weaker. The off-diagonal component
 $\unicode[STIX]{x1D631}_{xy}$
drops to zero asymptotically, due to the gyrotropization of the distribution. The rate of gyrotropization depends strongly on the ratio of the upstream ion thermal velocity to the upstream plasma velocity,
 $v_{h}$
, which describes the relative dispersion of the initial distribution. This is seen most clearly in the behaviour of
 $\unicode[STIX]{x1D631}_{xy}$
in figure 3, where the two left panels are for
 $v_{h}\approx 0.1$
and the two right panels are for
 $v_{h}\approx 0.2$
. For lower
 $v_{h}$
the curve for
 $\unicode[STIX]{x1D631}_{xy}$
has five or six clearly identifiable minima, while for higher
 $v_{h}$
the number of them drops.
3. Conclusions and discussion
We have studied the dependence of the collisionless relaxation of the non-gyrotropic downstream ion distribution on the magnetic compression ratio
 $R$
, the angle between the shock normal
 ${\it\theta}$
and the upstream magnetic field, and the upstream ion
 ${\it\beta}_{i}$
. The shock Mach number was not a free parameter but was calculated to adjust the derived and model magnetic fields and thus achieve more consistency of the analysis. The relaxation occurs due to gyrophase mixing because of the difference in the drift and gyration speeds of different ions. The larger the spread in these two, the faster the pressure oscillations damp. Thus, qualitatively it is clear that the damping should be faster for higher
 ${\it\beta}_{i}$
and smaller
 ${\it\theta}$
. At larger
 $R$
the ratio of the gyration velocity to the drift velocity is larger, and one can expect a longer oscillation train. Yet, there is no way at present to estimate the spatial damping rate analytically. The presented numerical calculations provide the first quantitative evaluations of the relaxation lengths, which may be further compared with observations. We find that the best representation of the relaxation is given by the comparison of the magnetic profile, which is consistent with the ion dynamics, with the initial model profile. Coherent magnetic oscillations at the downstream part of a low-Mach-number shock profile are caused by the non-gyrotropy of the downstream distribution of transmitted ions. Since the ion pressure oscillations damp with the distance from the shock transition, the magnetic oscillations damp correspondingly. We have shown here that the spatial rate of this damping is higher for larger upstream ion temperatures (higher
 ${\it\beta}_{i}$
) and stronger obliquity (smaller
 ${\it\theta}$
) of the shock.
Figures 1 and 2 present a gallery to be used for quantitative comparison with observations. The deviations of the calculated magnetic profile from the assumed one are rather small for
 ${\it\beta}_{i}=0.1$
and
 ${\it\beta}_{i}=0.4$
, so that one can expect that the ion motion is not significantly affected by these deviations. The damping is not exponential and the oscillations may persist well downstream, if the conditions are favourable, that is, the ions are initially sufficiently cold and
 ${\it\theta}$
is large. It would be more difficult to observe such collisionless relaxation in oblique shocks in a hot plasma, yet a kind of small first oscillation, usually referred to as an overshoot, may be expected in many subcritical shocks. We focused on the implications of the collisionless relaxation for the magnetic profile of the shock, since the magnetic field measurements do provide necessary resolution for comparison of the oscillation pattern. Direct comparison of the ion distributions is more difficult since at present even in the best cases the available particle measurements do not allow one to reliably resolve variations of the distribution on the scale of the magnetic oscillation.
In the above numerical analysis we referred mostly to the runs with
 ${\it\beta}_{i}=0.1$
and
 ${\it\beta}_{i}=0.4$
, while runs with
 ${\it\beta}_{i}=0.9$
were presented mainly for illustration of the distortion of the magnetic field in the case when
 $v_{T}/V_{u}$
becomes sufficiently large that the number of reflected ions is not negligible. It is seen that in these cases the deviations of the calculated magnetic profile from the model one is no longer weak and may affect the ion motion. The method of adjustment of the shock parameters is less reliable here and should be considered as a lowest-order approximation. A more appropriate approach would be to use the whole magnetic profile, obtained within this approximation, as a new profile for tracing the ions and calculation the pressure tensor. This is beyond the scope of the present paper.
Acknowledgement
This study was partly supported by the Israel Science Foundation (grant no. 368/14).