INTRODUCTION
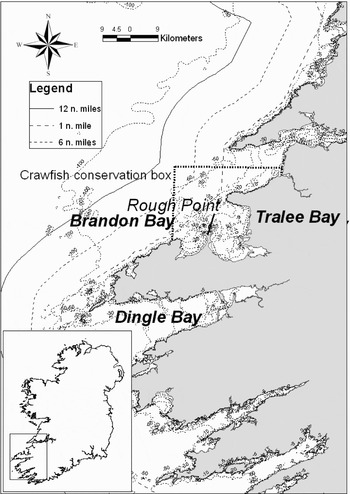
A directed spider crab fishery, the only one in Ireland up to the present time, commenced in Tralee and Brandon Bays (the Magharees fishery), County Kerry in south-west Ireland in 1981 since when, in some years, it has yielded all of the recorded national catch. Spider crab is the dominant decapod species in the two bays whose area is ~495 km2, most of which is ≤20 m in depth (Figure 1). From the 50 m isobath seawards brown crab (Cancer pagurus) assumes dominance (Gavin Power, personal communication).
Map of south-west Ireland showing the location of the Magharees fishery: Brandon and Tralee Bays are subdivided by Rough Point. The Legend keys the sub-divisions of the territorial sea.

The spider crab in the Magharees fishery, the largest spider crab in British and Irish waters, has hitherto been referred to as Maja squinado Herbst (Fox, undated; Bates, Reference Bates1981; Fahy, Reference Fahy2001). Balss (Reference Balss and Michaelsen1922) examined material from the Mediterranean and the Canary Islands and established the variety M. squinado var. brachydactyla. Neumann (Reference Neumann1998) in a review of material from the eastern Atlantic and Mediterranean referred to M. brachydacyla as a separate species. A recent review of the systematics of the crustaceans is provided by Martin & Davis (Reference Martin and Davis2001). Neumann considered all of the material originating in the eastern Atlantic from Morocco, Mauritania and the Canary Islands in the south, northwards through the waters of Spain and Portugal, France, Ireland, Great Britain and the Netherlands to be M. brachydactyla. Neumann recognized there was considerable morphological variability in this species but he identified a number of key characteristics in the adult. Among them, the rostrum is more divergent than in M. squinado and the dorsal median spine row is only slightly more prominent than the remaining carapace spinulation. Maja brachydactela Balss is considered to be the only large Majid species in the Magharees fishery.
Maja brachydactyla adults and post-pubertals migrate to deep water in the autumn in association with gonad maturation and the development of seminal receptacles in the females. They return to shallow inshore water in spring to incubate eggs and release larvae. The reproductive period is from March to November in Galicia where there are three broods annually in primaparous females (González-Gurriarán et al., Reference González-Gurriarán, Fernández, Freire and Muiño1998). Moving northwards, the number of broods decreases: there are 2 in France (Kergariou, Reference Kergariou1984) and 1–2 in the English Channel (Pawson, Reference Pawson1995) but only one in the Magharees fishery (Fahy, Reference Fahy2001). Kergariou (Reference Kergariou1984) estimated egg development to require 60–75 days and larval life approximately 3 weeks. There are 2 zoea stages (Kelly et al., Reference Kelly, Nee, O'Donovan and Tully2003). Information on early development comes from Galicia (González-Gurriarán et al., Reference González-Gurriarán, Fernández, Freire, Muiño and Parapar1993; González-Gurriarán & Freire, Reference González-Gurriarán and Freire1994a). Post-larval settlement takes place from late spring to autumn, probably in three pulses, in depths of <5–10 m in rocky areas. As the animals grow they move into deeper areas with sandy substratum. Lengths of 65–105 mm, carapace length (CL; this is the standard measurement of size used throughout this work) are attained at 12–18 months, depending on settlement date. During their last year of growth juveniles have 1–3 moults with a size increase of 10–20% at each. There is a terminal anecdysis and the investigations described here were conducted on the adult. The final moult of the female is clearly identifiable because the abdomen becomes domed to accommodate the eggs. Males have a pre-pubertal moult which is labelled adolescent.
Fishing in Magharees commenced in 1981 when 25 fishers each operating approximately 150 pots landed 30 t of spider crab. Small quantities of spider crab were probably caught, but not necessarily landed, throughout Irish waters at the time. Bates (Reference Bates1981) described it as a common inhabitant of southern and western Irish inshore whose ‘rusty colour and prickly shell are a familiar sight to both trawler and lobstermen, in the area from Galway in the west to Wexford in the south-east.’ Spider crab was generally regarded as a pest by fishermen of all kinds and Bates, a resource development officer with An Bord Iascaigh Mhara (BIM, the Irish Sea Fisheries Development Board) saw the possibility of developing a fishery for it. Buyers from Spain who traditionally imported excess production from France had, in the previous five years, commenced making purchases from ports in the south of England. Spider crab display considerable variability in condition, particularly in the individual size landed and Magharees had more than sufficient quantities to yield a fraction of acceptable market quality.
In 1987 Magharees fishers produced 300 t and the annual yield declined until in 1999 there was a recovery and 336 t were recorded. At that time 20 fishers were each using an average of 470 pots and serious changes were perceived to have occurred in the stock. Elucidating the problem, fishers remarked on the greater reduction in numbers of large male spider crabs which are particularly valued for their white meat. A census of catch in 2000 compared with similar data gathered in 1985 confirmed that the size composition of males had altered dramatically in the meantime whereas that of females was unchanged (Fahy, Reference Fahy2001). Subsequent investigations which included a mark–recapture experiment and attempts to age the animals were undertaken to clarify what had occurred.
FISHING ACTIVITY IN THE MAGHAREES
Castlegregory, the principal village in the Magharees vicinity, is approximately 25 km west of Tralee, County Kerry. The area is rural and picturesque, heavily dependent on tourism with agriculture and fishing as secondary indigenous occupations.
Brandon Bay has a trawl fishery and there is an important oyster dredge fishery in Tralee Bay but otherwise passive fishing gears are the norm in the Magharees inshore. Brown crab and lobster (Homarus gammarus (L.)) are targeted with pots and effort is increasingly being directed onto velvet crab (Liocarcinus spp) (Fahy et al., Reference Fahy, Carroll, Smith, Murphy and Clarke2008). Crawfish (Palinurus elephas (Fab.)) is very valuable attaining up to €60/kg at first sale (2006). National landings of 300 t of crawfish were recorded in 1971 but they declined as a result of the widespread use of tangle nets to 34 t in 2006. In 2002 a crawfish conservation area was established (SI (Statutory Instrument) No. 179 of 2002: Crawfish [Fisheries Management and Conservation] Order, 2002) prohibiting the use of nets to catch crawfish within the Magharees fishery. The regulation was renewed as SI No. 233 of 2006. The SI did not however prohibit the use of nets for other species. In addition, enforcement of inshore fishery regulations in the Republic of Ireland is poor and tangle nets are set in Magharees all the year round. A prosecution has never been taken for an offence under these SIs, yet the majority of crawfish landed in Magharees are taken by this method. Between 2003 and 2006 inclusive 11% of the national landings of crawfish were recorded on the coastline of Magharees (Source: Government Department responsible for fisheries).
Angling is an important source of revenue to the area and numbers of some fish species such as the undulate ray (Raja undulate Lacèpede) and angel shark (Squatina squatina (L.)) which have traditionally been fished with rod and line (increasingly on a catch–release basis) only in these bays in south-west Ireland have been depleted, almost to elimination by the use of tangle nets (declining catches are indicated by the landings reported in Anon (1955–2007)). There are also consequences for the spider crab fishery from the use of these nets but in the circumstances it is difficult to obtain data on their by-catches.
Technology creep has greatly increased the effectiveness of all inshore fisheries methods in the region. A drift net fishery for salmon which operated in the months of June and July was closed in 2006. Depletion of various wild fin and shellfish stocks has diverted fishing effort onto spider crab.
Since 1981 spider crab has attracted significant fishing effort. The fishing community in Magharees lobbied successfully for the introduction of a minimum size limit (spider crab [Conservation of stocks] order. SI No. 321 of 2001) which is larger than specified in EU law (Council regulation [EC] No. 850/98) to ensure a good standard of product to attract buyers. There has never been a prosecution for non-compliance with the larger minimum size limit which is not observed at times of high demand for product.
MATERIALS AND METHODS
Investigations commenced in April 2000 with a census of pot-caught spider crab. The exercise was repeated in May, June and August of that year. Similar work was undertaken from 2003 to 2007, not necessarily in the same months but the fishery is seasonal and all observations were made in the months of March to August inclusive. The intention on every occasion was to sample the catch in Brandon and Tralee Bays but Brandon is more exposed to the open Atlantic and was more rarely accessible.
On each occasion when it was feasible the entire catch from three trains of pots (30 pots per train) from each bay was examined on shore. Each animal was sexed, the CL measured (nearest mm below) and the height of the right cheliped (HRC) in 21% of all randomly chosen males was measured using a Vernier caliper. Individual weights were recorded in 2000 only and a LnWeight:LnLength relationship obtained in June of that year was used to raise catches in all later work.
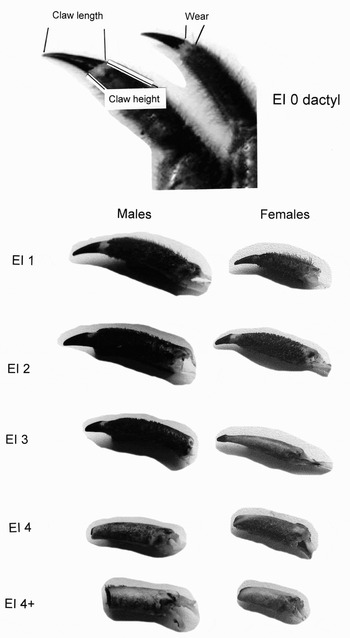
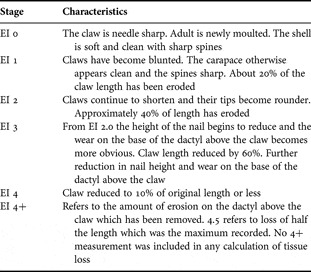
In 2004 observations were made on the degree of erosion of the claw on the dactyl of the second walking leg on the right (pereiopod 3 on the right (P3right)) which was recorded along with the other details of each censused individual thereafter. Kergariou (Reference Kergariou1976) recorded loss of pereiopods from spider crab captured in gill nets and pots (he did not distinguish gears in his results) and reported that P5 was most often missing, P3 and P4 least. An erosion index (EI) was devised on a 5 point scale and values were attributed in decimal subdivisions of it. The characteristics of the EI stages are described in Table 1 and the principal stages are shown in Figure 2. A total of 423 (218 males and 195 females) dactyl + propodus from the animals to which an EI value had been attributed were brought back to the laboratory for more detailed examination and measurement. These samples were distributed over the period 2004–2007. The erosion process was quantitatively described from measurements carried out on dactyls to which an EI had already been attributed.
Stages of claw erosion. EI 0 is labelled to show the three main features on which observations were made: claw length, claw height and the amount of wear above the claw on the dactyl. EI stages 1–4+ are shown separately for males and females.

Characteristics of erosion index (E1).

In 2005 a mark–recapture programme was initiated. Efforts were made to identify and tag adult rather than adolescent males. Otherwise crabs of both sexes were tagged at random, provided they had a full complement of pereiopods and that erosion was similar on all of the walking legs. Recaptured animals were also checked to ensure that the dactyls displayed similar erosion in an effort to exclude broken claws from consideration. CL and EI were recorded as was the sex of an individual and the point of release noted using GPS.
Plastic electrical cable ties were used to mark the crabs. Each was numbered with a four digit code and drawn tight on the carpus of the right cheliped.
Spider crabs in Mahgarees were tagged on seven occasions between August 2005 and June 2007 inclusive. On each occasion between 150 and 295 animals were marked. The point of release of a tagged animal was recorded as the point at which it entered the water although contact with the substratum may have been made some distance away. The bearing of movement was calculated as the direction between release and recapture (the intervention of land across the trajectory was disregarded).
Because the fishery is of small extent and intensively fished the strategy from the outset was to release small numbers of tagged animals over a protracted period in order to record any alterations in migration pattern throughout the year. It was expected that released animals would be rapidly recaptured. The organizers approached individual fishers distributing documentation and making them aware of the programme. The tag report form, which was also an application for a reward of €5 requested the fisher's contact details, the date and latitude/longitude details of where the capture occurred. Additionally the total number of tagged recaptures on the day, the number of pots hauled and the quantity of total catch were requested. The fisher was also asked to retain the carcass for examination.
Tally books used to record the purchase of spider crab by vivier operators (the crabs were bought individually) and other ephemeral documents were consulted to interpret the development and conduct of the fishery. Statistical and mapping packages in SPSS 15.0, Microsoft Office Excel 2003 and ArcMap 9.3 were used.
RESULTS
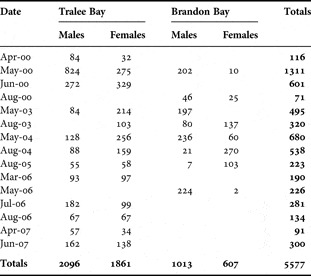
A total of 5577 spider crabs were examined in the course of census work; Table 3 shows their temporal and spatial distribution. Tralee Bay was sampled more frequently; the overall sex ratio (F:M) there was 0.90 although females only were represented in the catches on one occasion. In Brandon Bay, in contrast, males dominated the catches and the overall sex ratio there was 0.60.
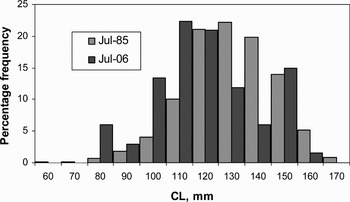
All of the size distributions were prepared separately for males and females on each sampling date; Figure 3 compares the male size–frequencies described by Fox (undated) in 1985 with a similar census undertaken in July 2006. Only in 1985 did the size–frequency display bimodality and the histogram form in 2006 prevailed thereafter. Although heavier harvestable weight percentages were recorded in other months, Fox's results were not replicated in summer.
Percentage length–frequency distributions of male spider crab in the Magharees fishery in July 1985 and July 2006.

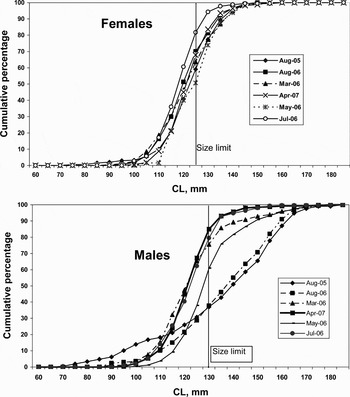
Cumulative size–frequencies of female and male spider crabs in Magharees in six samples are set out in Figure 4. Cumulative size–frequencies of females conformed to a similar pattern throughout the year. In males, on the contrary, the size–frequencies in August, at time of moult, contained the highest proportion of large animals. These were quickly removed from the population which showed signs of their loss the following spring. When spider crabs moult in August the adults are not in condition to be harvested.
Cumulative length–frequencies of female and male spider crab in six samples from Magharees.

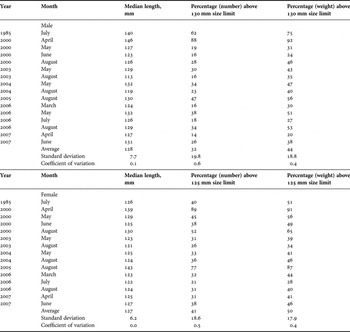
Table 2 summarizes all data collected between April 2000 and June 2007. The median size of crab by sex in each sample is set out together with the percentage number of the catch above the national size limit. The percentage weight of catch exceeding the national size limit was calculated using the LnWeight:LnLength values obtained for spider crab in Fahy (Reference Fahy2001) (for females, Wt (g) = −8.6575Lt (mm)3.1227; for males, Wt (g) = −5.373Lt (mm)3.0871). The percentage harvestable weight is an indicator only because in August the majority of adult crabs are in poor condition.
Material examined during the spider crab census and tagging programme in Magharees.

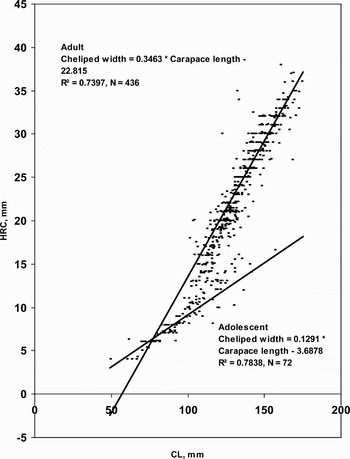
Adult females are readily recognized because the abdomen is dome shaped to accommodate eggs. Males have an adolescent phase which could be confused with the terminal moult. The adolescent cheliped is however proportionally smaller. To clarify matters in Magharees, measurements were made of height of the right cheliped (HRC) in the male in the course of censusing catches. A total of 650 cheliped heights were measured. Regressions were calculated of HRC on CL for non-overlapping data (for male spider crab with a HRC of >17.5 mm and for individuals whose HRC was <11 mm). The two regressions are superimposed on Figure 5. For practical purposes, above 115 mm and certainly above 120 mm CL, distinguishing the two moults should not be a problem. In fact, adolescent males were relatively rare (~14% of all males) in the catches in Magharees. Le Foll et al. (Reference Le Foll, Latrouite and Noël1993) applied Somerton's (Reference Somerton1980) method to transform CL and HRC to distinguish the adolescent from the adult male which was not practical in a working context. Instead, care was taken to reject small males having smaller than expected chelipeds.
Height of the right cheliped (HRC) regressed on carapace length (CL) of male spider crab.

The tagging progamme was poorly supported by the fishing community. Only six crews (among approximately 20) reported recaptures and 91% of all recaptures came from two vessels. The reward of €5 was approximately five times the first sale price per kg in 2006 (Source: Government Department responsible for Fisheries). Nor could form filling have been a disincentive because fishers who provided minimal data were rewarded. Plentiful returns had been expected because of the high density of fishing effort in the two bays (~7920 pots were fished during the mark–recapture experiment). Initially the tags used were 2.5 × 0.6 mm in cross-section and 160 mm long. The trailing end was cut back so that the tag formed a tight bracelet in order not to inhibit movement of the cheliped. In this fishery a large proportion of catch is below the size acceptable to the market and is immediately discarded. In the course of fishing operations tags are easily overlooked. When initial returns from fishers were poorer than anticipated a larger and more obvious tag was substituted. Its dimensions were 3.6 × 1.1 mm in cross-section and 205 mm in length. Unfortunately the numbered sleeves on this tag were less robust and one or more of the digits abraded and fell off in a brief period. Returns from fishers remained lower than expected and gradually more of the trailing end of the tag was left intact to improve visibility.
In all, 1535 crabs (711 females and 824 males) were tagged and released. A total of 277 tagged crabs were released at 7 points in Brandon Bay, the balance at 30 points in Tralee Bay. A total of 392 recaptures were alluded to on claims forms (117 were the only marked captures on the day but 2 crabs were taken by a fisher on the same day on 73 occasions, 3 on 33, 4 on 12, 5 on 18, 6 on five and 8 on one) but only 306 (20% of the total tagged) were individually reported. The amount and quality of data were variable and the carcass of the tagged crab was not always surrendered.
Tagged females ranged in size from 99 to 153 mm, averaging 123.2 mm CL. The percentage above 125 mm (national size limit) was 42.5% and the percentage weight above 125 mm was 47.5%. Males ranged in size between 95 and 182 mm CL, averaging 129.2 mm; 36.7% were above 130 mm (national size limit). Weight of catch above 130 mm was 51.2%.
The ratio of female to male recaptures was 12.8:26.0.
The size–frequencies of 91 recaptured females were compared with the size–frequencies of the 711 released animals (χ2 = 0.47, 8 df, NS). Size–frequencies of 215 recaptured males were compared with the size–frequencies of 824 released (χ2 = 0.20, 8 df, NS). There would appear to have been no bias for size among recaptured crabs.
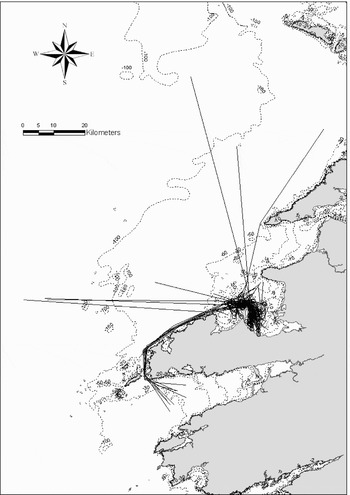
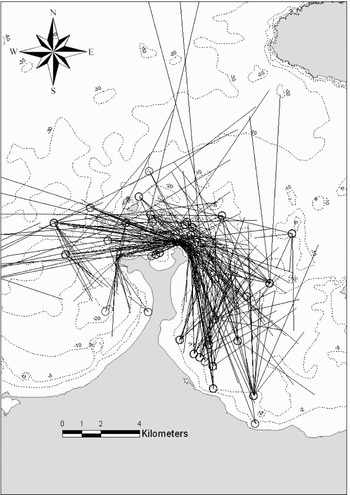
The estimated distance moved was the minimum, avoiding land, from release to recapture (Figures 6 & 7). The period during which males and females were at liberty did not differ significantly. The distance moved by males and females each day did not differ significantly either (Table 4). Cursory examination of the data suggests that both sexes moved most rapidly immediately following release but too few recaptures after a brief period of liberty were obtained to confirm this.
Mark–recapture minimum distances within and outside the Magharees fishery.

Tagging release (circles) points and minimum distance to recapture within the Magharees fishery, in the vicinity of Rough Point.

Characteristics of spider crab catches from the Magharees fishery, 1985–2007.

Distance moved by males and females.

N.S.* = non-significant.
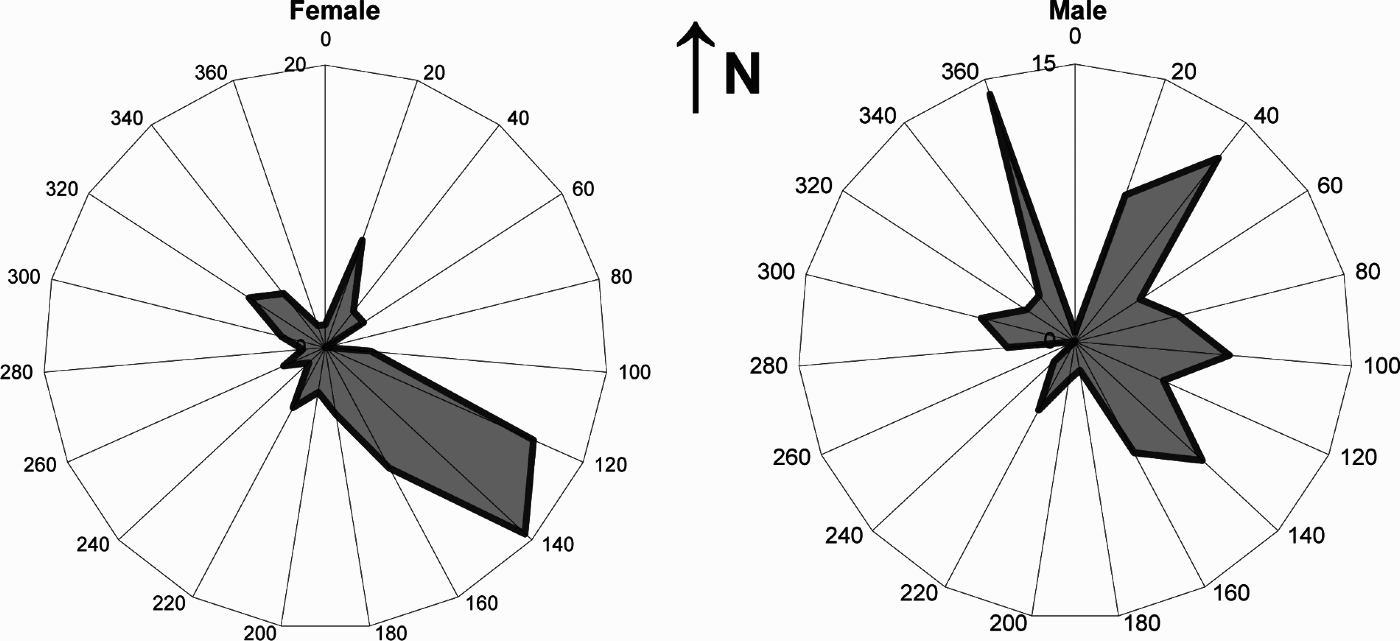
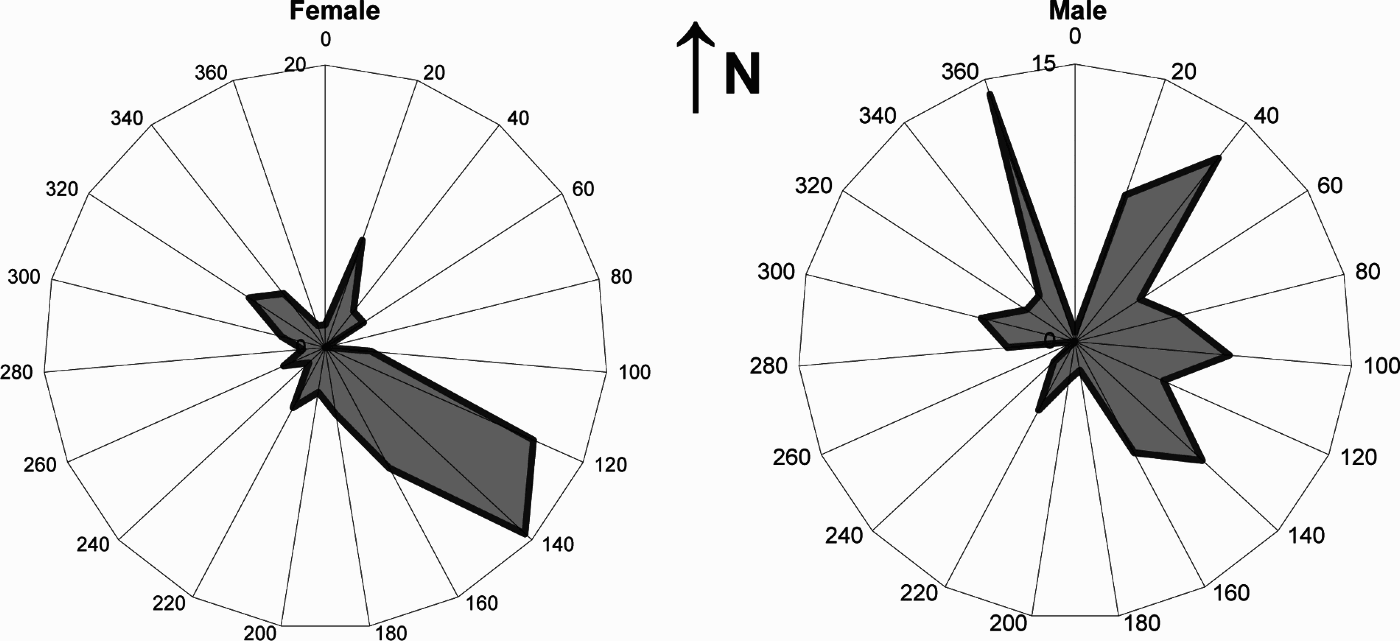
The distance travelled by males was significantly longer than by females. The five longest recorded minimum distances were for males: 39.9, 19.9, 9.3, 6.6 and 6.1 km: for females the longest minimum distances were 4.2, 2.1, 2.0, 1.3 and 1.1 km. The shortest minimum distances moved are essentially unreliable. A total of 249 records of recaptures bearing details of recapture and release points were recorded. Only 11 (4.3%) of these were made in the months of September–November inclusive but 27 (a further 10.5%) were made in August. Directional movements are summarized in Figure 8. The majority of females moved in a predominantly east–south-east direction (120–160°) during the fishing season. The majority of males moved in an easterly direction with a wider spread of trajectory (between 20 and 160º).
Directional movements by female and male spider crab between release and recapture.
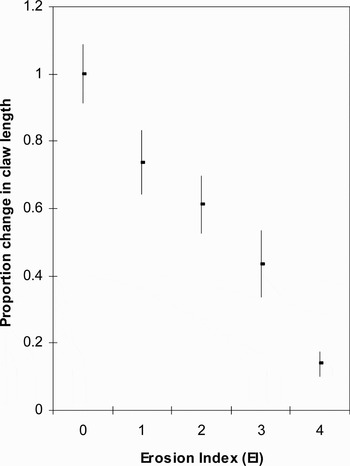
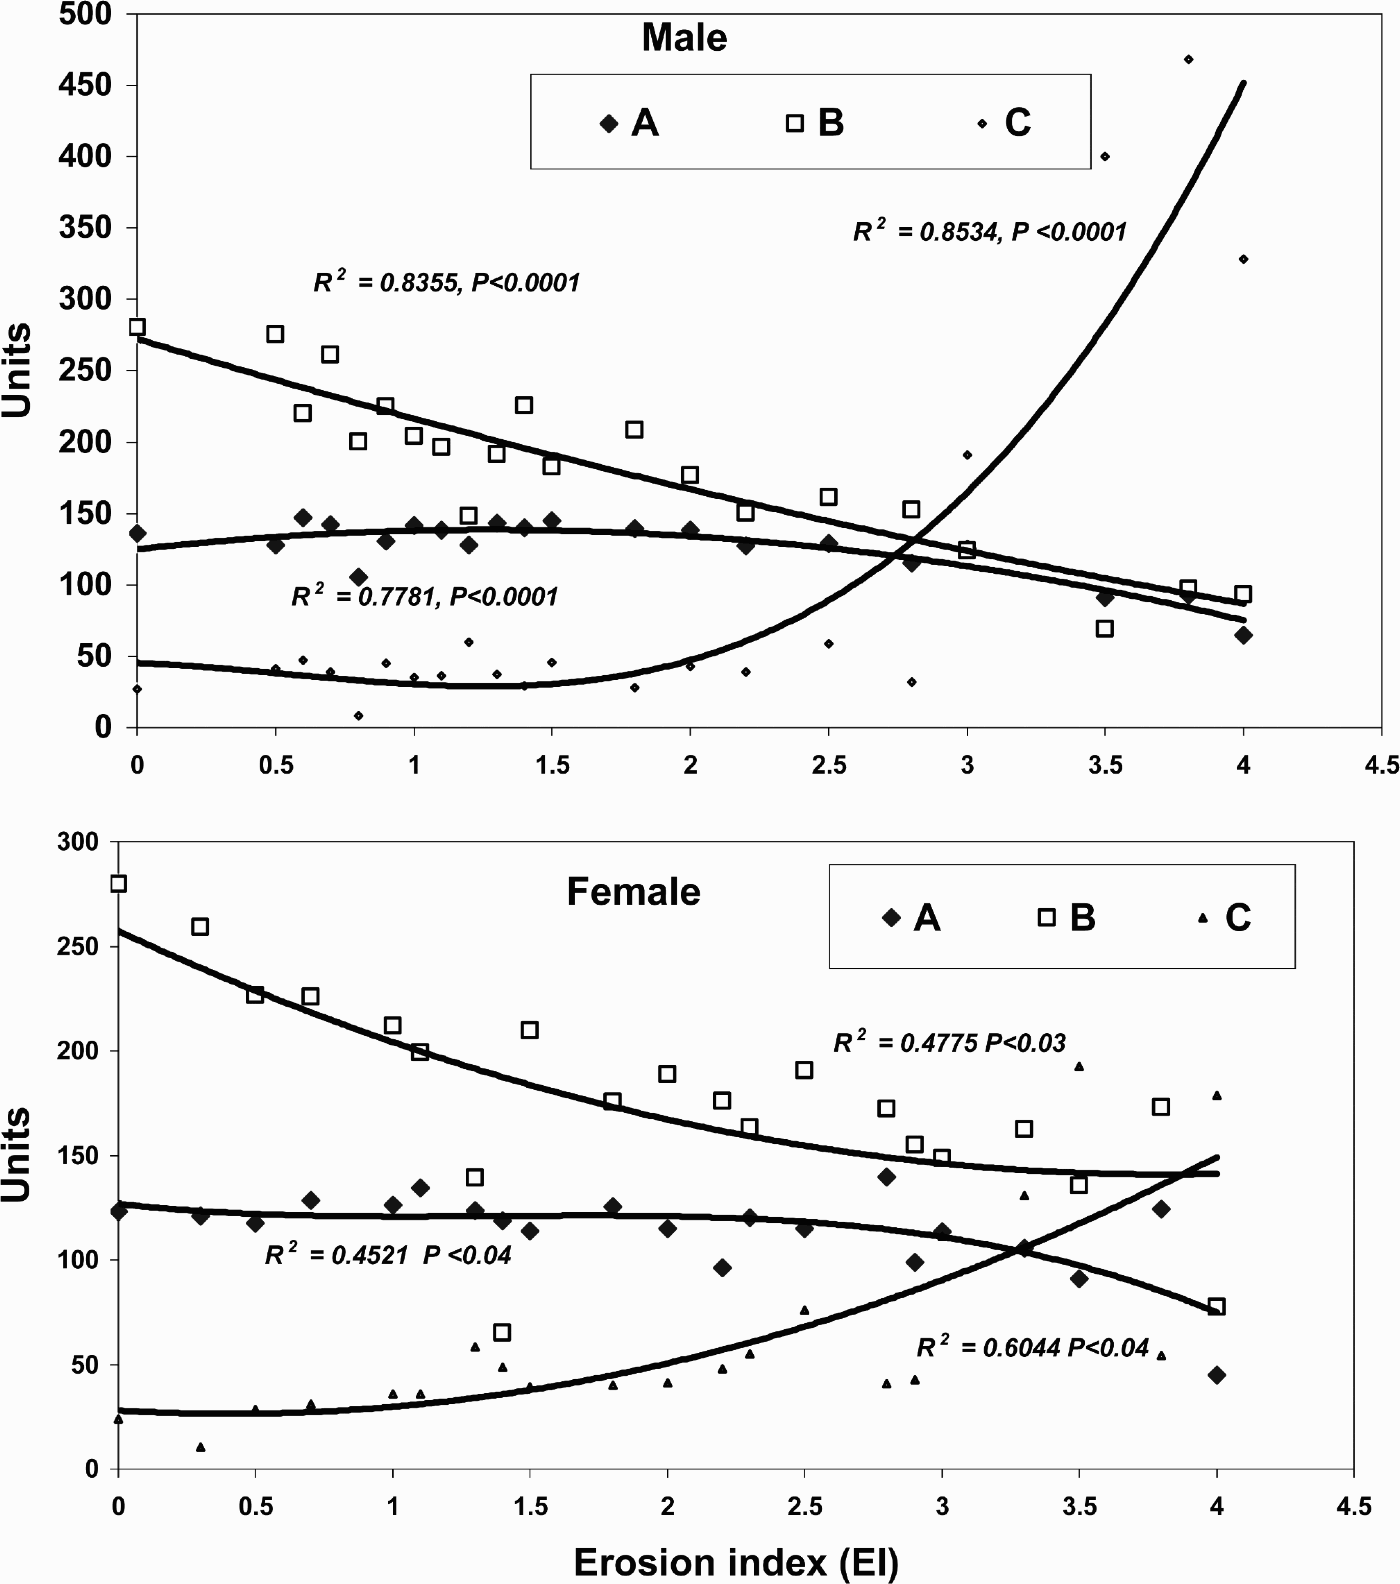
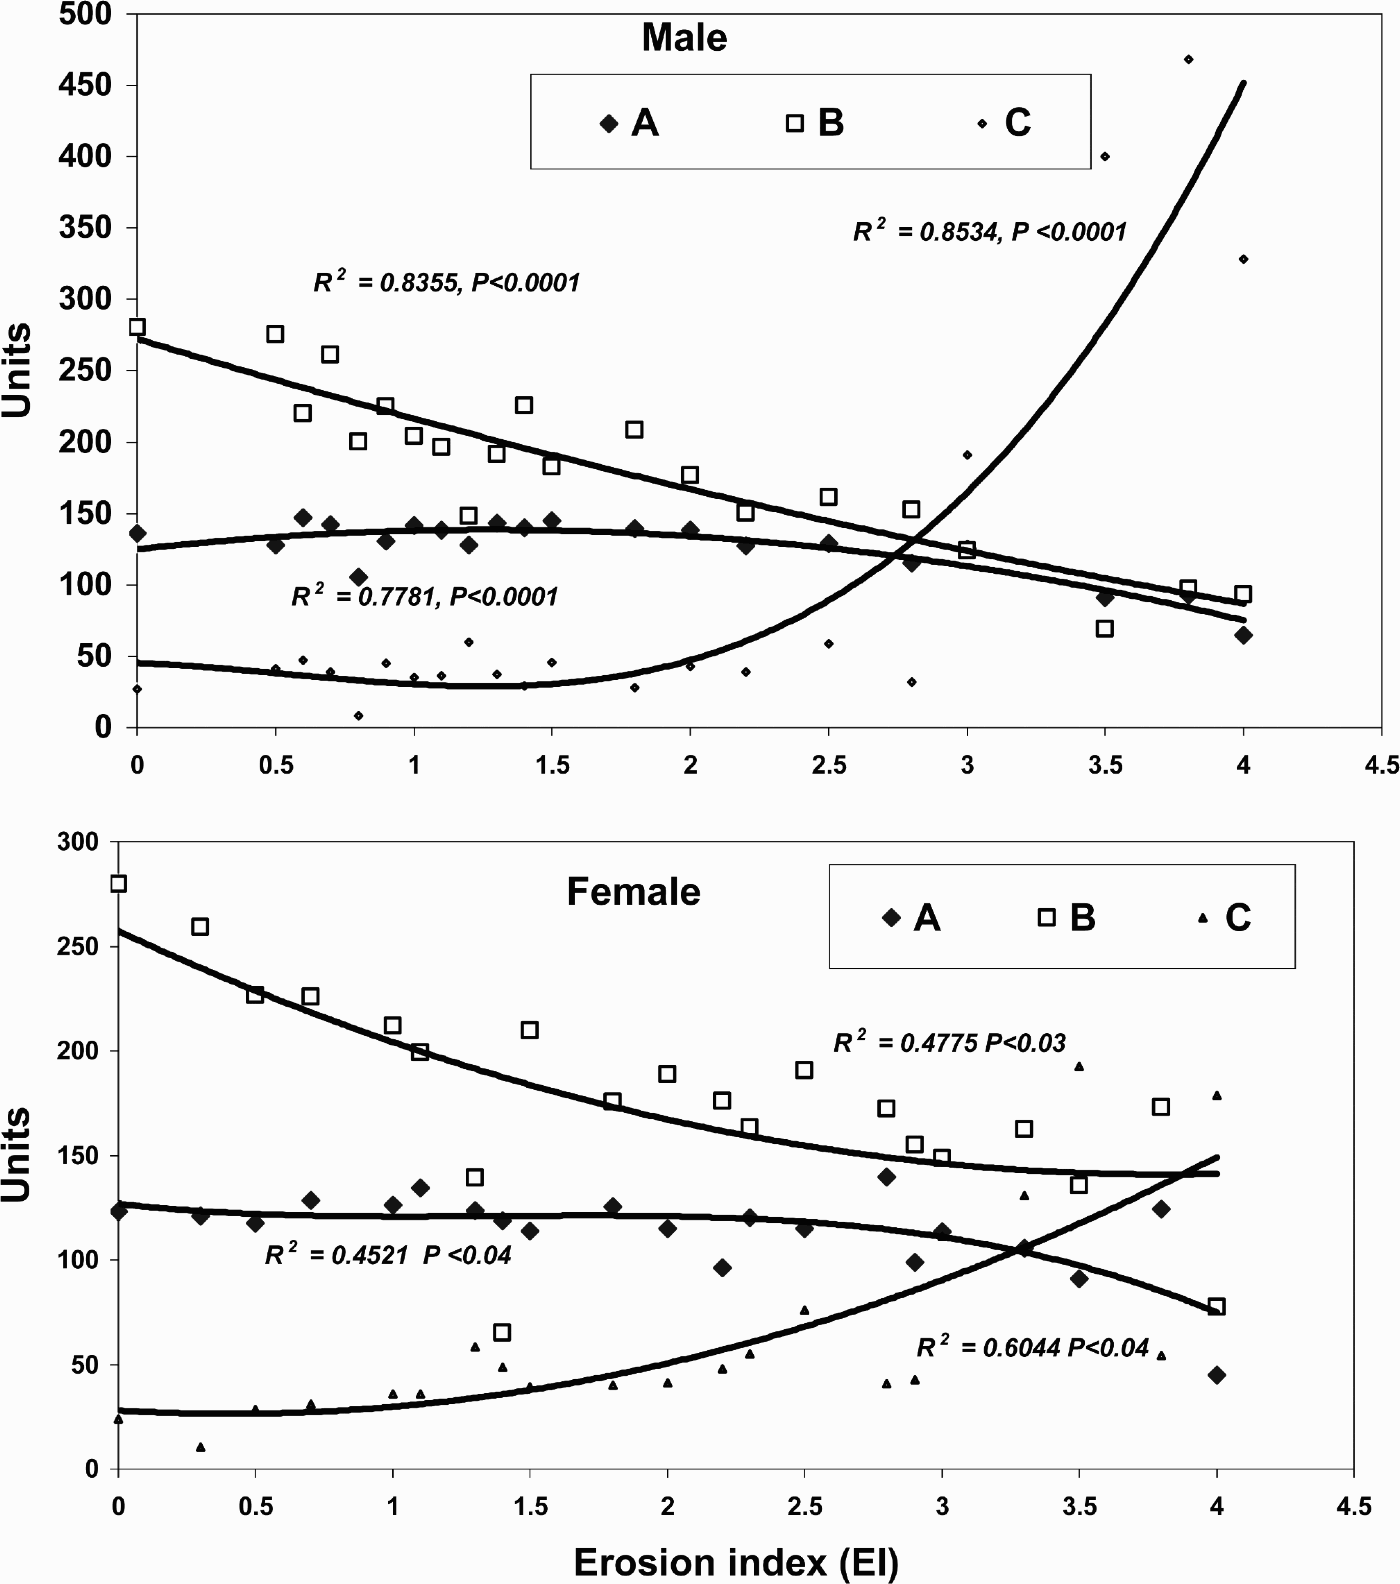
The length of the claw (one of the most obvious indicators of status) shortened as EI rose (Figure 9). The length of the claw, its proximal height and the length from the tip of the claw to the distal border of hairs on the dactyl were measured (Figure 2). Three indices were devised to illustrate the erosion process:
(A) (claw height/CL) × 5000;
(B) (claw length/claw height) × 100; and
(C) (wear on the dactyl above the claw/CL) × 2000.
Loss of length of the claw on P3right (males and females) with increasing EI. Mean ±1 SD given.

The raising factors were chosen to facilitate presentation and comparison of the eroding dactyl. The three are set out for both sexes separately in Figure 10. (A) remained constant up to EI 2.5 in the male and 3.0 in the female after which it declined; (B) declined throughout the erosion process in the male but levelled off in the female at higher EI values and; (C) was level up to ~2.0 then increased steeply in the male but much less in the female suggesting much greater wear on the lower dactyl above the claw of the male. The line C does not fit well in the female and some with higher EI values also demonstrated loss of pigment and thinning of the pereiopods which may be associated with loss of calcium (Figure 2; EI 3).
Three indices of the erosion process on the P3right, males and females. A = (claw height/CL) × 5000; B = (claw length/claw height) × 100; C = (wear on the dactyl above the claw/CL) × 2000.
High precision sought by expressing the five EI values on a decimal scale was not always reliable. Ten males (6.6%) were attributed a younger age on recapture than at release by 0.1–0.2 of an EI unit; all were originally attributed an EI of between 1.0 and 2.0; 4 females (7.4%) originally aged at 1.0–4.0 were likewise reckoned to be younger on recapture, also by 0.1–0.2 EI units. The period during which these animals were at liberty ranged from 3 to 312 days and averaged 64.
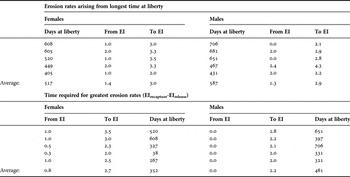
Erosion index values were attributed to 50 recaptured females and 153 recaptured males which were accompanied by recapture dates. Male EIrelease ranged between 0.0 and 3.9 and averaged 1.3 while male EIrecapture ranged between 0.2 and 4.3 and averaged 2.1; period at liberty ranged from 1 to 706 days, averaging 133. Female EIrelease ranged between 0.0 and 3.5 and averaged 1.8 while female EIrecapture ranged between 1.0 and 3.8 and averaged 2.6; period at liberty ranged from 2 to 608 days, averaging 105.
There was considerable variability in erosion (EIrecapture–EIrelease) arising from different periods at liberty. To illustrate, EI values associated with the five longest periods at liberty by male and female spider crab are set out in Table 5. The time at liberty associated with the five greatest erosion values is also shown in Table 5. Heaviest erosion was not invariably associated with the greatest time at liberty.
Erosion index (EI) values associated with the five longest periods of liberty in males and females and the time required for the greatest difference between EI at recapture and release.

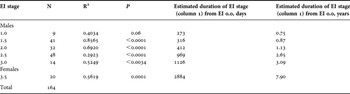
Attempts were made to age by correlating erosion against the period, in days, during which the animal was at liberty. Separate regressions were carried out for males and females at intervals of EI 0.5: for example at EIrecapture ≤ 0.5, 1.0, 1.5 etc. Regressions are summarized in Table 6. Ageing was more straightforward in males than females: there were more recaptures and the erosion process may also have been more clearly demonstrated. Only one band of EI values provided a satisfactory regression in females: from EI 0.0 to EI 3.5. It would probably be misleading to bulk the findings for both sexes. While erosion in males and females was labelled in the same way, it should not be assumed to take place at the same rate.
Claw erosion (EIrecapture-EIrelease) regressed on days at liberty.

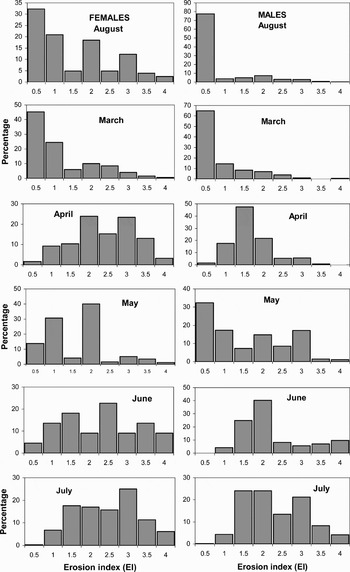
Bulking all material by month, EI values for males and females are set out in Figure 11. Female EI values were low in August and March but thereafter there appeared to be little coherent pattern of change. It has been shown that the sex ratio may display anomalies from time to time in both Brandon and Tralee Bays. It might also be the case that particular ages and conditions of spider crab cluster locally and that factors which influence cluster behaviour might mask temporal changes in EI. Male EI values were also very low in August and March but thereafter they gradually rose, with the exception of May. There is approximate agreement with the results for males in Table 6 which suggests that the period required to reach EI 2.0 is 1.1 years.
Frequency of all EI values recorded in the course of investigations in Magharees, 2004–2007 inclusive, arranged by month.

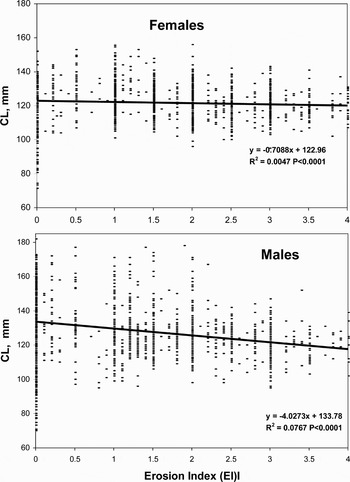
All EI values from Magharees, segregated by sex, are correlated with CL in Figure 12. As EI values are ascended, the trend in carapace length is downwards. The phenomenon was less marked in females but males which had higher EI values tended to be smaller and, if ageing was correctly interpreted, very few males ≥140 mm CL survived to complete their first year in the fishery.
Erosion index (EI) values and CL of male and female spider crab in Magharees, 2004–2007.

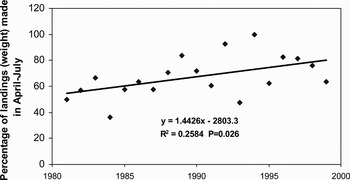
Documents from a shellfish buyer provided details of purchases by vivier transport operators. Over the period 1981–1999, from which these data were available, the fishery tended to land an increasing percentage of the annual total in the early months of the year; initially 60% of landings were made in the period April–July inclusive but latterly this increased to 80% (Figure 13).
The percentage of spider crab landings in Magherees during the period April–July (1981–1999) inclusive.

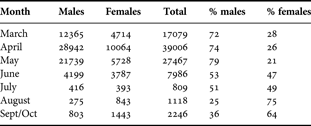
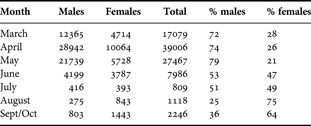
Vivier buyers handle their purchases more carefully because they select individuals of higher value which must be capable of surviving a journey of several days; prices can vary according to the sex of the crab purchased. Tally books containing details were available for the period 1998–2001 inclusive. These are summarized in Table 7 which demonstrates the prevalence of males in the spring and females in the autumn fishery.
Numbers of males and females landed per month in the years 1998–2001.
Details of fishing effort within Magharees were provided on 247 recapture claims forms for the period 2005–2007 inclusive. The number of pots hauled and set did not vary according to month. The average number raised and set on each fishing occasion was 477 ± 48.5 over the year as a whole. Landings averaged 15.6 ± 7.4 boxes each containing approximately 18 kg of spider crab. Each pot lift thus yielded ~0.6 kg of crab.
DISCUSSION
The Gulf of St Malo, from which much of the present knowledge of spider crab emanates (Latrouite & Le Foll, Reference Latrouite and Le Foll1989) has a superficial geographical resemblance to Magharees (Figure 1); both are west-facing and open to the Atlantic. In both brown crab dominates the Atlantic littoral and spider crab the inshore. Nursery areas were described by Latrouite & Le Foll as within 20 m depth. The size-range of adult and adolescent males reported by Le Foll et al. (Reference Le Foll, Latrouite and Noël1993) for the two phases was similar to those reported here.
In Kilkieran Bay in County Galway in summer, mature male spider crab frequented depths of ~10 m and mature females ~5 m (Rodhouse, Reference Rodhouse1984). Segregation by depth would explain the higher density of females in Tralee Bay and males in Brandon Bay (Table 2).
The pot fishery is the principal source of fishing mortality on spider crabs in the Magharees fishery but it is not the only one. If tangle nets are a source of mortality among crawfish and rays at Magharees, they are capable of depleting spider crab also but they are not size selective. Males are more vulnerable to them because they move greater distances but it is the differential mortality of size-categories which emerges as the significant finding from these enquiries.
Within Magharees, movements by the animals, particularly females, during the fishing season would appear to be slow, hence the predominantly eastward progression throughout the fishing season (Figure 8). González-Gurriarán & Freire (Reference González-Gurriarán and Freire1994a, Reference González-Gurriarán and Freireb) used ultrasonic telemetry to monitor the movement of spider crabs in the Ría de Arousa in Galicia. Juveniles made non-directional movements of 4.5 m and 9.7 m/day in winter and summer respectively at an average depth of 4.5 m. After the pubertal moult in summer adults behaved similarly but extended their range to 22.1 m/day at depths of 7.3 m. Daily movements increased further when weather changed and the adults sought deeper water. It is at this point that the first adult migration of the life cycle began and thereafter offshore movements took place annually with the onset of colder weather in the autumn. The fact that animals of both sexes in Magharees were recaptured close to their point of release 300–600 days later cannot be interpreted as confirming they had not moved; it is more likely that they had returned from a longer migration.
The depth to which spider crab in Magharees migrate is not known but some were recaptured at >100 m in the present work (Figure 6). Kergariou (Reference Kergariou1976) reported that spider crab was fished in winter at a depth of 50 m in the vicinity of the Channel Islands. Some of Edwards's (Reference Edwards1980) recaptures were at 60 m depth.
Working on the south coast of England Edwards (Reference Edwards1980) described a mark–recapture experiment on M. squinado. The species undertook movements of up to 196 km after moving offshore to deeper water in September/October. Crabs moved back into shallow waters in late April or early May. In many respects the results he obtained were similar to those in the present work. Preliminary results from Edwards reported that 52 males and 13 females had moved distances exceeding 18.5 km and the majority of long distance movements by both sexes were in a westerly direction. Keragariou (1976) observed that recaptures occurred in the three zones where he marked and released crab. A similar pattern of return to the area in which release took place is believed to have occurred in Magharees also. Thus, the minimum distances recorded year on year are an understatement.
Susceptibility of males to selective capture in traps was described by Rodhouse (Reference Rodhouse1984) fishing for spider crab in Kilkieran Bay, County Galway between July 1978 and July 1980. Catch per effort rose to a summer peak and declined in autumn. Mature males predominated in the catch with the lowest F:M ratio in summer. As in Magharees, immatures were virtually absent from the catch. Rodhouse's laboratory trials recorded increased aggression among males in the presence of baited pots. Males drove other males away from pots but females were not affected. Such behaviour might not be so prevalent now that larger older males have been selectively removed. Our observations indicated that males were recaptured at twice the rate of females. Recaptures of 12% males and 7% females reported by Edwards (Reference Edwards1980) were similar.
All of the data gathered during the course of this work suggested that males are more active than females. Males migrated longer distances (Table 4) and displayed greater claw erosion (Figure 10). Males also moved within a broader eastern trajectory during inward migration (Figure 8). Thus males are likely to encounter more fishing gear. In the early years of the fishery an average of 3750 pots were fished in Magharees; in 1988 this number had risen to 6000 which continued to rise to a peak of 10,000 pots in 1997 (Fahy, Reference Fahy2001). In 2006 approximately 8000 pots were fished there. It is suggested here that virtually all spider crab in the Magharees fishery are likely to be captured at least once a year and that the depletion of larger males takes place in the spring (Figure 13). Kergariou (Reference Kergariou1976) observed that females are more accessible to capture at the end of the summer when they begin to move to wintering grounds and that might also contribute to the higher incidence of females later in the year (Table 7). Insufficient information is available to state whether fishing effort has become more concentrated in the spring or if a depleted stock is fished down earlier in the year.
Comparison of data collected by Fox (undated) in 1985 with the census material gathered in the recent investigation provides one of the clearest indicators of what occurred in the course of the fishery (Table 3). In the early 1980s it is likely that there was a greater abundance of older year-classes of spider crabs. The increase in fishing effort depleted them, particularly by the removal of large males. This appears to have been the factor which caused the concern prompting these enquiries. Increasingly, Magharees has become a one-year-class fishery. However, this is not unusual for spider crab. González-Gurriarán & Freire (Reference González-Gurriarán and Freire1994b) stated that the post terminal moult migration provided animals for the tangle net fishery in the Ria de Arousa. The new recruits made up 80–90% of the stock and they were not adequately conditioned before December. Similar observations were made on the Normandy/Brittany fishery by Kergariou (Reference Kergariou1984).
The attempt to introduce a more precise chronology to the longevity of the final moult should be further developed using a number of other age indicators. Fonseca et al. (Reference Fonseca, Sainte-Marie and Hazel2008) combined a mark–recapture experiment with observations on changes in shell hardness, condition and change in dactyl length in male snow crab in an attempt to age them. Their observations showed that the dactyls eroded slowly in the first year after moult and faster thereafter. A factor contributing to dactyl wear was carapace width (larger snow crab were heavier and migrated longer distances during annual mating runs), which is likely to be influential in Magharees also although we were unable to confirm it. The nature of the substratum was also seen to be another source of variability in the interpretation of dactyl wear. The chronology we developed confirmed that large adult males have a brief survival in the fished population of the Magharees.
Ascertaining what changes have occurred with elapsed time in a largely undocumented fishery is problematical. It is however a necessary undertaking at a time when new fishing targets are constantly being sought and depletion of one resource results in the transfer of fishing effort onto another.
The history of spider crab fisheries in the British Isles is brief and similar in some respects to the exploitation of velvet crab (Necora puber (L.)) (Fahy et al., Reference Fahy, Carroll, Smith, Murphy and Clarke2008). Demand arose in continental markets. Exports from Britain were followed in due course with the development of a fishery in Ireland. Kergariou (Reference Kergariou1984) provided a history of spider exploitation which will be familiar to anyone with an interest in the large, less expensive decapod crustacean species. Spider and brown crab assumed commercial importance following the run-down of lobster and crawfish stocks in the 1960s. Kergariou reported the species ranging from the south of Ireland to Guinea (quoting Monod, Reference Monod1966). The eastern limit of its range south of Ireland he claimed to be the Pas de Calais. Kergariou's map indicated the species barely extended as far north as the southern English coast and not so far north as Ireland, although at that time the Magharees fishery had been in operation for three years. Anticipating an expanded fishery in England, Edwards (Reference Edwards1979) stated that south-west Wales marked the northern extent of the species. Both Edwards and Kergariou recognized spider crab as having a pronounced southern distribution and this view was also shared by Bates (Reference Bates1981). There can be little doubt that the Maja squinado species complex does have a southern emphasis and does better in warmer waters, the number of egg broods increasing from one in Irish waters (Rodhouse, Reference Rodhouse1984; Fahy, Reference Fahy2001) to two in France (Kergariou, Reference Kergariou1984) and three in Galicia, Spain and in the Adriatic (Stevcic, Reference Stevcic1967; González-Gurriarán et al., 1996).
The temperature of marine waters around Ireland is currently rising (Nolan & Lyons, Reference Nolan and Lyons2006), a circumstance which should favour spider crab. The juveniles of southern species like gilthead sea bream (Sparus aurata) have recently become common in southern Irish waters (Fahy et al., Reference Fahy, Green and Quigley2005) providing evidence that species favouring warmer waters are moving northwards. Commercial interest in landing spider crab is also growing, partly at least as a result of the availability of fewer target species and the improving capture technology and increasing effort in inshore fisheries. On the other hand, quantitative data such as catch per unit effort, which might be indicative of abundance, are less supportive of the case for the species recently extending its range. Kelly et al. (Reference Kelly, Nee, O'Donovan and Tully2003) recorded average CPUE of 0.72–0.78 kg per pot at Derrinver, Blacksod and Cleggan (western Ireland) but Rodhouse (Reference Rodhouse1984) had reported up to 0.4 kg/pot lift in the spring months of 1979 and 1980 in Kilkieran Bay, Connemara (within 40 km of two of Kelly et al.'s sites) almost a quarter of a century earlier.
Reduction in the size of male spider crab within the exploited population of Magharees is consistent with harvesting a hitherto unfished population. The percentage weight of legally catchable males fell from 75% in the late summer of 1985 to between 27 and 56% after 2000. Among females the alteration from 51% to between 40 and 87% was less convincing. The disappearance of large males was particularly marked in the landings of the late summer and early autumn. If females suffered a similar fate it was to a lesser extent. There are insufficient effort data to confirm if fishing was refocused on the spring months or whether the recruitment of larger crab returning from their first autumn migration was more quickly depleted in more recent years. All captured adults that are not retained are immediately discarded into the shallow waters of the Magharees in which they are likely to survive. All adult females were berried throughout the season, irrespective of their size. However, the fishery for Canadian snow crab, another Majid species (Chionoecetes opilio (Fab)), harvests males and managers recognize the necessity of maintaining a male component of sufficient quality and quantity to adequately inseminate females (Fonseca et al., Reference Fonseca, Sainte-Marie and Hazel2008). A loss of fertility within the male population as a possible consequence of pursuing the Magharees fishery with the same intensity over the longer term, merits consideration.
ACKNOWLEDGEMENTS
Gratitude is expressed to the fishers of Magherees, Castlegregory, particularly to the late Crohan O'Grady, a long time advocate for the spider crab fishery there and his son Seamus on whose vessel tagging was carried out. Gavin Power and Vera O'Donovan of BIM assisted with the collection of tags. Nicola O'Brien of the Marine Institute advised on the processing of GIS data. Bernard Sainte-Marie (Ministère des Pêches et des Océans, Quebec, Canada) kindly made available the in press paper of Fonseca et al. (Reference Fonseca, Sainte-Marie and Hazel2008). He also read through the MS and made a number of suggestions for its improvement.