Introduction
The International Wellbeing Index (IWI) is a measure of general quality of life, useful for international comparisons. It is formed by two scales: the Personal Wellbeing Index (PWI) and the National Wellbeing Index (NWI) (Cummins et al., Reference Cummins, Eckersley, Pallant, Van Vugt and Misajon2003; International Wellbeing Group, 2006). The PWI measures satisfaction with several aspects of personal life and the NWI satisfaction with the situation of the country.
The IWI was initially developed in Australia and cross-validated in several countries. The PWI was found to be a robust and psychometrically sound measure in older populations (Lau et al., Reference Lau, Chi, Cummins, Lee, Chou and Chung2008; Rodriguez-Blazquez et al., Reference Rodriguez-Blazquez2011) and it has been successfully applied in Spain (Casas et al., Reference Casas, Figuer, Gonzalez and Malo2007; Rodriguez-Blazquez et al., Reference Rodriguez-Blazquez2011). To date, all validation studies of the IWI have used psychometric methods following the classic test theory. These results indicate that the IWI displays good psychometric performance in terms of validity, reliability and sensitivity. However, measurement theory is currently considered as the standard for developing and revising quality of life measures (Tennant et al., Reference Tennant, McKenna and Hagell2004). Its simplest form is the Rasch model, using difficulty as a single parameter. Rasch analysis is a mathematical modeling technique that converts ordinal scales into linear measures, using a logit model (Rasch, Reference Rasch1980). In this way, Rasch measures allow the calculation of change scores and the use of parametric statistics.
This paper aims to study the psychometric properties of the IWI using Rasch analysis. The need for Rasch analysis of the IWI has been recognized previously (Rodriguez-Blazquez et al., Reference Rodriguez-Blazquez2011; Forjaz et al., Reference Forjaz2011). Rasch analysis results will complete the psychometric data already available, besides assessing new and unique parameters such as unidimensionality, appropriateness of the response category ordering, local independence of items, item bias by specific groups, and scale targeting. Classic psychometric methods were also applied to assess external construct validity.
Methods
Study sample
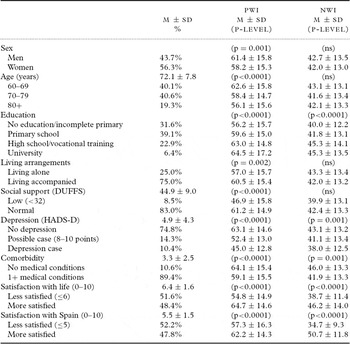
The study sample comprised 1106 community-dwelling adults aged 60 years and over, residing in Spain. To increase representativeness of the sample, cases were randomly selected from the Spanish Municipal Census of 2007 and stratified by region, age groups, sex, and town population size. The main sociodemographic characteristics are summarized as follows (Table 1): 56.3% were women; mean age ± standard deviation (M ± SD) of 72.1 ± 7.8 years, age range 60–96 years; 70.7% with primary or lower education; 58.5% married or with a partner; and 25.0% lived alone.
Descriptive statistics of sociodemographic variables and applied rating scales; NWI and PWI linear measures by groups of participants (t-test and ANOVA)

ANOVA = analysis of variance; DUFSS = Duke-UNC Functional Social Support questionnaire; HADS-D = Hospital Anxiety and Depression Scale-Depression subscale; M ± SD = Mean ± Standard Deviation; ns = non-significant Bonferroni corrected p-level of 0.005; NWI = National Wellbeing Index; PWI = Personal Wellbeing Index.
Assessments and procedure
The study was approved by the Ethics Committee of the Carlos III Institute of Health. Data were drawn from a larger survey, focusing on global quality of life, applied as a semi-structured interview undertaken at the participant's home after obtaining signed informed consent.
The main measure was the IWI, which includes the PWI and the NWI. The PWI was originally formed by seven items measuring an individual's satisfaction with the following aspects of their own lives: standard of living, health, achievements in life, relationships, safety, community connectedness, and future security. In 2006, a new item about spirituality/religion was added (International Wellbeing Group, 2006). A study in Colombia confirmed the reliability and construct validity of the eight-item PWI (Wills, Reference Wills2009). The NWI assesses personal satisfaction with the situation of the country. It is formed by six items focusing on the country's economic situation, state of the environment, social conditions, government, business, and national security (Cummins et al., Reference Cummins, Eckersley, Pallant, Van Vugt and Misajon2003; Renn et al., Reference Renn, Pfaffenberger, Platter, Mitmansgruber, Cummins and Hofer2009).
All IWI items are scored on an 11-point Likert-type scale, ranging from 0 to 10, where completely dissatisfied = 0, neutral = 5 and completely satisfied = 10. A total score is calculated by averaging the items' scores and standardizing results into a 0–100 scale using the percentage of scale maximum procedure. The results of the PWI and NWI cannot be combined.
Besides collecting sociodemographic information and applying the IWI, several measures of constructs related to subjective well-being were included to analyze convergent validity: two items asking for satisfaction with life in general and with life in Spain as a whole, respectively, using the same response scale as the IWI; the Hospital Anxiety and Depression Scale-Depression subscale (HADS-D) (Zigmond and Snaith, Reference Zigmond and Snaith1983); the Duke-UNC Functional Social Support Questionnaire (DUFSS) (Broadhead et al., Reference Broadhead, Gehlbach, de Gruy and Kaplan1988); a Comorbidity Index, adapted from the Cumulative Illness Rating Scale for Geriatrics (Miller et al., Reference Miller1992); the EQ-5D index and Visual Analogue Scale (VAS) to assess health status and health-related quality of life (EuroQol Group, 1990); the Barthel Index (Mahoney and Barthel, Reference Mahoney and Barthel1965) to assess functional independence in activities of daily living; the short version of the Sense of Coherence Scale (SOC) (Lundberg and Peck, Reference Lundberg and Peck1995) to assess general orientation to life; and the Loneliness Scale-6 items (De Jong Gierveld and van Tilburg, Reference De Jong Gierveld and van Tilburg2006). For all scales except the SOC, a higher score indicates a higher level of the measured construct.
Data analysis
Rasch analysis was performed using the statistical software RUMM2020 (Andrich et al., Reference Andrich, Lyne, Sheridon and Luo2003) and a random sample of 300 cases (Linacre, Reference Linacre1994). The likelihood ratio test was used to determine which Rasch model was the most appropriate – the Rating Scale (Andrich, Reference Andrich1978) or the Partial Credit version (Masters, Reference Masters1982).
Rasch analysis followed the procedure described in detail elsewhere (Pallant and Tennant, Reference Pallant and Tennant2007; Tennant and Conaghan, Reference Tennant and Conaghan2007). In brief, fit to the Rasch model is obtained when several conditions are met:
1. Items should be locally independent, expressed by low residual correlations (r < 0.30) between items after taking into account the trait. Locally dependent items indicate that they are linked in some way and are a close replication of each other, which artificially inflates reliability.
2. The items response categories are ordered in a way that increasing locations represent an increase of the trait. If thresholds (the transitional point between two adjacent categories) are disordered, items are rescored by collapsing adjacent categories.
3. There is a good fit to the Rasch model, examined through the individual item and person fit residuals (within ± 2.5) and a non-significant summary χ2 interaction statistic (with Bonferroni correction for number of items). In addition, item and person fit residuals follow a distribution with M ± SD of 0 ± 1.
4. Reliability, expressed by the person separation index (PSI) and interpreted similarly to the Cronbach's α, should be greater than 0.85.
5. Items should be free from differential item functioning (DIF). The scales are expected to show invariance across specific groups, in this case sex, age (60–69, 70–79, 80+ years), education (no education/incomplete primary, primary school, high school/vocational training, university), living arrangements (with or without partner), social support (low or normal, taking 32 in the DUFSS as the cutting point (Broadhead et al., Reference Broadhead, Gehlbach, de Gruy and Kaplan1988)) and presence of a medical condition.
6. The scale is unidimensional. This is formally tested by performing a principal component analysis of the residuals, taking two subsets of items, and comparing the person estimates for each individual by t-tests. Less than 5% of the tests should be significant. Unidimensionality is confirmed when the 95% binomial confidence interval overlaps 5% (Smith, Reference Smith2002).
When fit to the Rasch model was obtained, Rasch analysis was replicated in the total sample of 1106. The total sumscore, obtained from adding the individual item scores, was transformed into a linear measure, in a logit scale, with a theoretical M ± SD of 0 ± 1, and then converted to 0–100 range using a linear transformation. The linear measures were imported into the statistical software PASW 17 to perform classic psychometric tests. The following attributes were analyzed: skewness (expected to be within ± 1); closeness of mean and median; floor and ceiling effects (below 15%); and well as convergent and discriminative validity (Smith et al., Reference Smith2005). Normality assumption was tested and neither the PWI nor the NWI linear measures showed major deviations.
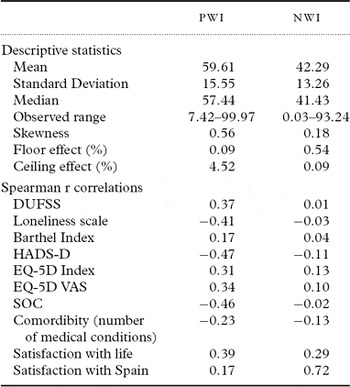
Convergent validity refers to the association of the target measures to others of related constructs. The magnitude of Spearman r correlation coefficients were considered as follows: low, r < 0.35; moderate, 0.35–0.50; and high, r > 0.50 (Juniper et al., Reference Juniper, Guyatt, Jaeschke and Pilker1996). Moderate to high correlations were expected between the PWI and the item “satisfaction with life”, social support (DUFSS), health-related quality of life (EQ-5D index and VAS), Loneliness scale, depression (HADS-D), and SOC. Low correlations were hypothesized between the PWI and disability (Barthel index) and comorbidity (number of medical conditions). NWI was expected to correlate at a high level with the item “satisfaction with Spain”.
Discriminative validity measures the ability of the scale to differentiate between known groups. T-tests and ANOVAs were used to compare the PWI and NWI measures by the following group variables: sex, age, education, and living arrangements. A Bonferroni correction was applied to account for the number of tests undertaken.
Results
Rasch analysis of the PWI
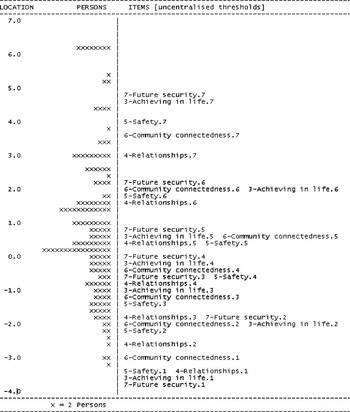
The rating scale version of the Rasch model was used (Andrich, Reference Andrich1978). The PWI items did not initially fit the Rasch model. Since all items displayed disordered thresholds, categories 1 to 4 were collapsed (new response scheme: 01111234567 for all items). Three items with a high fit residual, indicating they were measuring a different construct, were also deleted: items 1, 2 and 8 (standard of living, health, and spirituality, respectively). The final Rasch analysis with 5 items and 8 response options was satisfactory, with a good fit to the Rasch model [χ2 (20) = 16.380, p = 0.693], a M ± SD item residual of 0.230 ± 1.082 and person residual of -0.852±1.563. All items were locally independent and the PSI was 0.92. Strict unidimensionality was confirmed by a 95% binomial confidence interval of 0.05–0.10. Item 4 (relationships) displayed DIF by social support. All other items were free from DIF. Figure 1 presents the distribution of item thresholds and persons, displaying a good targeting of the scale to the sample. The model was satisfactorily replicated in the whole sample of 1106, with an interaction χ2 (40) = 61.697, p = 0.015, and a PSI = 0.91.
Person item threshold distribution: final Rasch analysis of the Personal Wellbeing Index.
Note: Mean ± Standard Deviation of the person locations: 1.020±2.070. On the right of the figure's vertical line, the value before the dot represents the item number followed by a short description, and the value after the dot represents the threshold.

Rasch analysis of the NWI
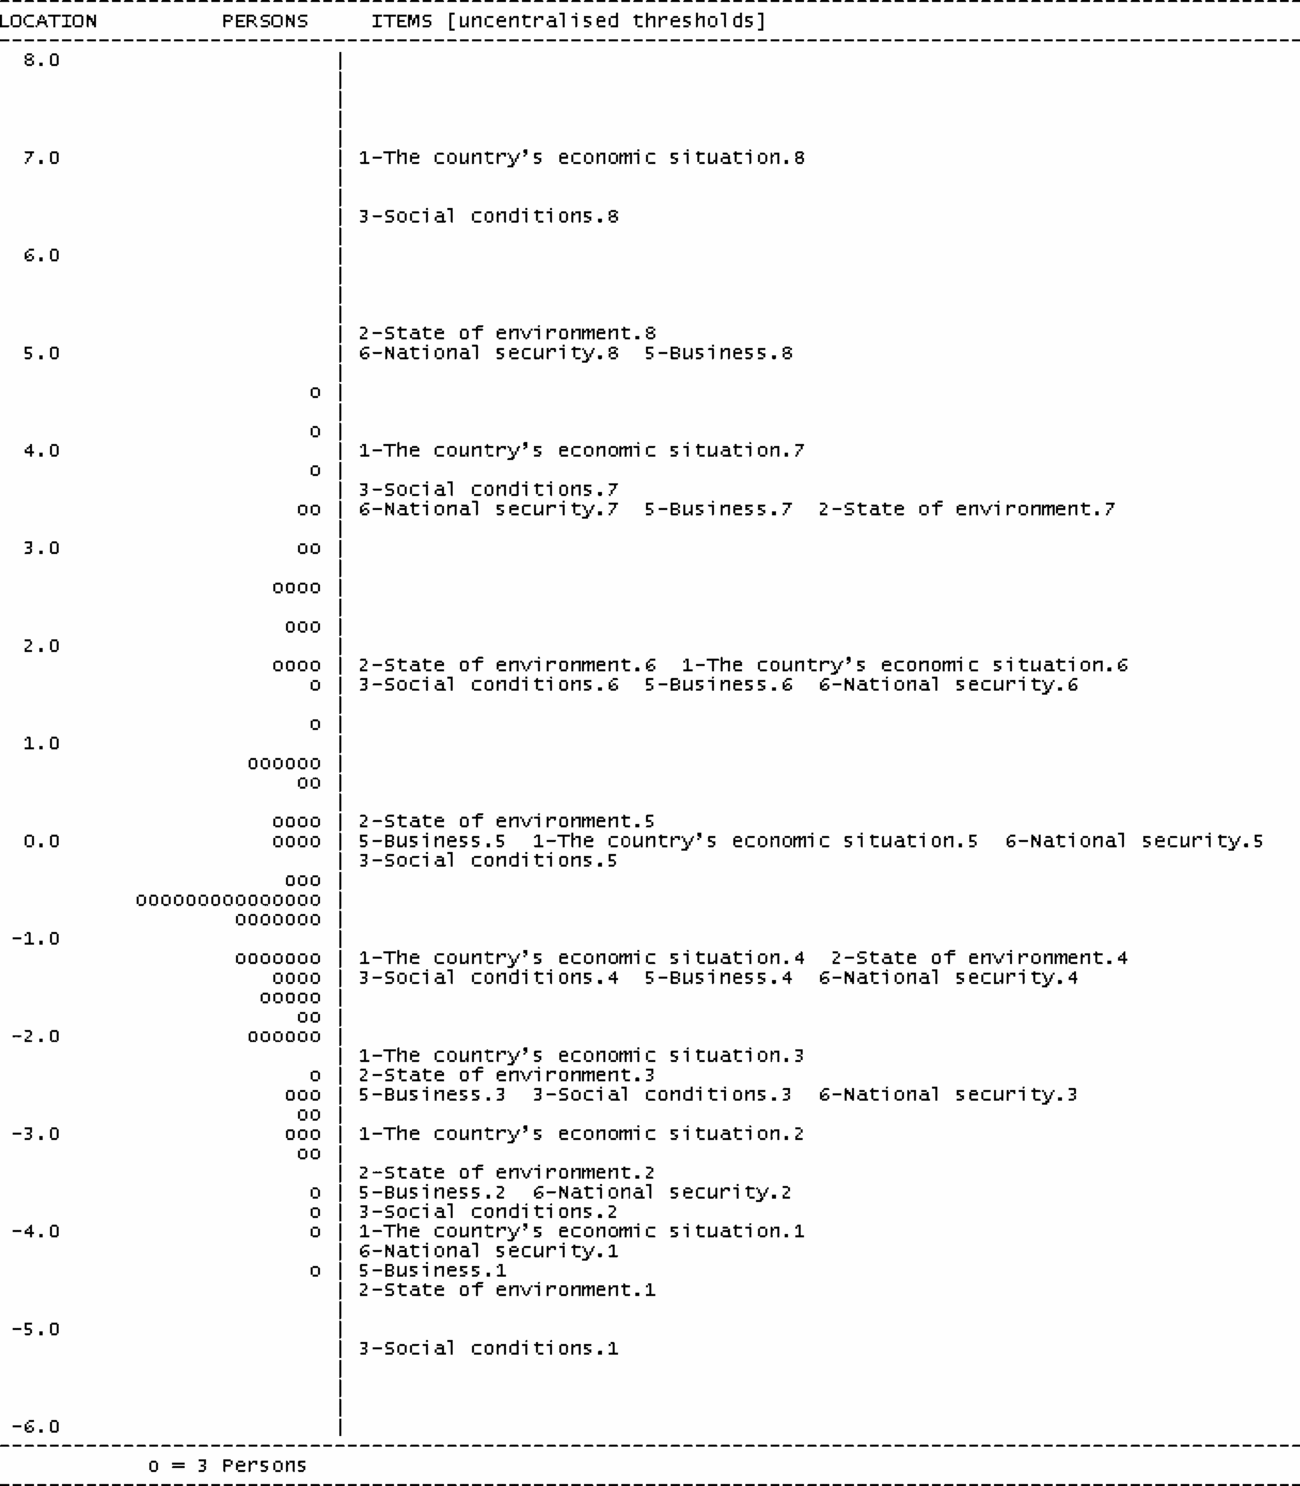
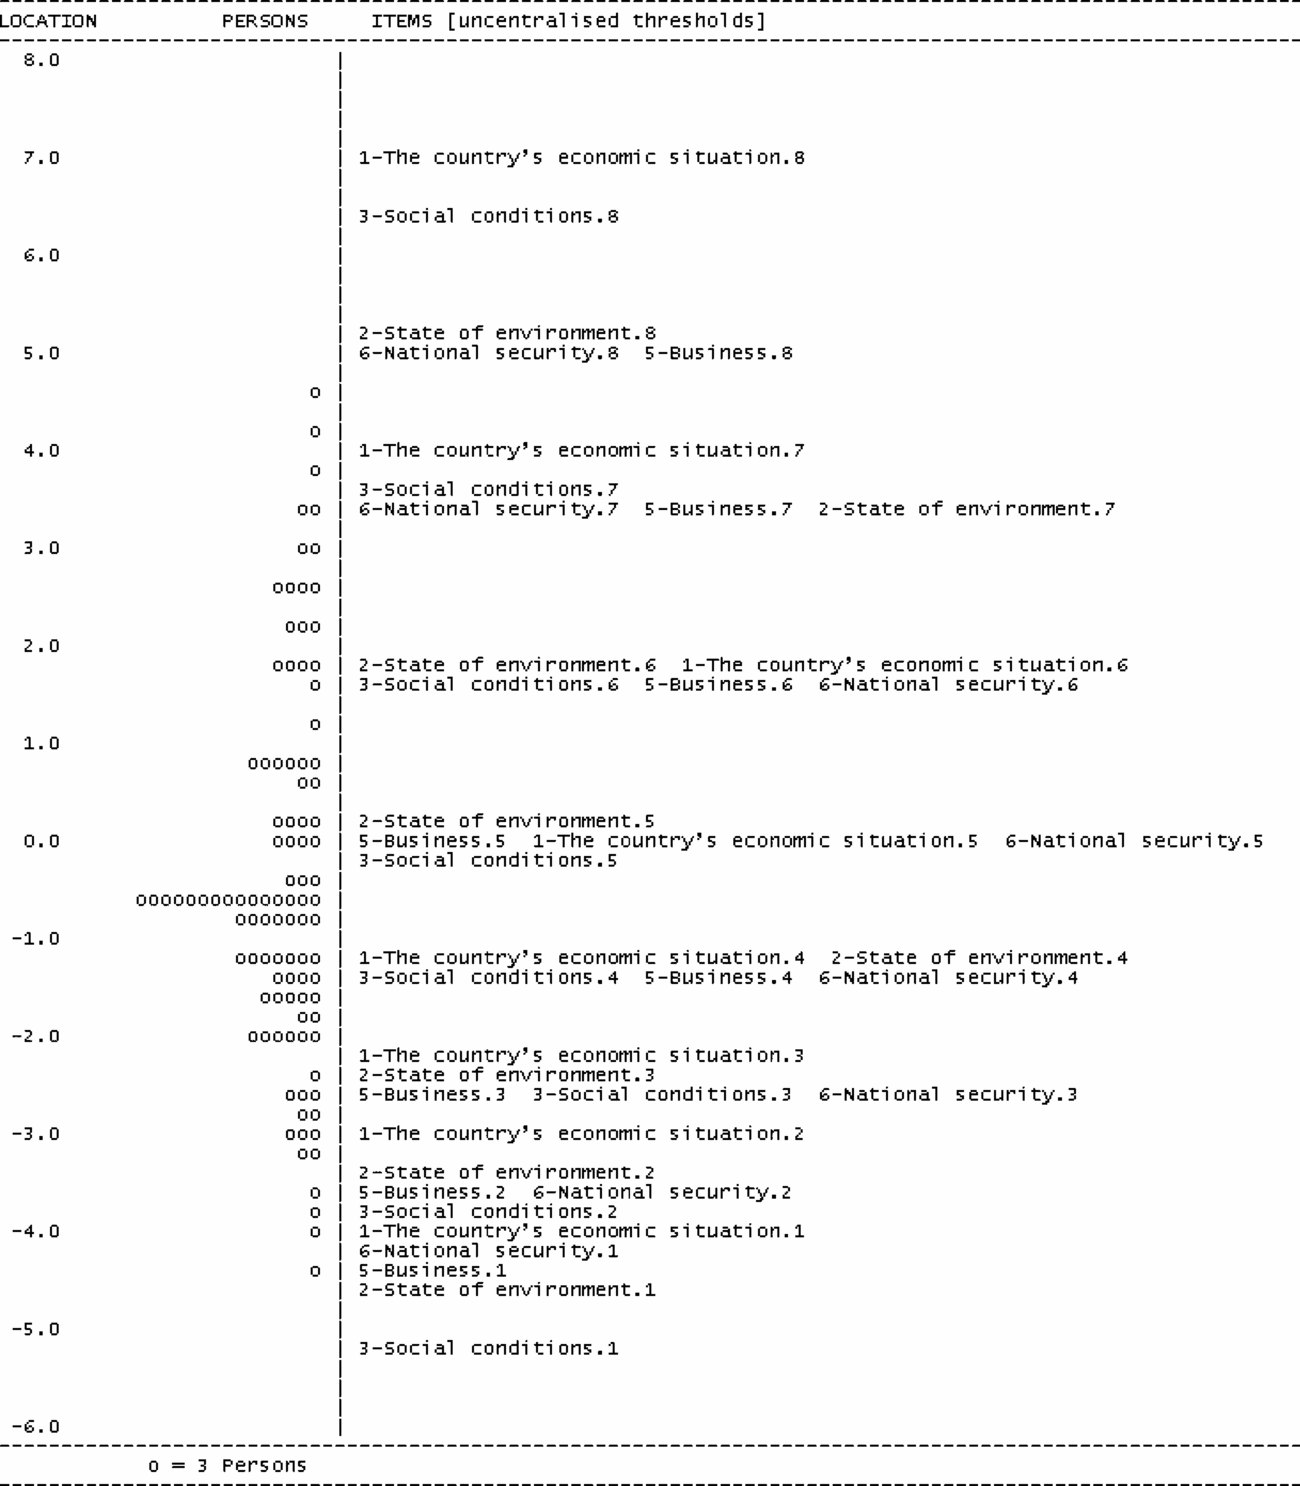
The partial credit version of the Rasch model (Masters, Reference Masters1982) was the most appropriate for the NWI. The initial analysis was not satisfactory. Since the response categories thresholds of all items were disordered, items were rescored (new response scheme for all items: 01123456778). Item 4 (government) displayed a high fit residual and was therefore removed. The resulting Rasch model was satisfactory, with an interaction χ2 (20) = 18.492, p = 0.555, a fit residual of -0.132 ± 1.938 (M±DT) for items and -1.182±2.196 for persons, and a PSI of 0.92. All items were locally independent and the scale was unidimensional (binomial confidence interval: -0.02 to 0.10). Item 5 (business) displayed DIF by presence of a medical condition. The person-item threshold distribution (Figure 2) shows that item thresholds were evenly spread across the construct. The model was successfully replicated in the whole sample: χ2 (45) = 69.409, p = 0.011; PSI = 0.91.
Person item threshold distribution: final Rasch analysis of the National Wellbeing Inde
Note: Mean ± Standard Deviation of the person locations: −0.333±1.917. On the right of the figure's vertical line, the value before the dot represents the item number followed by a short description, and the value after the dot represents the threshold.
Classic psychometric analysis of the linear measures
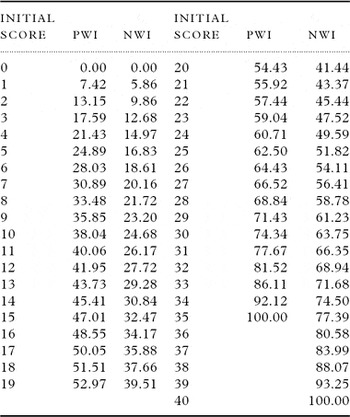
Table 2 provides the conversion of the raw scores to their interval scale equivalent. Descriptive statistics of the PWI and NWI linear measures and correlations with related measures are presented in Table 3. The measures did not display floor or ceiling effects, and skewness was within acceptable limits. The PWI correlated at a moderate level with social support (DUFFS), loneliness, depression (HADS-D), sense of coherence and the item “satisfaction with life” (r = 0.37–0.47, absolute value). The NWI showed a high correlation with the item “satisfaction with Spain” (r = 0.72) and a low association with the remaining variables.
Initial total score to linear measure conversion table (final Rasch models, n = 1106)

Note: The conversions are only valid in cases with no missing data.
PWI = Personal Wellbeing Index; NWI = National Wellbeing Index.
Descriptives and convergent validity of the PWI and NWI linear measures

* Magnitude of correlation coefficients: low < 0.35; moderate 0.35–0.50; and high r > 0.50 (Juniper et al., Reference Juniper, Guyatt, Jaeschke and Pilker1996)
DUFSS = Duke-UNC Functional Social Support Questionnaire; HADS-D = Hospital Anxiety and Depression Scale-Depression subscale; NWI = National Wellbeing Index; PWI = Personal Wellbeing Index; SOC = Sense of Coherence Scale; VAS = Visual Analogue Scale.
Concerning validity by known groups (Table 1), the PWI was significantly higher for the following groups: men, younger people, those with higher education, and those living with others. The NWI was significant by education level, in the same direction as the PWI (p < 0.005 for all).
Discussion
This is the first study to analyze the psychometric properties of the IWI using Rasch analysis, and to complement this with a classic approach. Results obtained in a representative sample of community-dwelling older adults indicate that the PWI and NWI provide linear measures with satisfactory reliability and construct validity.
Overall, the PWI items that fitted the Rasch model were: achieving in life, relationships, safety, community connectedness, and future security. The NWI items were: economic situation, state of environment, social conditions, business, and national security of the country. Rasch analysis suggested a number of changes to the original IWI. First, the respondents seem to have difficulty making a reliable distinction between the 11 points of the original response scale. Disordered thresholds indicate that their locations do not increase consistently with the construct. There has been much debate about the structure of the response scales when measuring life satisfaction (Mazaheri and Theuns, Reference Mazaheri and Theuns2009), and Rasch analysis provides an empirical test of the number of response categories. The response scale structure might be sample dependent, and more research is needed to replicate results in other populations. Rasch analysis of the Community Wellbeing Index also showed that the initial 11-point response scale displayed disordered thresholds (Forjaz et al., 2010).
Second, some items do not seem to measure the same construct as the rest. This was the case for the PWI items “standard of living”, “health” and “spirituality” (items 1, 2, and 8, respectively) and the NWI item “government” (item 4). In a classic psychometric approach using the same data, these items showed a relatively low item total correlation with the respective scales, corrected for overlap (below 0.70) (Rodriguez-Blazquez et al., Reference Rodriguez-Blazquez2011). The PWI initially did not include the item “spirituality” (International Wellbeing Group, 2006), and Rasch analysis indicated its misfit to the model, at least in a sample of older adults residing in Spain.
The changes suggested by Rasch analysis to the PWI and NWI may be applied to data obtained in previous studies. Researchers wanting to use the PWI and NWI linear measures only have to follow these simple steps: (i) rescore the items following the new scoring scheme; (ii) obtain a total score by summing the 5 PWI items and the 5 NWI items that fitted the Rasch model; and (iii) convert the total score into a metric scale (Table 2).
It is important to note that the linear measures derived from the 5-item PWI and the 5-item NWI are as reliable as the original scales. The reliability coefficients found in the present study were slightly higher than the ones reported previously, 0.73–0.85 for the PWI and 0.81–0.83 for the NWI (Rodriguez-Blazquez et al., Reference Rodriguez-Blazquez2011). The reliability of the PWI and NWI linear measures allows for individual comparisons, and to differentiate statistically between four or more groups of participants (Fisher, Reference Fisher1992).
DIF was studied for a large number of factors, and almost all items were free from bias. PWI item 4 (“relationships”) displayed DIF by social support, indicating that people with higher social support also scored higher on the item “personal relationships”. This might be due to the causal relationship between the measured constructs (social support measured by DUFSS and the item “relationships”). DIF by the presence of a medical condition observed in NWI item “business” needs further research to determine if it is a chance finding or sample dependent.
Concerning classic psychometric analysis, the linear PWI and NWI measures displayed absence of floor/ceiling effects, closeness of means and medians, skewness within the standards, and an observed range very close to the theoretical one.
Results indicated that the linear PWI and NWI measures had satisfactory discriminant validity. Convergent validity with most scales was also met, except between the PWI and health-related quality of life. The low-to-moderate correlation between the linear measure PWI and health-related quality of life measures reflects that they are measuring non-overlapping constructs, especially given that the 5-item PWI does not include the item “health”. The correlation between the PWI and the item “satisfaction with life” was within the range reported in other studies (0.31–0.76) (Lau et al., Reference Lau, Cummins and McPherson2005; Smyth et al., Reference Smyth, Nielsen and Zhai2010). The NWI showed a tight relationship with the item “satisfaction with Spain”, as hypothesized.
In addition, the linear measures PWI and NWI were able to discriminate between participant groups. Previous studies had also found significant differences in the PWI by sex, age, education (Davey et al., Reference Davey, Chen and Lau2009; Smyth et al., Reference Smyth, Nielsen and Zhai2010; Tiliouine et al., Reference Tiliouine, Cummins and Davern2006), and NWI by education (Tiliouine et al., Reference Tiliouine, Cummins and Davern2006). Not all differences were in the same direction across studies, probably reflecting sample and cultural particularities.
In conclusion, the 5-item PWI and 5-item NWI offer linear measures, which, given appropriate distributions, allow for use of parametric statistics, calculation of change scores, and structural equation modeling. Internal and external construct validity was verified by Rasch and classic psychometric methods, respectively. Rasch analysis was able to offer unique information about the scale structure (number of items and response scale) and psychometric properties, such as confirmation that the PWI and NWI linear measures were unidimensional, and its items were locally independent and unbiased by sex, age and other variables.
Our results were obtained in a representative sample of community-dwelling older adults residing in Spain and no attempt is made to generalize to other contexts. Further work is necessary to replicate the Rasch results in samples drawn from the general population, including younger adults.
Conflict of interest
None.
Description of authors' roles
M.J. Forjaz designed the study, supervised the statistical analysis and drafted the paper. A. Ayala carried out the statistical analysis, reviewed the paper for important conceptual content and approved the final version. C. Rodriguez-Blazquez and M.-E. Prieto-Flores assisted with writing, reviewed the paper for important conceptual content and approved the final version. P. Martinez-Martin, G. Fernandez-Mayoralas and F. Rojo-Perez helped to design the study, reviewed the paper for important conceptual content and approved the final version.
Acknowledgments
This study was supported by the Spanish Ministry of Science and Innovation (National R+D+i Plan: ref. SEJ2006-15122-C02-00). Maria-Eugenia Prieto-Flores' position is supported by the Juan de la Cierva program for postdoctoral research, of the Spanish Ministry of Science and Innovation. The Carlos III Institute of Health team is a member of the Consortium for Biomedical Research in Neurodegenerative Diseases (Centro de Investigación Biomédica en Red sobre Enfermedades Neurodegenerativas - CIBERNED).
The members of the Spanish Group on Quality of Life and Ageing are M. J. Forjaz, P. Martinez-Martin, M.-E. Prieto-Flores, B. Frades-Payo, C. Rodriguez-Blazquez and C. Delgado-Sanz at the Carlos III Institute of Health; and G. Fernandez-Mayoralas, F. Rojo-Perez, K. Ahmed-Mohamed and R. Lardies-Bosque at the Spanish National Research Council.