Introduction
The sequestration of soil organic carbon (SOC) is closely associated with land use types (LUTs) and management practices affecting organic carbon (OC) inputs (Hobley et al., Reference Hobley, Baldock and Wilson2016; Whitehead et al., Reference Whitehead, Schipper, Pronger, Moinet, Mudge, Pereira, Kirschbaum, McNally, Beare and Camps-Arbestain2018),stabilisation, and decomposition (Bronick and Lal, Reference Bronick and Lal2005; Six et al., Reference Six, Elliott and Paustian2000a). Also, the SOC sequestration in intensively cultivated agro-ecosystems affects plant growth and soil fertility by improving the soil’s physical, chemical, and biological properties (Harden et al., Reference Harden, Hugelius, Ahlström, Blankinship, Bond-Lamberty, Lawrence, Loisel, Malhotra, Jackson and Ogle2018; Voltr et al., Reference Voltr, Mensik, Hlisnikovsky, Hruska, Pokorny and Pospisilova2021), building a good soil structure (Mirchooli et al., Reference Mirchooli, Kiani-Harchegani, Darvishan, Falahatkar and Sadeghi2020), and regulating the nutrient cycling (Fu et al., Reference Fu, Hu, Beare, Thomas, Carrick, Dando, Langer, Müller, Baird and Lilburne2021; Nacinovic et al., Reference Nacinovic, Mahler and de Souza2014). The soils with one of the largest OC reserves in the terrestrial biosphere (Salehi et al., Reference Salehi, Fallah and Sourki2017; Singh et al., Reference Singh, Bardgett, Smith and Reay2010) are also critical for regulating and mitigating the effects of climate change on cultivated agro-ecosystems due to the abilities of soil aggregates to physically retain OC and thereby reduce its decomposition. Increasing SOC amounts in terrestrial ecosystems can improve soil quality (SQ), and the improved SQ can contribute to more OC sequestration in soils simultaneously by reducing carbon (C) emissions (Plaza-Bonilla et al., Reference Plaza-Bonilla, Alvaro-Fuentes and Cantero-Martinez2014).
SOC, which is usually used as a crucial indicator of SQ, comprises various fractions with different turnover times due to the diverse compositions of organic residues incorporated into the soil under different LUTs (Mi et al., Reference Mi, Sun, Zhao and Wu2019). Quantifying SOC fractions, classified into labile and recalcitrant (stable) fractions, provides important insights regarding SOC fluxes in agricultural ecosystems as well as changes in land management practices and soil degradation (Diekow et al., Reference Diekow, Mielniczuk, Knicker, Bayer, Dick and Kögel-Knabner2005; Kumar et al., Reference Kumar, Bhardwaj, Thakur, Sharma and Sharma2024; Singh and Benbi, Reference Sing and Benbi2018). The labile SOCLC fraction is easily affected by changes stemming from agricultural management practices such as nutrient management, residue management, tillage practices, and land use (Benbi et al., Reference Benbi, Brar, Toor, Singh and Singh2012; Prakash et al., Reference Prakash, Benbi and Saroa2016; Sharma et al., Reference Sharma, Singh and Kumar2020). The SOCLC fraction is commonly used as an early indicator of changes in SOC (Abdelrahman et al., Reference Abdelrahman, Olk, Dinnes, Ventrella, Miano and Cocozza2016). On the other hand, the recalcitrant SOCRC fraction constitutes a larger proportion of the SOC. It is less affected by soil management practices due to its lower turnover rates (Rakesh et al., Reference Rakesh, Sarkar, Sinha, Danish, Bhattacharya, Mukhopadhyay, Salmen, Ansari and Datta2021). The SOCRC fraction plays an important role in determining long-term OC sequestration because it contains compounds that are highly resistant to biodegradation, such as lignin (Ding et al., Reference Ding, Han, Liang, Qiao, Li and Li2012; Rovira and Vallejo, Reference Rovira and Vallejo2002). Therefore, assessing the effects of different LUTs and soil depths on SOCLC and SOCRC fractions in agricultural ecosystems with intensive crop production can provide valuable insights into a better understanding of the role of land uses on OC sequestration due to the changing effects on the physical, chemical, and biological properties of soils (Barreto et al., Reference Barreto, Gama-Rodrigues and Gama-Rodrigues2011; Yu et al., Reference Yu, Han, Li and Zhou2017).
The soil structure refers to the arrangement of soil particles into aggregates, and soils with a well-aggregated structure possess physical properties that support sustainable plant production (Niewczas and Witkowska-Walczak, Reference Niewczas and Witkowska-Walczak2005). Soil aggregation, which defines the process of forming a stable soil structure, is formed by achieving flocculation and cementation using different binding agents, such as colloidal organic matter (OM), clay, and CaO3 (Lal and Shukla, Reference Lal and Shukla2004). Due to its effects on the movement and storage of water and aeration capacity, it plays a critical role in plant growth, particularly during germination and seedling emergence. Also, soil aggregates and their associated soil structure critically impact diverse ecosystem functions of soils, such as biomass production and OC storage, storage and recycling of nutrients, diversity of biological activity, and physical stability and support (Rabot et al., Reference Rabot, Wiesmeier, Schluter and Vogel2018). Soil aggregates generate important indirect effects on many soil properties such as soil strength, OC sequestration, mechanical resistance to plant root elongation and growth, erosion, surface crusting, infiltration, water holding capacity, aeration, and bulk density (ρb) (Murphy, Reference Murphy2014; Nimmo, Reference Nimmo2013). They also directly or indirectly affect the direction and intensity of SOC transformation due to both their physical protection of SOC (Ramesh et al., Reference Ramesh, Bolan, Kirkham, Wijesekara, Kanchikerimath, Rao, Sandeep, Rinklebe, Ok and Choudhury2019) and their regulation of physicochemical and biochemical processes that affect the SOC decomposition (Bai et al., Reference Bai, Zhou and He2020; Jin et al., Reference Jin, Shah, Zhang, Liu, Peng and Nie2020).
Soil aggregates are generally divided into different parts depending on the size of aggregates: very large macro-aggregate (MacAgVL, 8.00–4.75 mm), large macro-aggregate (MacAgL, 4.75–2.00 mm), small macro-aggregate (MacAgS, 2.00 mm–250 μm), micro-aggregate (MicAg, 250–53 μm), and free clay +silt (ParticlesC-Si, < 53 μm) (Six et al., Reference Six, Bossuyt, Degryze and Denef2004). While MicAg (0.25–0.053 mm) is formed and stabilised mainly through chemical factors (Nichols and Toro, Reference Nichols and Toro2011; Six et al., Reference Six, Bossuyt, Degryze and Denef2004), macro-aggregate (MacAg, >250 μm) is formed and stabilised by microbial synthesis and biological factors, such as root and fungal hyphae (Lado et al., Reference Lado, Paz and Ben-Hur2004; Nichols and Toro, Reference Nichols and Toro2011). MicAg (250–53 μm) is primarily responsible for SOC storage because of its stabilisation by persistent binders, whereas MacAg (>250 μm) is stabilised by the transient organic binding agents (Colazo and Buschiazzo, Reference Colazo and Buschiazzo2010; Man et al., Reference Man, Shi, Yu and Zhang2015). SOC associated with MacAg (>250 μm) is highly sensitive to soil disturbance or agricultural practices (Kan et al., Reference Kan, Ma, Liu, Liu, Virk, Qi, Zhao, Lal and Zhang2020). Some previous studies recommended that the stability of soil aggregates can be considered a simple alternative feature for soil organic matter (SOM) turnover, soil erodibility, soil hydrological processes, biochemical activities, and the flexibility of the soil to drought, along with a pointer to the environment’s sustainability (Ayoubi et al., Reference Ayoubi, Mirbagheri and Mosaddeghi2020; Mekuria and Aynekulu, Reference Mekuria and Aynekulu2013).
The fractionation of SOC at different aggregate and/or particle sizes is widely used to identify the C fractions dominating total SOC change and explore SOC stabilisation mechanisms with LUT changes and management practices (Poeplau et al., Reference Poeplau, Don, Six, Kaiser, Benbi, Chenu, Cotrufo, Derrien, Gioacchini and Grand2018; Six and Paustian, Reference Six and Paustian2014). At different aggregate sizes, OC content in MacAg (>250 μm) is the primary contributor to overall OC gain or loss with LUT changes (Del Galdo et al., Reference Del Galdo, Six, Peressotti and Cotrufo2003; Jastrow, Reference Jastrow1996; Wei et al., Reference Wei, Shao, Gale, Zhang and Li2013). The stability of soil aggregates responds rapidly to LUT changes, and their formation or destruction regulates SQ (Nie et al., Reference Nie, Pendall, Bell and Wallenstein2014). In addition, soil aggregation is a key process facilitating the retention and preservation of SOC (Mustafa et al., Reference Mustafa, Minggang, Ali Shah, Abrar, Nan, Baoren, Zejiang, Saeed, Naveed, Mehmood and Nunez-Delgado2020; Six et al., Reference Six, Elliott and Paustian2000a; Xiao et al., Reference Xiao, Zhang, Hu, Xiao, Yang, Ye and Wang2021). Modak et al., (Reference Modak, Ghosh, Bhattacharyya, Biswas, Das, Das and Singh2019) stated that land and soil degradation disrupts the structure of aggregates and accelerates OC loss. On the other hand, conservative LUTs, such as forests and grasslands, can enhance soil aggregate stability and improve SOC sequestration by protecting of soil aggregates (Saha et al., Reference Saha, Kukal and Sharma2011; Xiao et al., Reference Xiao, Zhang, Hu, Xiao, Yang, Ye and Wang2021).
The amounts of SOCStocks are highly dynamic. They can change dramatically depending on various factors, including LUTs, management practices, location, topography, climate, soil type, soil depth, clay content, mineralogical composition, soil biota, and plant root properties, as well as the interactions between these factors (Gachhadar et al., Reference Gachhadar, Baniya and Mandal2022; Li et al., Reference Li, Liu, Dong, Chang, Nie, Liu, Xiao, Lu and Zeng2017; Muñoz-Rojas et al., Reference Muñoz-Rojas, Abd-Elmabod, Zavala, De la Rosa and Jordán2017). LUTs influence the storage of SOCStocks, affecting the amounts of soil aggregate fractions, with crucial implications for ecosystem functioning and sustainable C management. In general, LUTs and management practices that increase OC inputs from plant production or reduce OC losses from decomposition are reported to improve soil aggregation and sequester SOC in MacAg (250–53 μm) or ParticleC-Si (<53 μm) (DeGryze et al., Reference DeGryze, Six, Paustian, Morris, Paul and Merckx2004; Fulton-Smith and Cotrufo, Reference Fulton-Smith and Cotrufo2019). However, the effects of LUTs and management practices on the SOC stored in these key fractions often differ between soil types. For example, crop residue addition or no-tillage (NT) has been reported to increase OC sequestration in MacAg (>250 μm) or ParticleC-Si (<53 μm) fractions to a greater extent in coarser-textured soils (Chivenge et al., Reference Chivenge, Murwira, Giller, Mapfumo and Six2007; Denef et al., Reference Denef, Six, Merckx and Paustian2004). The valuable information about the accumulation of SOC and its storage capability can be gained by the determining of SOC fractions among the different LUTs (Six et al., Reference Six, Conant and Paul2002a). Therefore, in areas where soil cultivation is intensively carried out, conserving SOC and its fractions is crucial for maintaining soil fertility and SQ. Tillage practices (Abdollahi and Munkholm, Reference Abdollahi and Munkholm2014; Schjønning et al., Reference Schjønning, Jensen, Bruun, Jensen, Christensen, Munkholm, Oelofse, Baby and Knudsen2018) and the gradual decrease of SOC in arable soils (Heikkinen et al., Reference Heikkinen, Ketoja, Nuutinen and Regina2013) lead to a decrease in both the number and stability of MacAg (>250 μm). The distribution and stability of soil aggregates, essential factors of soil physical quality (SPQ), are affected by LUTs and soil management practices (Barthes and Roose, Reference Barthes and Roose2002; Boix-Fayos et al., Reference Boix-Fayos, Calvo-Cases, Imeson and Soriano-Soto2001; Herrick et al., Reference Herrick, Whitford, de Soyza, Van Zee, Havstad, Seybold and Walton2001). The effects of different management practices on the composition of SOC fractions and SOCStocks provide practical knowledge of C sequestration mechanisms (Six et al., Reference Six, Feller, Denef, Ogle, Moraes and Albrecht2002b). It is undeniable that the total amounts of SOC and the distributions of OC in physical fractions are influenced by LUTs and tillage practices. Understanding SOC and SOCStocks amounts associated with aggregate-sized fractions gives valuable information for evaluating and assessing the effects of LUTs on OC sequestration, pools, and soil aggregate stability. Also, these processes related to aggregate size fractions reveal vital information significantly and directly about how the formation of soil aggregates is influenced by relevant management practices, such as crop rotation, fertilisation, tillage, and irrigation frequency (Ashagrie et al., Reference Ashagrie, Zech, Guggenberger and Mamo2007; Ogle et al., Reference Ogle, Breidt and Paustian2005; Zhao et al., Reference Zhao, Chen, Hu and Li2017).
In this study, we aimed to identify LUTs that are resilient to the effects of climate change in an alluvial plain, which was formed on sediments carried by the Yeşilırmak River in Turkey, where humid climate conditions, as classified by the Thornthwaite climate classification (Turan et al., Reference Turan, Dengiz and Demirağ Turan2018), are effective. This study used aggregate size fractionation to reveal the potential differential effects of management practices on SOC dynamics and SOCStocks in agricultural fields under long-term different LUTs, such as pasture, forage crops, maize, soybean, kiwifruit, and cherry laurel. Considering the physical barrier impacts of soil aggregates on SOC, the main objectives were (a) to determine which LUTs have the highest effects on SOC dynamics and SOCStocks, (b) to reveal aggregate size fractions given the highest contributions to SOC contents and SOCStocks, and (c) to investigate how long-term LUTs affect SOCLC and SOCRC fractions. By providing information on the underlying mechanisms, it aimed to determine land uses and management practices that will increase SOC sequestration and mitigate the effects of climate change on agricultural fields under humid climate conditions.
Materials and methods
Site description and management histories regarding land use types
The research was carried out at the Ambarköprü Research Station of the Black Sea Agricultural Research Institute in Samsun, Turkey (41°13′09″ N- 36°40′03″ E; 17 m above sea level). The Ambarköprü Research Station is situated in the Çarşamba Alluvial Deltaic Plain, one of the most significant agricultural plains in the region and the country, which was formed from sediments carried by the Yeşilırmak River. The plain is situated in a humid climate, as classified by the Thornthwaite climate classification (Turan et al., Reference Turan, Dengiz and Demirağ Turan2018), with an average annual precipitation of 921.6 mm and an average annual temperature of 14.3°C.
Since the fields at the Ambarköprü Research Station have similar climate (temperature and precipitation), topography (slope), and geomorphological (parent material) characteristics, six different long-term LUTs, such as pasture, forage crops, soybean, maize, kiwifruit, and cherry laurel, were selected in the present study. The plots of these LUTs are not experimental fields but consist of different actual LUTs maintained at the Research Station for many years. Therefore, it was impossible to create the replicated plots for different LUTs in the study area; consequently, the study was conducted as a case study. During the soil sampling conducted for each LUT, three different subplots, each 10 m x 10 m, were created, approximately 20 m apart from one another. Disturbed and undisturbed soil samples were collected from these subplots, which were considered pseudo-replications. The mean values in the study were given as the averages of the pseudo-replicated data obtained from these subplots. However, during the statistical analyses, these data were analysed as if they were real data. The rationale for this decision is provided in the data analysis section.
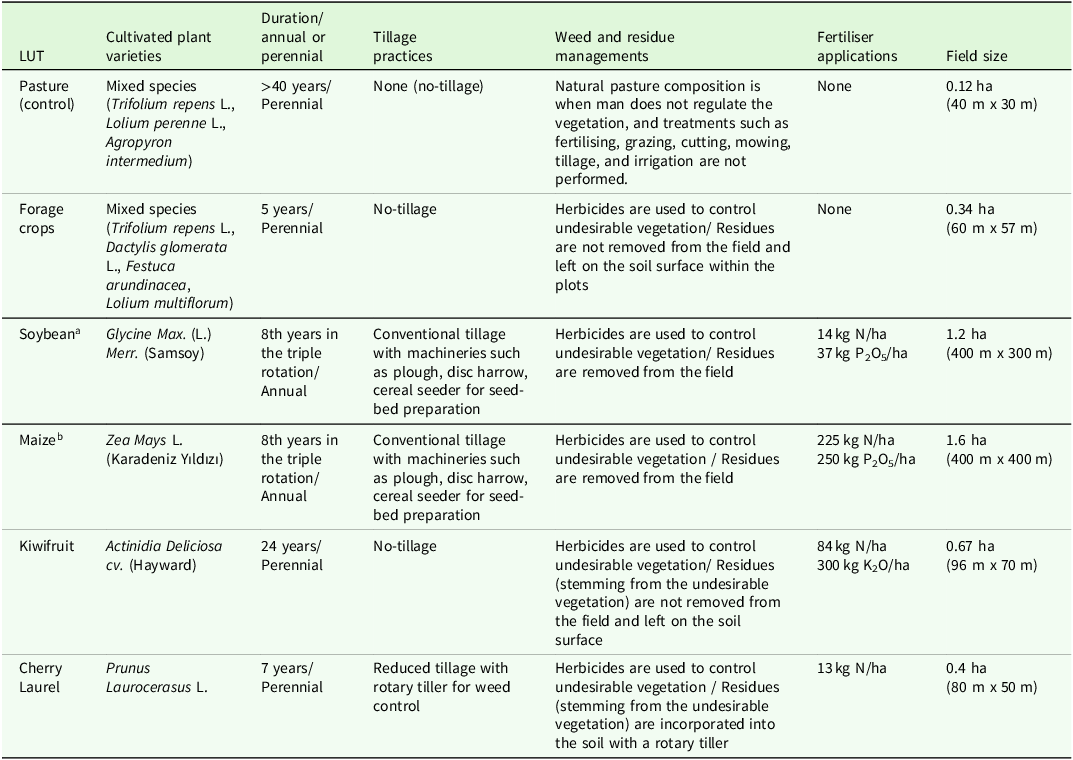
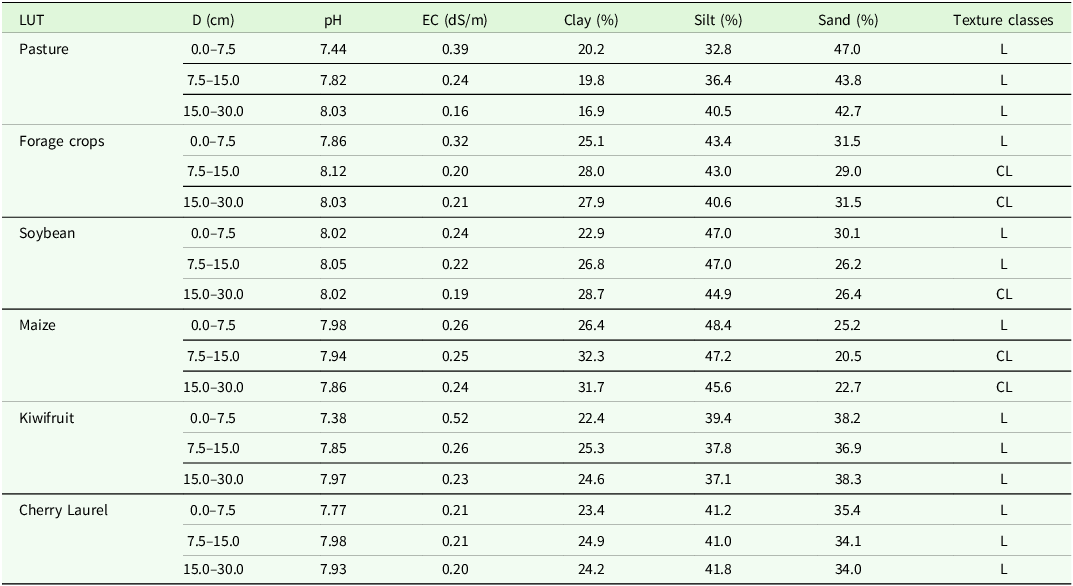
The management history of the selected LUTs at the Ambarköprü Research Station is given in Table 1, and the results concerning some soil properties for each LUT are also presented in Table 2. Additionally, in this study, the establishment times of the plots belonging to LUTs, whose management history information is provided in Table 1, vary.
The history of management practices conducted on different land use types

LUT: Land use types.
a On the plot in the soybean-maize-bean rotation during the sampling period, soybean was being grown.
b On the plot in the soybean-maize-bean rotation during the sampling period, maize was being grown.
Some morphological properties of the soils in the study area

D: Soil depths; EC: Electrical conductivity; L: Loam; CL: Clay Loam.
While the fruits and crops grown in the study area are generally categorised into annual and perennial varieties, the tillage methods employed in agricultural production processes are classified into NT, reduced tillage (RT), and conventional tillage (CT). Weed control includes using herbicides, cutting tools, leaving them in the field, or mixing them into the soil with a rotavator. Fertilisers are also applied individually for each plant (Table 1). All these management practices performed in the study area are believed to influence SOC sequestration and aggregate formation.
In addition to these, the soil reaction (pH) and electrical conductivity (EC) measurements of the soils differed from 7.38 to 8.12 and from 0.16 to 0.52 dS/m, respectively. The soil reactions ranged from slightly alkaline to moderately alkaline, whereas the soil salinity was categorised as non-saline for soils with varying clay levels. Although the textural classes of the soils were determined to be loam (L) at the surface depth (0.0–7.5 cm), they changed from L to clay loam (CL) at the subsurface depth (7.5–15.0 and 15.0–30.0 cm) (Table 2).
Soil sampling and processing
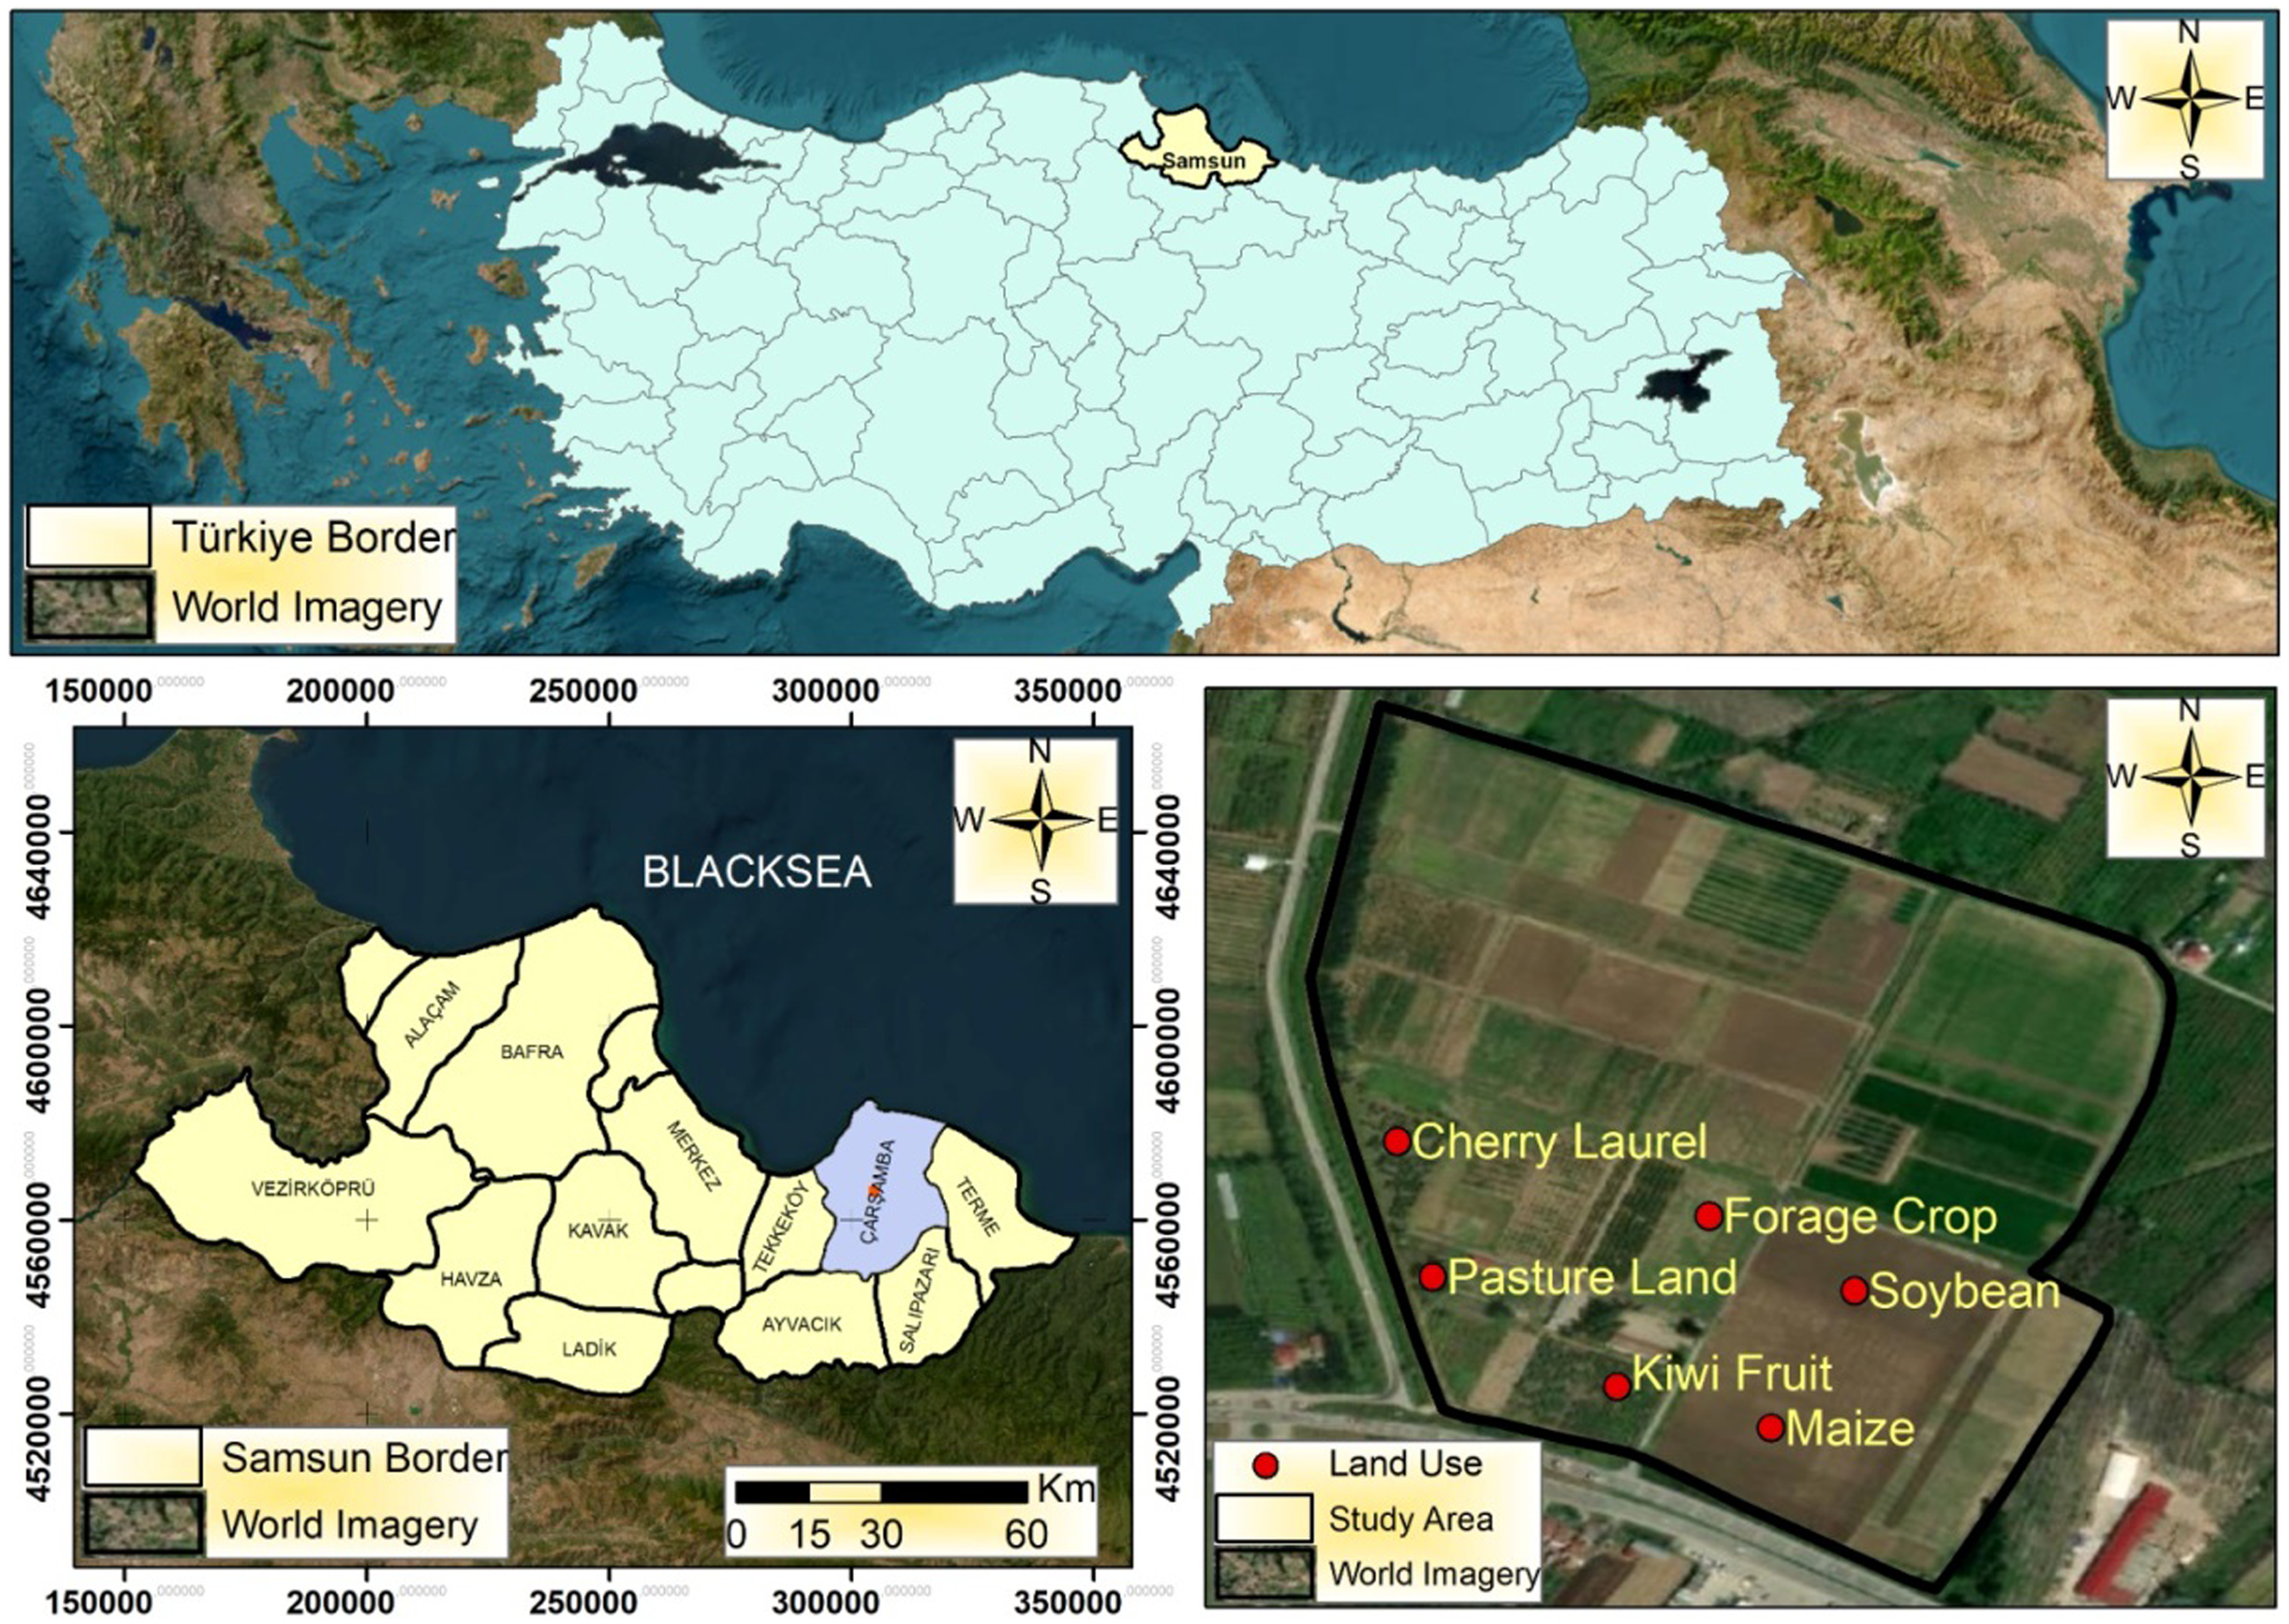
In September 2020, soil samples were randomly collected from three subplots created with areas of 10 × 10 m at fields with different LUTs, such as pasture, forage crops, soybean, maize, kiwifruit, and cherry laurel. During the soil samplings, disturbed and undisturbed samples were collected as three replicates from different soil depths (0.0–7.5 cm, 7.5–15.0 cm, and 15.0–30.0 cm) (Figure 1). Also, the disturbed soil samples were collected using a soil auger (8 cm diameter) after the crop residues were removed from the soil surface, and the undisturbed soil samples were taken using stainless steel cylinders of 5 cm in diameter and 5 cm in height.
The map concerning various land use systems in the study area.

The distributed soil samples, containing moisture content under field conditions, were transported to the laboratory in plastic containers and then divided into two parts. The first part of these samples was sieved through an 8.0 mm sieve to separate the soil aggregates by removing visible plant material and stones. Before sieving soil aggregates, the large clumps were carefully broken by hand along the natural fracture surfaces. Then, they were sieved and air-dried as fresh soil aggregate samples under laboratory conditions. The second part of the distributed soil sample was air-dried again in the laboratory and then sieved through a 2 mm sieve to analyse its physical and chemical properties.
Soil analysis
Soil texture was determined with a hydrometer after dispersing soil particles with sodium hexametaphosphate (Gee and Bauder, Reference Gee, Bauder and Klute1986). pH was determined using a pH metre with a glass electrode in a soil-water suspension of 1:2.5 (Hendershot et al., Reference Hendershot, Lalande, Duquette, Carter and Gregorich2008). EC was determined using an EC metre in a 1:2.5 soil-water suspension (Rhoades, Reference Rhoades and Klute1986). The ρb values were determined by cylindrical, undisturbed soil samples dried to a constant weight at 105°C (Grossman and Reinsch, Reference Grossman, Reinsch and Dick2002). SOC content was determined using the modified Walkley-Black titration method, which depends on the oxidation of OM in a mixture of potassium dichromate (K2Cr2O7) and sulphuric acid (H2SO4) (Walkley and Black, Reference Walkley and Black1934). In addition, the change in SOCStocks under different LUTs was determined with the following equation:
 $$\matrix{{SO{C_{Stocks - soil}}(Mg/ha) = } \hfill & {O{C_{soil}}(g/kg) \times BD(g/c{m^3})} \hfill \cr
\, \hfill & {\times Depth(m) \times 10} \hfill \cr} $$
The content of POx-C was measured using the method by Culman et al. (Reference Culman, Snapp, Freeman, Schipanski, Beniston, Lal, Drinkwater, Franzluebbers, Glover, Grandy, Lee, Six, Maul, Mirksy, Spargo and Wander2012). Using Equation (2), the POx-C amounts were calculated from the absorbance values.
 \begin{align} {POx{-}C} ({mg/kg\,\,soil}) = & \left[ 0.020 \, {mol/L} - (a + b \times {Abs}) \right] \\&\times (9000 \, {mg \,C/mol}) \times \left( {0.02 \, L/W_t} \right) \end{align}
where POx-C is the permanganate oxidisable C content; the solution has an initial concentration of 0.020 mol/L; a gives the intercept of the standard curve; b is the slope of the standard curve; Abs is the absorbance of the unknown solution; 9000 is the amount of C oxidised by 1 mol of MnO4 as it passes from Mn+7 to Mn+4; 0.02 L is the volume of the reacted stock solution; and Wt is the weight in kg of the air-dried soil sample in kg.
Soil aggregates fractionation
The aggregate size distribution was determined using the dry-sieving method (Sarkhot et al., Reference Sarkhot, Comerford, Jokela and Reeves2007). The method was characterised as an easy, rapid, and effective technique for separating different sizes of aggregates from soils, as the wet sieving method may result in the loss of water-soluble C (Ciric et al., Reference Ciric, Manojlovic, Nesic and Belic2012; Hu et al., Reference Hu, Chen and Zhu2020; Littrell et al., Reference Littrell, Xu, Omondi, Saha, Lee and Jagadamma2021). Air-dried soil aggregate samples of 100 g located on a group of sieves with diameters of 8.00, 4.75, 2.00, 0.25, and 0.053 mm were sieved for 5 minutes using a vibrating sieve shaker set to a shaking amplitude of 3 mm. The soil aggregates retained on each sieve were collected, weighed, and then fractionated into five size classes: MacAgVL (8.00–4.75 mm), MacAgL (4.75–2.00 mm), MacAgS (2.00–0.25 mm), MicAg (0.25–0.053 mm), and ParticleC-Si (<0.053 mm). The stability index of the aggregates, also known as the mean weight diameter (MWD), was calculated using the formula suggested by Haynes and Swift (Reference Haynes and Swift1990).
 $$MWD(mm) = \sum\limits_{i = 1}^n {\overline {{x_i}} {w_i}} $$
where MWD is the mean weight diameter,
 $\overline{x_{i}}$
is the mean diameter (mm) of the ith aggregate size class, wi is the proportion of total sample mass in the corresponding size fraction, and n is the number of aggregate size fractions.
The SOC content for every aggregate size class and SOC fractions (pools) were determined using the modified Walkley-Black titration method. The relative contributions of the OC amount in each aggregate size to the SOC content in the study area and the SOCStocks associated with the aggregates for each aggregate size class were calculated using Equations (4) and (5), respectively.
 $SO{C_{{{Contribution - aggregate}}\;{{size}}}}(g/kg) = {{O{C_{{{aggregate}}\;{{size}}}}(g/kg) \times {w_i}(\% )} \over {SO{C_{{{Bulk}}\;{{soil}}}}(g/kg)}}$
 $\begin{align}SO{C_{{{Stocks - aggregate}}\;{{size}}}}{\mkern 1mu} (Mg/kg) = & O{C_{{{Aggregate}}\;{{size}}}}{\mkern 1mu} (g/kg) \\&\times BD{\mkern 1mu} (g/c{m^3}) \times {\rm{Depth}}{\mkern 1mu} (m) \times 10\end{align}$
The SOC fractions were determined using different amounts (2.5, 5.0, 10.0, and 20.0 mL) of concentrated H2SO4 with a constant amount (10 mL) of 0.4 mol/L K2Cr2O7 (Chan et al., Reference Chan, Bowman and Oates2001). Then, the SOC pools determined with the decreasing oxidizability were separated into the following four fractions:
-
a) Very labile OCVL: OC oxidisable below a concentration of 3.0 mol/L H2SO4;
-
b) Labile OCL: the difference between the amounts of OC oxidisable at the concentrations of 3.0 mol/L H2SO4 and 6.0 mol/L H2SO4;
-
c) Less labile OCLL: the difference between the amounts of OC oxidisable at the concentrations of 6.0 mol/L H2SO4 and 9.0 mol/L H2SO4;
-
d) Non-labile OCNL: the difference between the amounts of OC oxidisable at the concentrations of 9.0 mol/L H2SO4 and 12.0 mol/L H2SO4.
Additionally, the OCVL and OCL fractions together constituted the SOCLC fraction, and the OCLL and OCNL fractions together constituted the SOCRC fraction (Chan et al., Reference Chan, Bowman and Oates2001).
Water-stable aggregates (WSA) were evaluated using air-dried aggregates of 1–2 mm in size. The 5 g soil sample was placed on a 250 µm sieve and sieved 30 times per minute for 5 minutes using distilled water (Kemper and Rosenau, Reference Kemper, Rosenau and Klute1986). The stable aggregates remaining on the sieve were collected on a plate, dried in the oven, and weighed as stable aggregates plus an amount of sand. The stable aggregates with sand particles were dispersed with sodium hexametaphosphate solution to determine the amount of sand. Then, the sand fraction was separated from the stable aggregates by washing with distilled water. The calculation of the percentage of WSA (%) was determined by Equation (6).
 $WSA(\% ) = {{({{Stable}}\;{{aggregates - Sand}})} \over {({{Total}}\;{{soil}}\;{{sample - Sand}})}} \times 100$
Data analysis
The statistical analyses of the data obtained in the study were conducted using a completely randomised design. The current study was planned as a case study because the different LUTs whose effects were examined were established at different times, and the replicated plots for the LUTs could not be created. Three pseudo-replications were created during soil samplings performed in the generated subplots for each LUT. Due to the pseudo-replicated sampling method used in the study, it is acknowledged that bias may have occurred in our data, and it is essential to interpret the obtained results carefully.
The plots, where soil samplings were carried out, are located close to each other in the fields of the Ambarköprü Research Station of the Black Sea Agricultural Research Institute (Figure 1). Consequently, the soils in these plots are under the influence of a similar climate, topography, and geomorphological characteristics. Hence, the differences in soil properties analysed in plots close to each other are likely due to the long-term differences in the LUT evaluated in the study. Also, the variations in some soil properties (pH, EC, clay, silt, and sand) with soil depths under different LUTs, as shown in Table 1, indicate that the evaluated other soil properties in the study can also vary with soil depth due to the effects of various soil management methods (NT, RT, CT, irrigation, fertilisation, etc.) performed under different LUTs. For these reasons, different LUTs and soil depths were used as sources of variability during statistical analyses.
IBM SPSS Statistics 21.0 software (IBM Corporation, Armonk, USA) was used to perform a two-way analysis of variance (ANOVA) to determine the effect of different LUTs and soil depths on all the examined soil properties. The data set’s normality and homogeneity (p < 0.05) for variance analysis were checked using the skewness and kurtosis coefficients, as well as the Kolmogorov–Smirnov and Levene’s tests, respectively. Transformations such as the square root and logarithm were applied if the data set did not fit a normal distribution, and these transformed data were then back-transformed before being used in the tables and figures. In addition, the LSD test (least significant difference) was used to assess the differences between treatments (LUTs and soil depths) at a significance level of p ≤ 0.05.
Results
The results obtained in the study were evaluated by considering the significant main and interaction effects determined through two-way ANOVA. For soil properties where interaction effects were found to be significant, the results related to the main effects were not evaluated in the article.
The change of ρb, SOC, SOCStock, and POx-C under different land use types and soil depths
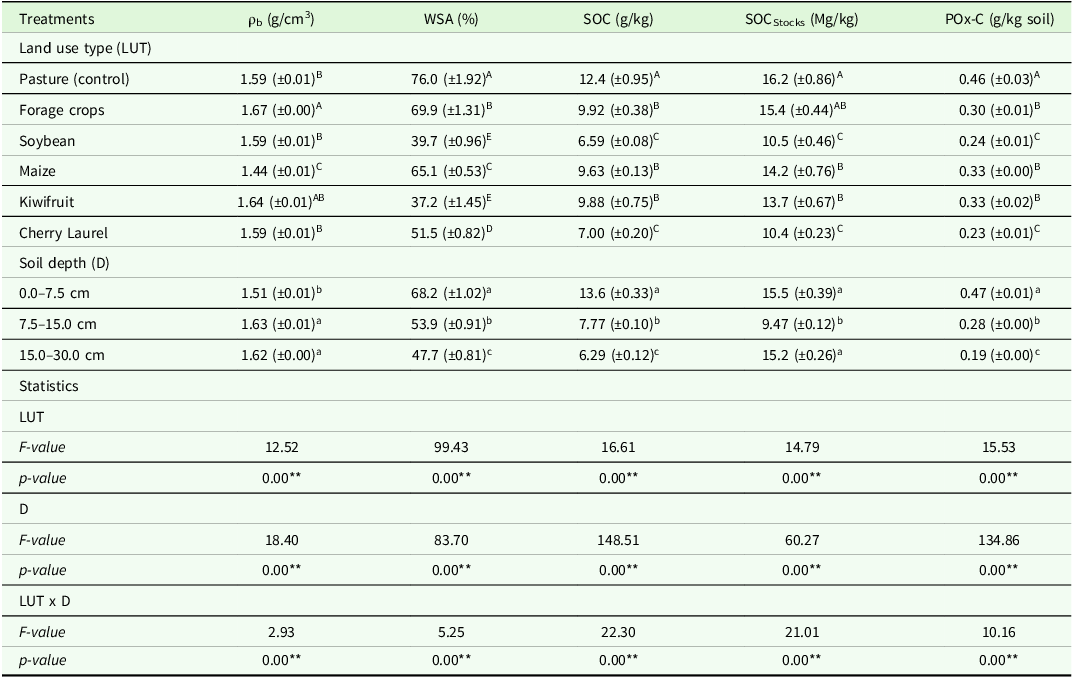
The variability of ρb, WSA, SOC, SOCStocks, and POx-C was significantly affected (p < 0.01) by different LUTs, soil depths, and the LUT × soil depth (D) interaction (Table 3).
The effects of different land use types and soil depths on bulk density, water stable aggregates, soil organic carbon, soil organic carbon stocks, and permanganate oxidisable carbon

LUT: land use type; D: soil depth; MacAgVL: very large macroaggregates; MacAgL: large macroaggregates; MacAgS: small macroaggregates; MicAg: microaggregates; ParticlesC-Si: small particles with clay and silt-size.
Means (±standard deviation) followed by different uppercase and lowercase letters within the same column significantly differ under land use types and soil depths, respectively, at p ≤ 0.05. **: indicates significance at the p < 0.01 level of probability.
The highest and lowest ρb values on the LUT × D interaction varied as 1.72 g/cm3 on the interaction of kiwifruit land use and the 15.0–30.0 cm soil depth and as 1.31 g/cm3 on the interaction of maize land use and the 0.0–7.5 cm soil depth, respectively. While the ρb values increased with increasing soil depths in the kiwifruit LUT, where NT management has been practiced for many years, it was determined that the ρb values decreased statistically significantly (p < 0.01), particularly in the surface soil depth (0.0–7.5 cm), in the maize land use, where CT managements were performed.
The ρb values in the soils under LUTs, where CT and RT managements were carried out, were measured as lower values at the surface soil depth (0.0–7.5 cm). Generally, ρb had higher values in LUTs, where NT management was carried out, and it often had higher values in subsurface layers (7.5–15.0 cm and 15.0–30.0 cm soil depths) than in the surface layer (0.0–7.5 cm) in all the LUTs examined.
The amounts of WSA for soils in the study area ranged significantly (p < 0.01) from 96.0 to 27.1 % with the LUT × D interaction. The highest and lowest amounts of WSA were determined under the interaction of maize land use and the 0.0–7.5 cm soil depth, and the interaction of kiwifruit land use and the 15.0–30.0 cm soil depth, respectively. It was found that the LUT × D interaction had significant statistical effects in the studied areas on the WSA amounts, and that lower amounts were generally observed for soils under soybean and kiwifruit land uses in the subsurface soil layers (7.5–15.0 and 15.0–30.0 cm depths).
The SOC and SOCStocks concentrations in the study area changed significantly (p < 0.01) due to the effects of the LUT × D interaction (Table 3). The LUT × D interaction affected the variability of the highest SOC and SOCStocks concentrations similarly, and the highest SOC and SOCStocks concentrations in soils were measured under the interaction of pasture land use and the 0.0–7.5 cm soil depth. Due to the lower disturbance, the average SOC and SOCStocks concentrations in soils with pasture land use, accepted as the control, were significantly (p < 0.01) higher than the average of the other LUTs. The average results obtained in soils under pasture land use were higher, up to 87% compared to soils with soybean land use for SOC, and up to 56% compared to soils with cherry laurel land use for SOCStocks. Also, the results obtained concerning the interaction of pasture land use and the 0.0–7.5 cm soil depth can be attributed to the increased deposits of SOM in the pasture land use (natural vegetation) with the long-term NT practice.
Contrary to NT practice performed in soils with pasture land use, CT and RT practices, where soils under the soybean and cherry laurel land uses were carried out, caused the breakdown of soil structure, resulting in lower SOCStocks concentrations in the 0.0–7.5 and 7.5–15.0 cm soil depths. Additionally, the lowest SOCStocks concentrations were observed in the interaction between soybean land use and the 7.5–15.0 cm soil depth. On the other hand, the average SOCStocks concentrations compared to the 0–0–7.5 and 7.5–15.0 cm soil depths decreased with increasing soil depth; those in the 15.0–30.0 cm soil depth were found to be similar to those in the 0.0–7.5 cm soil depth. These results are related to the fact that the value used in the calculations for the 15.0–30.0 cm soil depth was twice the value of the other depths (0.0–7.5 and 7.5–15.0 cm) (Equation 1).
The LUT × D interaction was found to have different statistical effects on the POx-C content, also known as active C (Cactive) (Table 3). The highest POx-C content (0.83 g/kg soil) was measured in soils under the interaction of pasture land use and the 0.0–7.5 cm soil depth. While the variability of POx-C content tended to decrease with increased soil depths, the lowest POx-C content (0.13 g/kg soil) was found in soils under the interaction of cherry laurel land use and the 15.0–30.0 cm soil depth.
The changes of aggregate size distributions and organic carbon contents associated with soil aggregates under different land use types
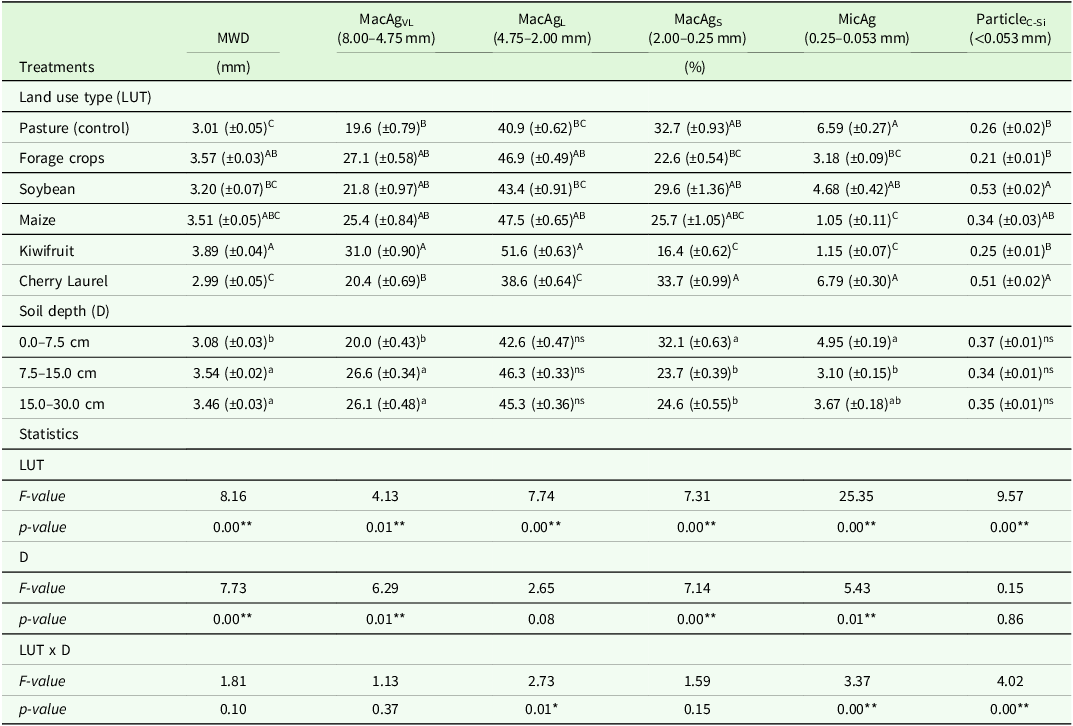
While the highest MWD value was determined in soils with kiwifruit land use, the lowest MWD values were measured in soils with pasture and cherry laurel land uses. The results showed that almost all LUTs had different effects on MWD, similar to those observed for the studied aggregate fractions. Additionally, the impact of maize land use on MWD was statistically similar to that of all the other LUTs (p < 0.01; Table 4).
The effects of different land use types and soil depths on soil aggregate size distributions

LUT: land use type; D: soil depth; MacAgVL: very large macroaggregates; MacAgL: large macroaggregates; MacAgS: small macroaggregates; MicAg: microaggregates; ParticlesC-Si: small particles with clay and silt-size. Means (±standard deviation) followed by different uppercase and lowercase letters within the same column significantly differ under land use types and soil depths, respectively, at p ≤ 0.05. *: indicates significance at the p < 0.05 level of probability. **: indicates significance at the p < 0.01 level of probability.
When the effects of LUTs, soil depths, and LUT × D interaction on MacAgVL (8.00–4.75 mm), MacAgL (4.75–2.00 mm), MacAgS (2.00–0.25 mm), MicAg (0.25–0.053 mm), and ParticleC-Si (<0.053 mm) fractions were evaluated separately, it was found that LUTs and soil depths significantly affected the variability of MacAgVL (8.00–4.75 mm) and MacAgS (2.00–0.25 mm) fractions (p < 0.01; Table 4) and that LUT × D interaction had also significant effects on the variability of MacAgL (4.75–2.00 mm,) MicAg (0.25–0.053 mm), and ParticleC-Si (<0.053 mm) fractions. The highest values for the MacAgVL (8.00–4.75 mm) and MacAgS (2.00–0.25 mm) fractions were measured as 31.0 and 33.7 %, respectively, in soils with kiwifruit and cherry laurel land uses. It was also observed that forage crops, soybean, and maize land uses did not reveal any statistical effect on the variability of MacAgVL (8.00–4.75 mm) fraction (Table 3). On the other hand, when taking into account the effects of LUT × D interaction, the highest values were determined in the same LUT × D interaction for the MicAg (0.25–0.053 mm) and ParticleC-Si (<0.053 mm) fractions, unlike the MacAgL (4.75–2.00 mm) fraction. The highest values for the MicAg (0.25–0.053 mm) and ParticleC-Si (<0.053 mm) fractions were measured as 9.31% and 0.69%, respectively, in the interaction of soybean land use and the 0.0–7.5 cm soil depth, but the lowest values for those were found in the interaction of the kiwifruit land use and the 0.0–7.5 cm soil depth and in the interaction of maize land use and the 15.0–30.0 cm soil depth, respectively. On the other hand, the highest and lowest values for the MacAgL (4.75–2.00 mm) fraction were measured as 56.8% in the interactions of kiwifruit land use and the 0.0–7.5 cm soil depth, and as 34.0% in the interactions of soybean land use and the 0.0–7.5 cm soil depth, respectively.
MWD, MacAgVL (8.00–4.75 mm), and MacAgS (2.00–0.25 mm) fractions changed significantly (p < 0.01) with the effects of soil depths (Table 4). The average values of MWD and MacAgVL (8.00–4.75 mm), fraction also increased with increasing soil depths (7.5–15.0 and 15.0–30.0 cm). In contrast, the average values of the MacAgS (2.00–0.25 mm) fraction significantly decreased at the same soil depths (p < 0.01; Table 4).
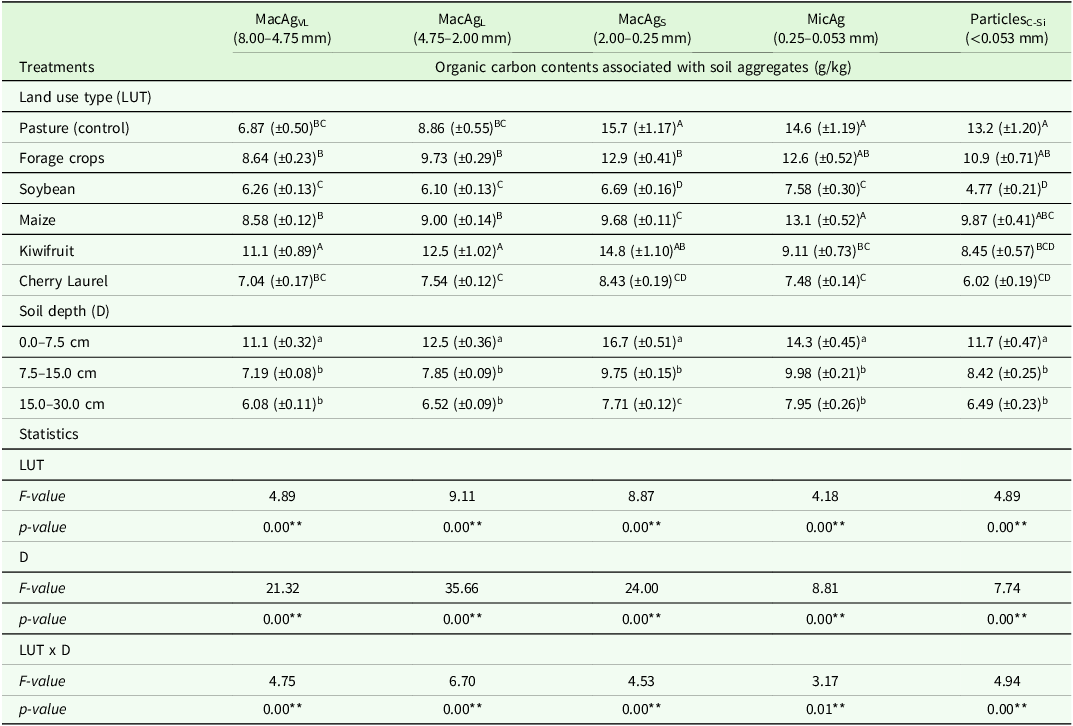
LUTs, soil depths, and the LUT × D interaction statistically affected OC contents associated with soil aggregate fractions (p < 0.01; Table 5), but both soil depths and the LUT × D interaction had no significant statistical effects in terms of the contribution of soil aggregates to OC content for some soil aggregate fractions (Table 6). While the interaction of kiwifruit land use and the 0.0–7.5 cm soil depth revealed the highest effect on OC contents associated with MacAgVL (8.00–4.75 mm) and MacAgL (4.75–2.00 mm) fractions, the highest statistical effects on those associated with other aggregate fractions (MacAgS (2.00–0.25 mm), MicAg (0.25–0.053 mm), and ParticlesC-Si (<0.053 mm)) were determined in the interaction of pasture land use and the 0.0–7.5 cm soil depth. At the same time, the highest values for those associated with MacAgVL (8.00–4.75 mm) and MacAgL (4.75–2.00 mm) fractions in the interaction of kiwifruit land use and the 0.0–7.5 cm soil depth were measured as 21.2 and 23.7 g/kg, respectively, and the highest values for those associated with MacAgS (2.00–0.25 mm), MicAg (0.25–0.053 mm), and ParticlesC-Si (<0.053 mm) fractions in the interaction of pasture land use and the 0.0–7.5 cm soil depth were found as 28.5, 27.0, and 24.9 g/kg, respectively. Additionally, the lowest statistical effects were observed in the interaction between pasture land use and the 15.0–30.0 cm soil depth for all the examined soil aggregate fractions.
The effects of different land use types and soil depths on organic carbon contents associated with soil aggregate fractions

LUT: land use type; D: soil depth; MacAgVL: very large macroaggregates; MacAgL: large macroaggregates; MacAgS: small macroaggregates; MicAg: microaggregates; ParticlesC-Si: small particles with clay and silt-size.
Means (± standard deviation) followed by different uppercase and lowercase letters within the same column significantly differ under land use types and soil depths, respectively, at p ≤ 0.05. **: indicates significance at the p < 0.01 level of probability.
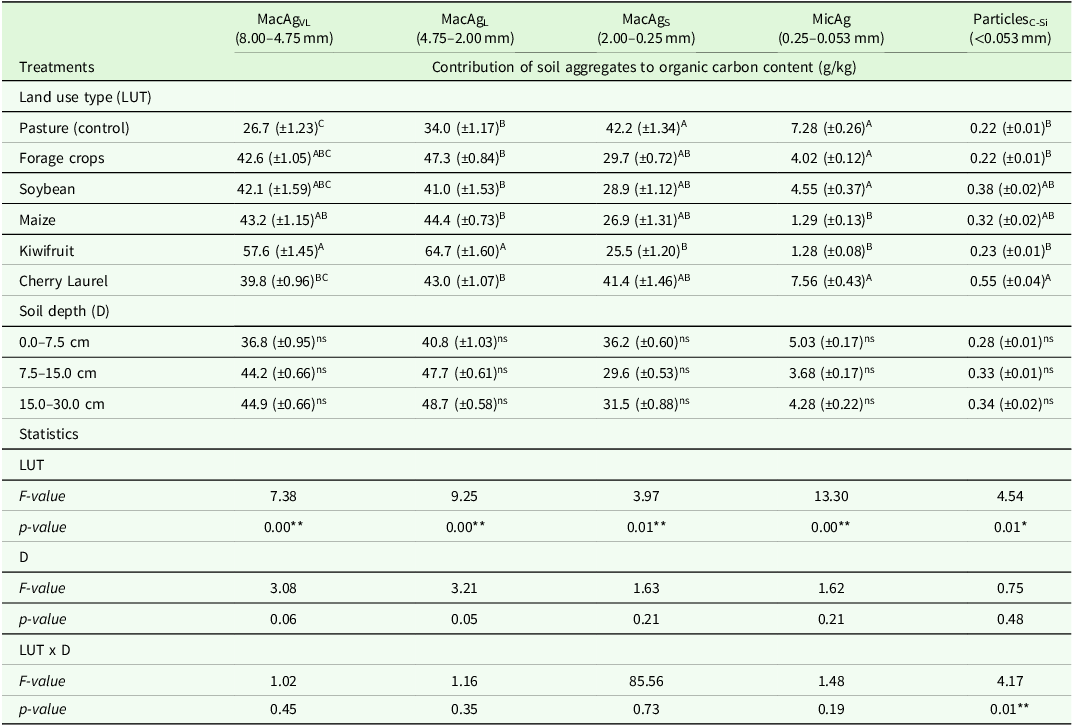
The effects of different land use types and soil depths regarding the contribution of soil aggregate fractions to organic carbon content

LUT: land use type; D: soil depth; MacAgVL: very large macroaggregates; MacAgL: large macroaggregates; MacAgS: small macroaggregates; MicAg: microaggregates; ParticlesC-Si: small particles with clay and silt-size.
Means (± standard deviation) followed by different uppercase and lowercase letters within the same column significantly differ under land use types and soil depths, respectively, at p ≤ 0.05. *: indicates significance at the p < 0.05 level of probability. **: indicates significance at the p < 0.01 level of probability.
The probable reason for the highest statistical differences between the kiwifruit land use and the especially soybean, maize and cherry laurel land uses on the surface soil depth (0.0–7.5 cm) regarding the OC contents associated with soil aggregates was the undisturbed soil structure of soils under kiwifruit land use compared to the disturbed structure of soils under these land use due to the tillage practices. Intensive CT practices carried out on the surface soil depth during the soybean-maize-bean crop rotations often broke down the structure of the soils under soybean and maize land uses. The present study also found that OC contents associated with different aggregate size fractions (MacAgVL (8.00–4.75 mm), MacAgL (4.75–2.00 mm), MacAgS (2.00–0.25 mm), MicAg (0.25–0.053 mm), and ParticleC-Si (<0.053 mm)) decreased significantly (p < 0.01) as the soil depth increased (Table 5). The subsurface soil depths (7.5–15.0 and 15.0–30.0 cm) on OC contents associated with soil aggregates revealed similar statistical effects for all the investigated aggregate size fractions, except for the MacAgS (2.00–0.25 mm) fraction.
The results regarding the contribution of soil aggregates to OC content showed that LUTs, such as pasture, forage crops, soybean, kiwifruit, and cherry laurel, had the highest statistical effects for the different aggregate sizes (Table 6). While the contributions of MacAgVL (8.00–4.75 mm) and MacAgL (4.75–2.00 mm) fractions to OC content were found to be in a higher proportion for soils under kiwifruit land use, the contributions of different LUTs to OC content in these aggregate fractions were also found to be almost similar statistically (p < 0.05, p < 0.01; Table 6). However, for the MacAgS (2.00–0.25 mm) and MicAg (0.25–0.053 mm) fractions, kiwifruit land use had least statistically significant impact (p < 0.01) in terms of contributing to OC content. For the MacAgS (2.00–0.25 mm) fraction, pasture land use contributed to the OC content in the highest proportion. Cherry laurel land use revealed the highest contribution to OC content for the MicAg (0.25–0.053 mm) fraction. LUTs, such as maize and kiwifruit land uses, contributed the least proportion to the MicAg (0.25–0.053 mm) fraction (Table 6). On the other hand, the LUT × D interaction was observed to have statistically significant effects (p < 0.01) on the ParticlesC-Si (<0.053 mm) fraction. The highest and lowest values regarding the contribution of this aggregate fraction to OC content were measured as 0.83 g/kg in the interaction of cherry laurel land use and the 15.0–30.0 cm soil depth and 0.13 g/kg in the interaction of kiwifruit land use and the 0.0–7.5 cm soil depth, respectively.
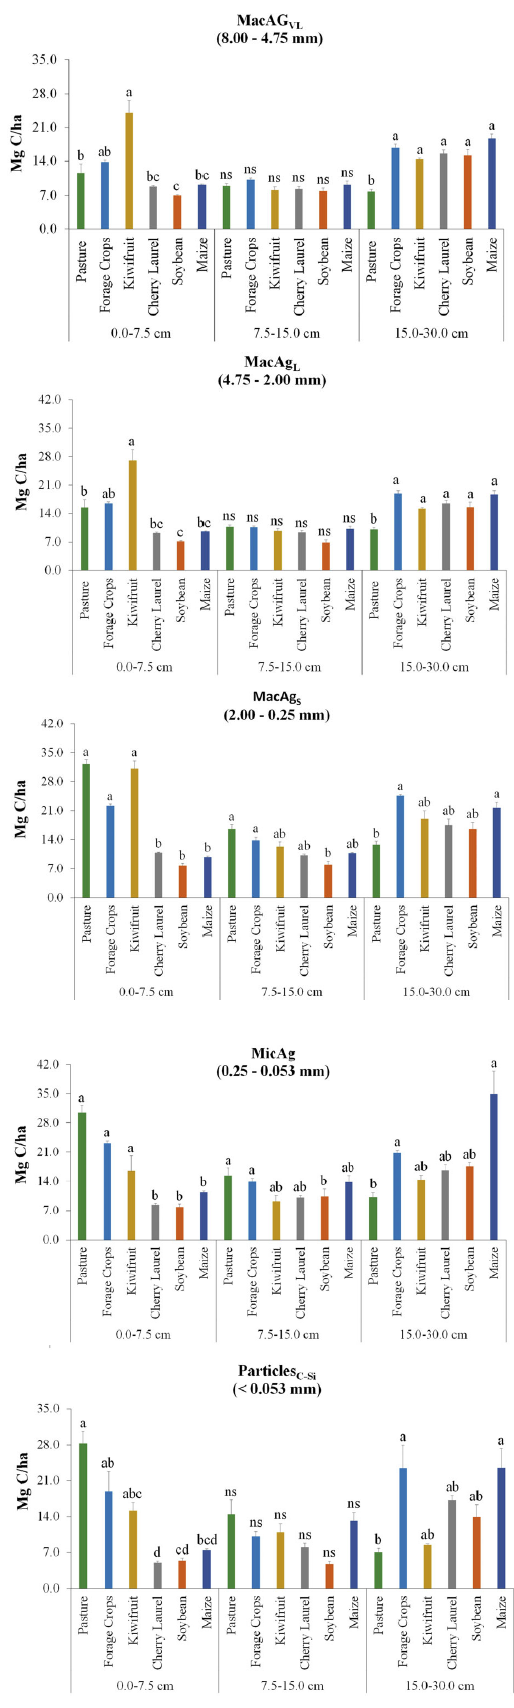
The effects of LUTs, soil depths, and the LUT × D interaction on SOCStocks at different aggregate sizes were found to be statistically significant (p < 0.05, p < 0.01), and the effects of LUTs and soil depths are shown in Figure 2. The results regarding MacAg (8.00–0.25 mm) fractions (MacAgVL (8.00–4.75 mm), MacAgL (4.75–2.00 mm), and MacAgS (2.00–0.25 mm)) revealed that LUTs, such as kiwifruit and soybean, contributed the highest and the lowest to SOCStocks, respectively, at the surface soil depth (0.0–7.5 cm). Also, while soybean and cherry laurel land uses had the lowest contributions to SOCStocks in the MicAg (0.25–0.053 mm) and ParticleC-Si (<0.053 mm) fractions at the surface soil depth, pasture land use contributed the highest proportion to SOCStocks (Figure 2). At the 7.5–15.0 cm soil depth, different LUTs showed statistically significant effects (p < 0.01) on SOCStocks for the MacAgS (2.00–0.25 mm) and MicAg (0.25–0.053 mm) fractions only. On the 0.0–7.5 cm and 7.5–15.0 cm soil depths, although pasture land use contributed the highest proportion to SOCStocks for MacAgS (2.00–0.25 mm) and MicAg (0.25–0.053 mm) fractions, soybean land use had the lowest contribution for both fractions. In the deeper soil depths (15.0–30.0 cm), forage crops and maize land uses made the highest statistical contributions to SOCStocks for all the aggregate size fractions. All the other LUTs, except for the pasture land use, contributed statistically similarly to SOCStocks (p < 0.01; Figure 2).
Soil depths and the effects of different land use types on soil organic carbon stocks in different aggregate sizes. Error bars indicate the standard error (n = 3). Different lowercase letters are significantly varied for s under each soil depth at p ≤ 0.05. ns: Not significant.

The changes of labile and recalcitrant organic carbon fractions in the soils with different land use types
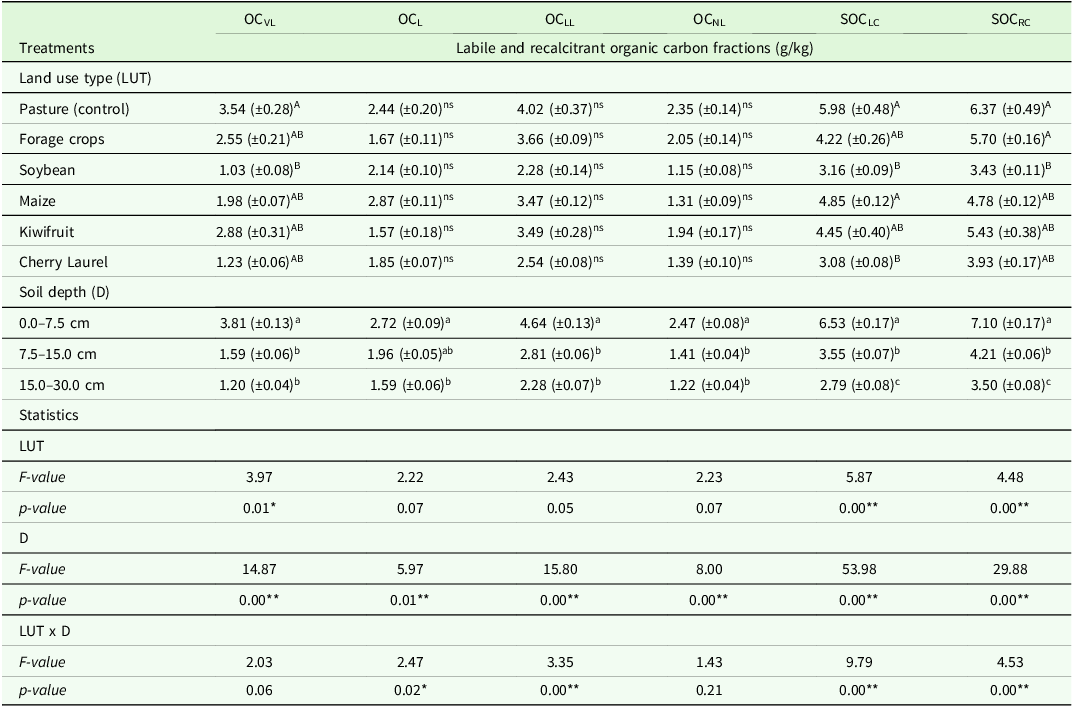
When examining the effects of LUTs, soil depth, and the LUT × D interaction on the labile OC fractions, it was observed that all the labile OC fractions (OCVL, OCL, OCLL, and OCNL) statistically changed due to the influence of the above-mentioned variability factors (Table 7). While LUTs and soil depth had significant effects (p < 0.01, p < 0.05) on the OCVL and OCNL fractions, respectively, the LUT × D interaction significantly (p < 0.05, p < 0.01) affected the variability of the OCL and OCLL fractions (Table 7).
The effects of different land use types and soil depths on labile and recalcitrant organic carbon fractions

LUT: land use type; D: soil depth; MacAgVL: very large macroaggregates; MacAgL: large macroaggregates; MacAgS: small macroaggregates; MicAg: microaggregates; ParticlesC-Si: small particles with clay and silt-size.
Means (± standard deviation) followed by different uppercase and lowercase letters within the same column significantly differ under land use types and soil depths, respectively, at p ≤ 0.05. *: indicates significance at the p < 0.05 level of probability. **: indicates significance at the p < 0.01 level of probability.
The highest and lowest average values for the OCVL fraction were observed as 3.54 and 1.03 g/kg, respectively, in soils under the pasture and soybean land uses. Also, the other land uses did not statistically affect the variability of the OCVL fraction (Table 7). On the other hand, the average values for both the OCVL fraction and the OCNL fraction decreased with increasing soil depths. While the highest average values for these labile OC fractions were observed as 3.81 and 2.47 g/kg, respectively, at the 0.0–7.5 cm soil depth, the lowest values were measured as 1.20 and 1.22 g/kg, respectively, at the 15.0–30.0 cm soil depth (Table 7).
Additionally, the LUT × D interaction statistically affected the variability of OCL and OCLL fractions (p < 0.05, p < 0.01; Table 7). The highest values for both labile OC fractions were observed as 4.76 and 8.04 g/kg, respectively, in the interaction between pasture land use and the 0.0–7.5 cm soil depth. The lowest values were also measured as 0.63 g/kg in the interaction of kiwifruit land use and the 15.0–30.0 cm soil depth for the labile OCL fraction and as 0.74 g/kg in the interaction of pasture land use and the 15.0–30.0 cm soil depth for the labile OCLL fraction.
The SOCLC and SOCRC contents in the study area were significantly affected by the LUT × D interaction (p < 0.01; Table 7). The highest SOCLC and SOCRC contents were measured as very close values to each other in the same LUT × D interaction. While the highest values for the SOCLC content were determined in the interaction between pasture land use and the 0.0–7.5 cm soil depth as 11.4 g/kg, those (11.5 g/kg) for the SOCRC content were similarly observed in the same LUT × D interaction. On the other hand, the lowest values were found as 1.71 g/kg in the interaction of kiwifruit land use and the 15.0–30.0 cm soil depth for the SOCLC content and as 2.33 g/kg in the interaction of pasture land use and the 15.0–30.0 cm soil depth for the SOCRC content.
Discussion
Long-term NT practices performed on the soils where forage crops and kiwifruit were grown could be the reason for the higher ρb values on both the surface soil depth (0.0–7.5 cm) and subsurface soil depths (7.5–15.0 and 15.0–30.0 cm) compared to soils where maize was grown using CT practices, which destroyed the soil structure. The CT practices performed with heavy machinery, such as ploughing and hoeing on soils grown maize and soybean, reduced ρ b levels (Pagliai et al., Reference Pagliai, Vignozzi and Pellegrini2004). Previous studies on the effects of NT or RT practices have also reported higher ρ b values than those of CT practices (Gathala et al., Reference Gathala, Ladha, Saharawat, Kumar and Sharma2011; Gozubuyuk et al., Reference Gozubuyuk, Sahin, Ozturk, Celik and Adiguzel2014; Jabro et al., Reference Jabro, Iversen, Stevens, Evans, Mikha and Allen2016; Ji et al., Reference Ji, Zhao, Mu, Liu and Li2013; Tormena et al., Reference Tormena, Karlen, Logsdon and Cherubin2017). These results, which reported that ρ b values were increased in NT practice, were consistent with the ρ b results obtained in the current study. On the other hand, the low ρ b values obtained at the surface soil depth (0.0–7.5 cm) in this study can be due to the high particle density of the decomposed organic residues, such as root litter with relatively high SOC and SOCStocks concentrations (Arunrat et al., Reference Arunrat, Sereenonchai, Kongsurakan and Hatano2022; Don et al., Reference Don, Schumacher and Freibauer2011). Additionally, the increased ρ b values with depth could be attributed to a reduction in soil fauna activities, changes in pore space distribution at subsurface soil depths, and compression of soil trapped between growing plant roots (Singh et al., Reference Singh, Salaria and Kaul2015). The probable reasons for the highest ρ b values observed on cultivated arable lands can be attributed to soil compaction under NT and RT practices, as well as the plough pan typically observed under CT practices, and the decrease in OM inputs with depth (Yenesew et al., Reference Yenesew, Abate, Teklay and Bayabil2025).
Nath and Lal (Reference Nath and Lal2017) found that soils under no-till maize (NTM) had higher WSA and MWD than soils under conventional tillage maize (CTM). Nyambo et al. (Reference Nyambo, Chiduza and Araya2020) also stated that CT treatments caused lower MWD values at the 0–5 cm soil layer due to the overturning process that occurs in the soil during tillage. Changes in LUTs responded to the decrease in aggregate stability, which is mainly related to potential SOC losses (Pu et al., Reference Pu, Lang, Wang, Zhang, Li, Qian, Wang, Jia, Xu and Li2022; Zheng et al., Reference Zheng, Zhao, Shi and Wang2021). LUTs, with higher biodiversity and denser root systems, contribute to the formation of large soil aggregates and the fixation of SOC, thereby improving the structural stability of agricultural soil systems (Deng et al., Reference Deng, Liu and Shangguan2014; Yu et al., Reference Yu, Yixuan, Shiwei, Jinlian, Zhi, Mingguo and Xuguang2022). Increased plant biodiversity, along with variability in LUTs, significantly contributes to SOC pools by leading to increased root densities, root residues, and mycorrhizal secretions in subsurface soil depths (Deng et al., Reference Deng, Wang, Tang and Shangguan2016). Increases in plant root density and accumulation in subsurface depths lead to higher OC content and lower ρb values. The situation also increases microbial activity, promoting the formation of macroaggregates that act as a physical barrier, allowing SOC to remain in the soil for more extended periods (Gunina and Kuzyakov, Reference Gunina and Kuzyakov2014). Saha et al. (Reference Saha, Kukal and Sharma2011) also reported that aggregate stability values in grassland soils were higher than those in other LUTs due to the higher SOC contents and the water-repellent effect, which allows for slower water movement into the aggregates. The stability and formation of soil aggregates are influenced by various factors, such as SOM (Archer et al., Reference Archer, Otten, Schmidt, Bengough, Shah and Bonell2015; Camberdella and Elliot, Reference Cambardella and Elliott1993; Jastrow and Miller, Reference Jastrow, Miller, Lal, Kimble, Follett and Stewart1998), plant root systems (Celik, Reference Celik2005; Six et al., Reference Six, Paustian, Elliott and Combrink2000b), microbial activity (Archer et al., Reference Archer, Otten, Schmidt, Bengough, Shah and Bonell2015; Jastrow, Reference Jastrow1996), and the capability of the soil to resist external destructive impacts (Besalatpour et al., Reference Besalatpour, Ayoubi, Hajabbasi, Mosaddeghi and Schulin2013; Huang et al., Reference Huang, Wang, Tan, Hu, Cai and Wang2010; Jia et al., Reference Jia, Yang, Zhang, Shao and Huang2017; Xiao et al., Reference Xiao, Liu, Abd-Elbasit, Zhang, Liu, Zheng, Zhang and Hu2017). Some researchers reported that the soil aggregate stability across the increased soil depths could generally decrease due to the effects of the rooting systems (Angers and Caron, Reference Angers and Caron1998), the types of the present soil organisms and their activities (Bignell and Holt, Reference Bignell, Holt and Lal2002), or the shortage of SOC quantity and fractions (Shein and Milanovskii, Reference Shein and Milanovskii2003). Also, Shrestha et al., (Reference Shrestha, Sitaula, Singh and Bajracharya2004) stated that both land uses and soil depths had a significant statistical effects (p < 0.01) on the SOC contents associated with aggregate size distribution. Similar to the highest WSA values (76.0 and 68.2 %, respectively) observed under the pasture land use and at the 0.0–7.5 cm soil depth in the current study, Gelaw et al. (Reference Gelaw, Singh and Lal2015) revealed that the highest WSA value (88.7 %) at the 0–10 cm soil depth was measured for soils under the pasture land use and that it was significantly different (p < 0.01) from those under other LUTs.
Deiss et al., (Reference Deiss, Sall, Demyan and Culman2021) reported that NT practice increased SOC stratification more than intensive tillage practices and that soybean rotation reduced SOC accumulation. Similarly, Novelli et al., (Reference Novelli, Caviglia and Melchiori2011) reported that increasing the soybean cropping frequency reduced the SOCStock in Mollisol and Vertisol soils at the 0.0–5.0 cm soil depth and in Vertisol soil at the 5.0–15.0 and 15.0–30.0 cm soil depths and that decreasing the soybean cropping frequency resulted in a higher SOC concentration and a higher stratification ratio in the Mollisols at the 0.0–5.0 cm soil depth. They stated that high soybean cropping frequency may severely affect SOC storage in Mollosiol soil and that in Vertisol soil, this effect may lead to a long-term reduction in the SOC storage. Wright and Hons (Reference Wright and Hons2004) stated that soybean crops provided limited crop residuals with a low C/N ratio. Also, several studies have revealed that agricultural practices improving the addition of organic residues to the soil reduced the rates of decomposition and oxidation of OC, and increased SOC concentration (Follet, Reference Follett2001; Paustian et al., Reference Paustian, Six, Elliott and Hunt2000; Rahmati et al., Reference Rahmati, Eskandari, Kouselou, Feiziasl, Mahdavinia, Aliasgharzad and McKenzie2020). Our findings presented that soybean and cherry laurel land uses are LUTs with the relatively lowest OC contribution to soils.
In this study, the lower SOC and SOCStocks concentrations in the subsurface soil layers were likely related to the input of fewer organic residues into the subsoil under different LUTs. Xiao et al., (Reference Xiao, Zhou, Zhao, Greenwood and Kuhn2020) found that samples taken deeper than 30.0 cm in the soil profile could mask the change in SOCStocks in the surface (0.0–5.0 cm depth) of soils with long-term NT practice. Additionally, Assefa et al., (Reference Assefa, Rewald, Sanden, Rosinger, Abiyu, Yitaferu and Godbold2017) reported that the SOCStocks observed in the surface soil layer (0.0–10.0 cm) accounted for approximately 60% of the total SOCStocks. Kuhn et al., (Reference Kuhn, Hu, Bloemertz, He, Li and Greenwood2016) stated that limiting the downward transport of organic residues can be the reason for the reduced SOC content in the subsurface soil layers. As another reason for SOC and SOCStocks decreasing with increased soil depth, Baker et al., (Reference Baker, Ochsner, Venterea and Griffis2007) explained that soil compaction caused by the increased ρ b in the subsurface soil layers reduced SOC sequestration by limiting root growth. Shrestha et al., (Reference Shrestha, Sitaula, Singh and Bajracharya2004) declared that the decreasing SOCStocks with the increased soil depth was more pronounced in grazing land (p < 0.05) compared to other LUTs, and that a significantly higher SOCStocks was observed at the topsoil depth than at other depths within the soil profile of the same land use. Pathak et al., (Reference Pathak, Nath, Sileshi, Lal and Das2017) noted that relatively higher SOC losses from subsurface soil depths are attributed to lower rates of fine root production and to the reduced SOM accumulation resulting from the shallow root nature at these depths. Additionally, Zhong et al., (Reference Zhong, Han, Xu, Zhang, Fu, Liu, Ren, Yang and Ren2019) reported that, following land use change/conversion, which varied with LUTs and soil depths, significant increases in SOC contents and SOCStocks in bulk soil and aggregates were observed. Similar to the results mentioned above, higher ρb values and lower SOC and SOCStocks amounts were generally observed in the subsurface soil layers in this study.
The POx-C content is more responsive to changes in soil management than TOC content (Bongiorno et al., Reference Bongiorno, Bünemann, Oguejiofor, Meier, Gort, Comans, Mader, Brussaard and de Goede2019; Culman et al., Reference Culman, Snapp, Freeman, Schipanski, Beniston, Lal, Drinkwater, Franzluebbers, Glover, Grandy, Lee, Six, Maul, Mirksy, Spargo and Wander2012; Moebius-Clune et al., Reference Moebius-Clune, Moebius-Clune, Gugino, Idowu, Schindelbeck, Ristow, van Es, Thies, Shayler, McBride, Kurtz, Wolfe and Abawi2016; Pulleman et al., Reference Pulleman, Wills, Creamer, Dick, Ferguson, Hooper, Williams and Margenot2021). Additionally, it has a positive relationship with aggregate stability (Bell et al., Reference Bell, Moody, Connolly and Bridge1998; Moody et al., Reference Moody, Yo and Aitken1997), and changes in its content are significantly correlated with LUTs (Aumtong et al., Reference Aumtong, Magid, Bruun and de Neergaard2009). Sharma et al., (Reference Sharma, Hussain, Sharma and Arya2014) found that forest soils had a higher POx-C content in the surface soil layers than horticulture, agriculture, and degraded soils. Bruun et al., (Reference Bruun, Egay, Mertz and Magid2013) also reported that the POx-C and SOC contents in the upper soil layer (10.0 cm) were significantly correlated and indicated similar changes. Several researchers stated that POx-C contents were higher in the surface layer of soils tilled with NT practice and residue mulch than those tilled with CT practice without residues (Bhowmik et al., Reference Bhowmik, Fortuna, Cihacek, Bary, Carr and Cogger2017; Dikgwatlhe et al., Reference Dikgwatlhe, Kong, Chen, Lal, Zhang and Chen2014). Poiriera et al., (Reference Poiriera, Roumet and Munsonc2018) reported that a strong positive relationship (R 2 = 0.76–0.92) between POx-C and SOC, and that this correlation relationship was more related to depth and site factors than to management practices. Mandal et al., (Reference Mandal, Yadav, Sharma, Ramesh and Venkanna2011) reported that the POx-C content in arable cultivated soils is lower than that in uncultivated LUTs. Results obtained regarding POx-C content in our study showed that changes in the SOC, SOCStocks, and POx-C contents of soils under different LUTs had similar trends and decreased with the impact of tillage practices, such as CT and RT, compared to the effects of NT, which was carried out in soils under LUTs, such as pasture, forage crops, and kiwifruit land uses.
In our study, the effects of LUTs on the variability of MWD were complex and multifaceted. Kiwifruit and pasture land uses, with undisturbed soil structure and managed with NT practice, were LUTs with statistically the highest and lowest values of MWD, respectively. The possible reasons for determining the highest MWD values under kiwifruit land use may be the effects of the kiwifruit roots and soil texture components, especially clay and sand contents, as well as long-term NT management. It is considered that the determination of the lowest MWD values in pasture land use is related to the fact that the soils under the pasture LUT have the highest sand contents among LUTs whose effects are examined in the study area (Tables 2 and 4). On the other hand, it was also found that maize land use, where CT practices are carried out and mechanical disintegration of the soil structure is the highest, did not have a statistically significant effect on the variability of MWD. Wander and Bollero (Reference Wander and Bollero1999) found that MWD was higher in undisturbed soils than in conventionally treated soils. It was also stated that MWD values in areas converted from pasture to cropland decreased (John et al., Reference John, Yamashita, Ludwig and Flessa2005; Shepherd et al., Reference Shepherd, Saggar, Newman, Ross and Dando2001). Also, numerous studies reported similar changes in WSA and MWD, and those were affected by various LUTs (Jiang et al., Reference Jiang, Li, Xie, Ouyang, Yuan and Duan2023; Kabir et al., Reference Kabir, Bashari, Mosaddeghi and Bassiri2017; Mozaffari et al., Reference Mozaffari, Rezaei and Ostovari2021; Shepherd et al., Reference Shepherd, Saggar, Newman, Ross and Dando2001; Shi et al., Reference Shi, Zhang, Zhang, Yongqiang and Ding2013; Tang et al., Reference Tang, Qiu, Xu, Li, Chen, Li and Lu2022; Zhao et al., Reference Zhao, Chen, Hu and Li2017). Uncultivated soil had significantly higher WSA, the geometric mean diameter (GMD) and MWD than cultivated soils in the 0–5 and 5–10 cm depths and higher Cag concentrations than cultivated soils (Bronick and Lal., Reference Bronick and Lal2005).
Compared to uncultivated land managed with NT practice and cultivated land managed with CT practice, MacAg (8.00–0.25 mm) amounts were reported to decrease, while MicAg (0.25–0.053 mm) amounts increased (Anderson et al., Reference Anderson, Brye and Wood2019; Idowu and Kircher, Reference Idowu and Kircher2016). Our results revealed that LUTs, where NT and RT practices were performed, generally had higher MacAg (8.00–0.25 mm) amounts than those where CT practice was carried out, and maize land use with CT practice had a similar effect, as organic material inputs present, such as straw, promoted the MacAgL (4.75–2.00 mm) development (Ma et al., Reference Ma, Cai, Li, Wang, Xiao, Peng and Yang2015; Rong et al., Reference Rong, Li, Zhu, Zhou, Qiu, Ge, Wei and Shao2020). Gami et al., (Reference Gami, Lauren and Duxbury2009) found that breaking MacAg (8.00–0.25 mm) due to tillage practices in arable soils resulted in the OC losses associated with the aggregates. It is also reported that MicAg (0.25–0.053 mm) may have higher OC contents than MacAg (8.00–0.25 mm) because of their relatively high aggregate stability (Okolo et al., Reference Okolo, Gebresamuel, Zenebe, Haile and Eze2020; Shrestha et al., Reference Shrestha, Singh, Sitaula, Lal and Bajracharya2007). Previous studies have shown that the SOC amounts associated with aggregates are affected by the extent of soil disturbance and the quantity of residue returned to the soil (Blanco-Canqui and Lal, Reference Blanco-Canqui and Lal2004; Garcia-Orenes et al., Reference Garcia-Orenes, Cerda, Mataix-Solera, Guerrero, Bodi, Arcenegui, Zornoza and Sempere2009; Srinivasarao et al., Reference Srinivasarao, Venkateswarlu, Lal, Singh, Kundu, Vittal, Patel and Patel2011). Modak et al. (Reference Modak, Ghosh, Bhattacharyya, Biswas, Das, Das and Singh2019) found that the OC content associated with MacAg (8.00–0.25 mm) was higher in NT practice than in CT practice at the 0.0–5.0 and 5.0–15.0 cm soil depths. The accumulation of roots in topsoil results in a decrease in ρ b and the retention of more plant residues, thus supporting higher microbial metabolism and contributing to the formation of macroaggregates to provide physical protection for SOC (Gunina and Kuzyakov, Reference Gunina and Kuzyakov2014). Das et al., (Reference Das, Bhattacharyya, Saha, Ghosh, Khan, Ahmed, Dey, Bhatia, Pramanik, Kumar, Agarwal and Shahi2022) reported low OC content related to MacAg (8.00–0.25 mm) in the deeper soil layers. They also reported that forest land use had a higher OC content related to aggregates in all aggregate size fractions compared to the rice-wheat, rice-vegetable, and maize-wheat land uses. Shrestha et al., (Reference Shrestha, Sitaula, Singh and Bajracharya2004) indicates that the distribution of SOC content associated with aggregates under different LUTs varied significantly with land use (p < 0.01) and soil depth (p < 0.01). The results of this study showed similar trends to those above, which recorded variability in OC contents associated with aggregates. Jakab et al., (Reference Jakab, Madarasz, Masoudi, Karlik, Kiraly, Zachary, Filep, Dekemati, Centeri, Al-Graiti and Szalai2023) explained a significant increase in OC content associated with soil aggregates under NT practice and the deep cultivation from the surface soil layer (0.0–10.0 cm). They reported an inverse relationship between WSA and OC content associated with aggregates. Consistent with our results, Bronick and Lal (Reference Bronick and Lal2005) found that, compared to the OC concentration associated with MicAg (0.25–0.053 mm), the OC concentration associated with MacAg (8.00–0.25 mm) was higher in the 0–5 cm soil depth than in the 5–10 cm soil depth. Also, Wei et al. (Reference Wei, Shao, Gale, Zhang and Li2013) revealed that, taking into consideration the comparison between the two soil depths (0–10 cm and 10–20 cm), the MacAg (8.00–0.25 mm)fraction of soils decreased more in the 0–10 cm soil depth than in the 10–20 cm soil depth.
Additionally, they reported that adding OM to the plant roots below the ground resulted in a slight decrease in the amount of OM trapped within the aggregates relative to the residues above the ground in the topsoil. These results were considerably correlated with our findings regarding the relationship between WSA and OC content associated with MacAg (8.00–0.25 mm) fractions. The current study also found that soils under pasture land use with the highest aggregate stability had the lowest OC content associated with MacAgVL (8.00–4.75 mm) and MacAgL (4.75–2.00 mm) fractions.
Liu et al., (Reference Liu, He, Zhang, Schroder, Li, Zhou and Zhang2010) reported that the aggregate fractions (>5.0 mm) provided the highest contribution to the SOC content for the orchard soils. Similarly, Ameer et al., (Reference Ameer, Kubar, Ali, Ali, Khan, Shahzad, Riaz, Shah, Rajpar, Ahmed and Talpur2022) reported that the 8.0 mm aggregate fraction contributed the highest SOC content for the orchard soils, followed by the 8.0–5.0 mm, and <0.0425 mm aggregate fractions. In the present study, the MacAg (8.00–0.25 mm) fractions (MacAgVL (8.00–4.75 mm), MacAgL (4.75–2.00 mm), and MacAgS (2.00–0.25 mm)) contributed more to SOC content than the MicAg (0.25–0.053 mm) and ParticleC-Si (<0.053 mm) fractions. Similarly, Liu et al., (Reference Liu, Han, Li, Zhang and Song2019) and Zhu et al., (Reference Zhu, Ran, Ma, Li, Mir, Ran, Wu and Huang2022) observed that MacAg (>250 µm) contributed more significantly to SOC content than MicAg (0.25–0.053 mm) under five different LUTs (farmland, undisturbed natural grassland, shrub forestland, arbour-shrub mixed forestland, arbour forestland) at the 0.0–30.0 cm soil depths. Contrary to our results, Gonzalez-Rosado et al., (Reference Gonzalez-Rosado, Parras-Alcantara, Aguilera-Huertas, Benitez and Lozano-Garcia2020) reported that the most significant contribution to SOCStocks in terms of soil aggregates was realised by CT practice. At the study’s surface soil depth (0.0–7.5 cm), the most significant contributions to SOCStocks within all the examined aggregate fractions were given by the pasture, forage crops, and kiwifruit land uses, where NT and RT practices were carried out. Also, the contributions to SOCStocks by smaller aggregate fractions (MacAg (8.00–0.25 mm), MicAg (0.25–0.053 mm), and ParticleC-Si (<0.053 mm)) were higher than by larger aggregate fractions (MacAgVL (8.00–4.75 mm) and MacAgL (4.75–2.00 mm)), as reported by Gonzalez-Rosado et al. (Reference Gonzalez-Rosado, Parras-Alcantara, Aguilera-Huertas, Benitez and Lozano-Garcia2020).
According to Sharma et al., (Reference Sharma, Singh, Angmo and Satpute2022), LUTs significantly impact labile OC fractions, such as water-extractable C (WEC), microbial biomass carbon (MBC), and OC fractions with variable oxidizability. They found the CNL fraction was more significant than the other labile OC fractions (CVL, CL, and CLL) among different LUTs. Sing and Benbi (Reference Sing and Benbi2018) found that grassland soils had the highest levels of CVL, CL, and CLL fractions and that the contributions of CVL and CL fractions to TOC were higher under grassland land use than other land uses. Contrary to the above results, our study revealed that LUTs had a significant statistical effect (p < 0.01) on the CVL fraction only; however, the LUT × D interaction revealed significant statistical impacts on the CL and CLL fractions. On the other hand, some researchers have reported that land management practices significantly affect the SOCLC and SOCRC pools (Nabuurs et al., Reference Nabuurs, van Putten, Knippers and Mohren2008) and that they can provide valuable insights into understanding the SOC budget by evaluating how SOCLC and SOCRC fractions respond to changes in LUTs (Yu et al., Reference Yu, Han, Li and Zhou2017). Benbi et al., (Reference Benbi, Brar, Toor and Singh2015) reported that SOC indicators such as POx-C, mineralisable C, and the CL and CNL fractions changed significantly with the impact of different LUTs, and that the SOCRC pool was higher in uncultivated soils than in other land uses. Thangavel et al., (Reference Thangavel, Kanchikerimath, Sudharsanam, Ayyanadar, Karunanithi, Deshmukh and Vanao2018) found that management practices had a greater influence on the SOCLC pool than on the SOCRC pool. Liu et al., (Reference Liu, Li, Qi, Han and Zhu2017) observed that SOCLC and SOCRC pools decreased due to the increased soil depth and agricultural land use. Shukla et al., (Reference Shukla, Behera, Lakaria and Tripathi2023) stated that the LUT x D interaction had the significant statistical effects on the CVL, CL, CLL, and CNL fractions. The results obtained in our study showed significant similarities with the above findings, and the LUT × D interaction also significantly affected the variability of SOCLC and SOCRC fractions.
Conclusions
The results of this study revealed that different LUTs and soil depths significantly affect the examined soil properties. In contrast to the other LUTs, higher values of soil properties, such as WSA, SOC, SOCStocks, and POx-C, were observed in soils under pasture land use with NT management practices. On the other hand, soil properties such as SOC, SOCStocks, POx-C, and OC contents associated with aggregates were significantly reduced in soils under LUTs with CT management practices.
The high OC content of soil aggregates observed in soils under pasture, forage crops, and kiwifruit land uses, where NT soil management practice is implemented, and the high SOC and SOCStocks amounts resulting from the prevention of physical weathering in the same LUTs are thought to improve the physical quality of the soils in the study area. Similarly, contributions to the SOCLC and SOCRC pools were higher under these LUTs where NT soil management practice was carried out. Consequently, increasing the number of LUTs adopting NT or RT management practices to enhance OC accumulation in the soil would contribute more significantly to the sustainable soil fertility of the agricultural lands in the plain.
Author contributions
Serkan İç: Supervision, Conceptualisation, Methodology, Investigation, Validation, Visualisation,Writing-review, and editing.
Funding statement
This research received no financial support from public, private, or commercial agencies.
Competing interests
The author declares that there is no conflict of interest concerning the publication of this article.
Ethical standards
Not applicable.