
I. INTRODUCTION
Magnesium alloys have been applied broadly in many engineering fields due to their low density, high specific strength, recyclability, and easy machinability.
Reference Liu, Liu, Liu and Wang1–Reference Liu, Sun, Wang, Li, Wang and Du5
As the crystal structure of Mg is hexagonal close-packed (hcp), the main slip system of Mg is
 $\left\{ {000\left. 1 \right\}} \right.\,\,\left\langle {11\bar 2\left. 0 \right\rangle } \right.$
when the deforming temperature is below 225 °C.
Reference Hirsch and Al-Samman6
The limited slip system restricts the slip of dislocations, and thus, the mechanical properties of Mg alloys are relatively poor, and they seriously limit their application development.
Reference Mirza and Chen7,Reference Geng, Teng, Zhou, Zhao and Leng8
In recent years, Mg–Y–Zn alloys with a long period stacking ordered (LPSO) structure have attracted great attention because of the relative lower price of Y among rare earth elements as well as the high mechanical properties of these alloys at room and elevated temperature.
Reference Chen, Zhang, Wang, Ma and Hao9–Reference Li, Zhang, Li, Yuan, Li, Ma, Shi, Li and Liu11
Leng et al. reported a Mg–(6,9) RY–4Zn alloy with a high yield strength of 316 MP, UTS of 243 MPa, and elongation of 16.3% at 250 °C. Reference Leng, Zhang, Zhu, Wu, Zhang, Liu, Sun and Zhang12 By hot rolling and subsequent aging, Xu et al. reported an Mg–8.2Gd–3.8Y–1.0Zn–0.4Zr alloy with the UTS and elongation of 517 MPa and 4.5%, respectively. Reference Xu, Zheng, Xu, Wu, Wang, Kamado, Wang and Lv13 The outstanding properties of this alloy are because of the formation of the LPSO phase. Basically, the crystal structures of LPSO phases in Mg–Y–Zn alloys have been characterized by the periodic stacking faults associated with the enrichment of Zn and Y atoms in particular atomic planes, Reference Kim, Ko, Sandlöbes, Heidelmann, Grabowski and Raabe2,Reference Gröbner, Kozlov, Fang, Geng, Nie and Schmid-Fetzer14–Reference Tane, Kimizuka, Hagihara, Suzuki, Mayama, Sekino and Nagai16 and the X phase (Mg12ZnY), one of the most frequently observed phases in the Mg–Y–Zn alloy with different chemical compositions, is well known to have the same structure with LPSO. Reference Kim, Ko, Sandlöbes, Heidelmann, Grabowski and Raabe2,Reference Zhu, Chen, Liu, Liu, Wang, Liu and Hui17,Reference Wang, Wu, Lu, Chen, Huang, Qin, Yang and Pan18 It has been reported that the X phase plays an important role to enhance the comprehensive performances of Mg–Y–Zn alloys. Reference Chen, Wang, Zhang, Ma and Hao19–Reference Asgharzadeh, Yoon, Chae, Kim, Lee and Kim22 Due to the high coherent stability with the magnesium matrix, the X phase can effectively improve the mechanical properties of Mg–Y–Zn alloys by inhibiting the basal slip. Reference Wang, Song, Gao, Huang, Shi and Pan23 In addition, the increase of the volume fraction of the X phase in the as-extruded alloys could significantly improve the mechanical properties. Reference Zhang, Liu, Hu, Li, Le, Bao, Zhu and Cui24
W phase (Mg3Zn3Y2) is another common ternary phase in Mg–Y–Zn alloys besides the X phase. It was reported that the W phase has a face center cubic (fcc) structure with a lattice parameter of 0.685 nm. Reference Gröbner, Kozlov, Fang, Geng, Nie and Schmid-Fetzer14 Previous work indicates that during the tensile experiments, the W phase is easy to crack because the interfaces of the W phase with the Mg matrix are not coherent, and the alloys with the W phase have relatively low mechanical properties. Reference Wang, Song, Gao, Wei and Pan25,Reference Singh, Somekawa and Mukai26 But some researchers found that the W phase can improve mechanical properties in certain cases. Wang et al. reported that the Mg3Zn3Y2 particle may cause compound strengthening with the Mg12ZnY phase. Reference Zhang, Liu, Wang, Le, Hu, Bao and Cui27
The influence of Y on Mg–Zn alloys has been studied by many researchers so far, but the effects of the Zn content on Mg–Y alloys are barely discussed. So, it is of great significance to study the changes of the varieties, morphology, distribution of the second phases, and the mechanical properties of Mg–Y alloys with the addition of Zn. Therefore, the effects of the Zn content on microstructures and mechanical properties of as-cast Mg–4Y–xZn alloys are studied in the artice.
II. EXPERIMENTAL PROCEDURES
The alloys required for this paper were prepared by melting pure Mg(99.99%), Mg–17.9Y master alloy, and pure Zn(99.99%) in an electrical resistance furnace under the protection of Ar and SF6 atmosphere (mixing ratio is
 ${V_{{\rm{S}}{{\rm{F}}_6}}}{\rm{:}}{V_{{\rm{Ar}}}} = 1{\rm{:}}100$
, all percentages in this article are mass fractions if not specified). The molten metal will be at 720 °C for 15 min for heat preservation and then poured in an air-cooled rectangle metal mold with a dimension of 150 × 150 × 25 mm. The tensile tests were carried out on a CSS-2202 universal testing machine (Changchun Research Institute for Testing Machines, Changchun, China), and Vickers hardness testing was taken using a 100 N load and with holding time of 15 s.
Metallographic specimens were polished with a 0.1 μm diamond paste and then etched with 3 vol% nital. The microstructures were characterized by MR5000 optical microscopy (OM; Nanjing Jiangnan Novel Optics Co., Ltd., Nanjing, China), and the alloys’ grain size was analyzed quantitatively by intercept method. Phase analysis was detected by Bruker D8 Advance X-ray diffraction (XRD; Bruker AXS GmbH, Karlsruhe, Germany). To characterize the phases distribution and fractography of experimental alloys, scanning electron microscopy (SEM) equipped with energy-dispersive X-ray analysis was used. In addition, Mg–4Y–2Zn and Mg–4Y–4Zn were also tested by an STA 449 F1 differential scanning calorimeter (DSC; NETZSCH-Gerätebau GmbH, Selb, Germany).
III. RESULTS AND DISCUSSION
A. Effect of Zn content on microstructures
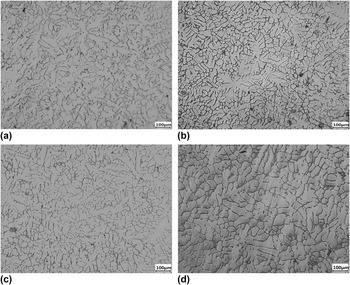
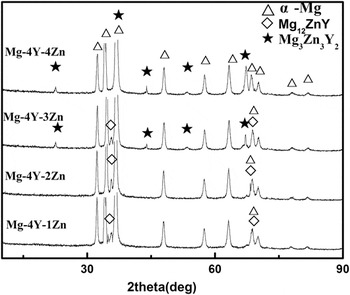
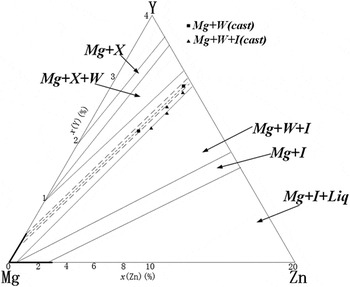
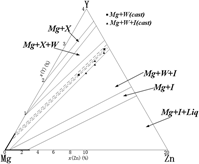
The OM images of the four as-cast specimens are shown in Fig. 1. It can be found that the secondary phases distribute in grain boundaries and the experimental alloys show a microstructure with typical casting dendrites. With the increase of Zn content, the secondary dendritic arm spacing of the four alloys is 27–30 μm, 23–25 μm, 25–26 μm, and 37–40 μm, respectively. Figure 2 shows the XRD patterns for the alloys studied. It can be found that the four investigated alloys mainly consisted of α-Mg, X phase, and W phase, and the phase compositions and their amounts rely on Y/Zn ratios as well as on the contents of Zn and Y. Reference Chen, Zhang, Wang, Ma and Hao9,Reference Zhang, Liu, Hu, Li, Le, Bao, Zhu and Cui24,Reference Wang, Gao, Song, Huang, Shi and Pan28 And the various details of phases transition could be seen in Fig. 3. Reference Zhu, Chen, Wang, Wang, Liu, Liu and Hui29 When the Zn is added in the range of 1–4%, the X phase is formed firstly, and the X phase, X + W phases, and W phase precipitated in order.
The OM images of the as-cast alloys: (a) Mg–4Y–1Zn, (b) Mg–4Y–2Zn, (c) Mg–4Y–3Zn, and (d) Mg–4Y–4Zn.

XRD diffractograms of the Mg–4Y–xZn alloys.

Isothermal section diagram of Mg–Y–Zn alloy at 400 °C (673 K).

Because the solid solubility of Zn in the alloy has a sharp drop as the temperature decreased, the segregation of Zn element on the solid/liquid interface is more severe during solidification, and finally it leads to high degrees of constitutional undercooling, stimulates the potential nucleation centers in the melt, and increases the number of nucleation. Besides, the increase of the Zn element will decrease the solid solubility of Y, leading to the segregation of Y on the solid/liquid interface and increased branches of the α-Mg dendrite, decreasing dendrite spacing. These branches divide the remaining liquid into many small, closed, isolated islands, so the alloys exhibit the tendency of equalization. However, the Mg3Zn3Y2 phases consume more Y element than Mg12ZnY phases for every single Zn atom, which may be one of the reasons leading to the increased dendrite spacing of Mg–4Y–3Zn and Mg–4Y–4Zn. As a matter of fact, it can be well explained by the growth restriction factor (GRF) of a solute element Reference Chen, Zhang, Wang, Ma and Hao9 : GRF = ∑m i C 0i (k i − 1), where m i is the slope of the liquidus line, k i is the equilibrium partition coefficient, and C 0i is the initial concentration of the solute element i. The larger the GRF is, the better the refining effect will be. When the addition of Zn element increased from 1 to 2%, the C 0i in the GRF is increased; therefore, the secondary dendritic arm spacing is decreased, and when the addition of Zn element reaches to 3 and 4%, the W phase consumes more Y element than the X phase for every single Zn atom. As a result, the actual C 0i in the GRF is decreased. Thus the GRF is then decreased and the grain size is increased.
Therefore, the refinement mechanism of the alloys can be attributed to the solute redistribution on the solid/liquid interface as well as the increase of the undercooling during solidification with the increase of Zn.
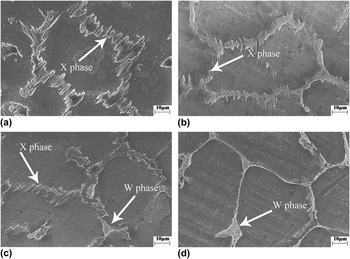
The SEM results of the four alloys are shown in Fig. 4. The alloy with 1% Zn has α-Mg and the X phase, and the phase distribution of X is between the α-Mg dendrites, in a lath shape [Fig. 4(a)]. And when 2% Zn is added, the phase composition of the alloy is not changed, but the shape of the second phase has changed; the second phase appears in a dense fine needle shape and grain boundaries tend to be refined [Fig. 4(b)]. For Mg–4Y–3Zn, the W phase appears [Fig. 4(c)]. The W phase is located at the junction of the grain boundary, while the X phase is still distributed between α-Mg [Fig. 4(c)]. When the content of Zn reaches to 4%, the alloy only has one ternary phase of W [Fig. 4(d)]. The W phase is more obvious at the junction of the grain boundary [Fig. 4(d)].
SEM image of the as-cast Mg–4Y–xZn alloys: (a) Mg–4Y–1Zn, (b) Mg–4Y–2Zn, (c) Mg–4Y–3Zn, and (d) Mg–4Y–4Zn.

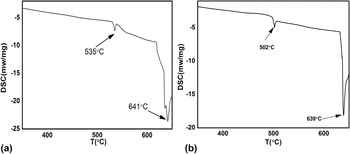
To further verify the formation of the Mg–Y–Zn ternary phases, the solidification processes of the alloys have been discussed based on the results from DSC. Figure 5 shows the DSC results of two typical alloys. There are two endothermic peaks for both of the experimental alloys, and the endothermic peak at about 639 °C should be the fusion temperature of the α-Mg. Besides the peak at 639 °C, Mg–4Y–2Zn has another endothermic peak at a temperature of 535 °C [Fig. 5(a)], and 535 °C corresponds to the eutectic reaction temperature of the X phase: L → α-Mg + X. Reference Chen, Wang, Zhang, Ma and Hao30 So it is reasonable to assume that it is the eutectic temperature of the X phase. And for Mg–4Y–4Zn, there is a temperature of 502 °C apart from the melting point of α-Mg. In consideration of the composition of Mg–4Y–4Zn, this temperature should correspond to the eutectic reaction of the W phase. The formation of the W phase can be described as L → α-Mg + W, so 502 °C is actually the eutectic temperature of the W phase. The main reactions of these alloys which occurred during solidification can be expressed as follows:
 $${\rm{L}} \to \alpha {\rm{ ‐ Mg}}\quad {\rm{,}}$$
 $${\rm{L}} \to \alpha {\rm{ ‐ Mg}} + {\rm{X}}\quad {\rm{,}}$$
 $${\rm{L}} \to \alpha {\rm{ ‐ Mg}} + {\rm{W}}\quad .$$
DSC curves of the alloys with: (a) 2% and (b) 4% Zn.

Therefore, we speculate that the solidification of the alloys with 1 and 2% Zn contains the first two reactions, and for the alloy with 3% Zn, all of the three reactions should be contained, while Mg–4Y–4Zn does not involve the second one. Compared with the X phase and α-Mg, the eutectic temperature of the W phase is quite low. So, the W phase is located at the junction of the grain boundary.
B. Effect of Zn content on mechanical properties
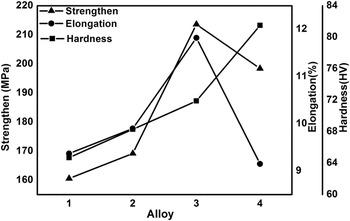
Figure 6 illustrates the mechanical properties of the experimental alloys. Zn addition increased the hardness of the test alloys continuously (from 64.7 to 81.5 HV). In contrast, the effects of Zn on UTS and elongation would be more complex. The UTS and elongation increased when the content of Zn increased in the range of 1–3% and declined when the content of Zn reached to 4% (Fig. 6), with the maximum values of 213.6 MPa and 11.82%, respectively.
The UTS, hardness, and elongation of the experimental alloys.

In fact, during the solidification process, the solute redistribution as well as the segregation of the Zn element on the solid/liquid interface cause the expansion of the supercooling zone and lead to an increase of the nucleation rate, reduce the growth time, as well as the interspace of dendritic and change the properties of the test alloys.
When the Zn addition is changed in the range of 1–4%, the X phase first forms, and the X phase, X + W phases, and W phase precipitated in order. In any case, the ternary phases are relatively hard compared to the α-Mg matrix. And compared with the X phase, the W phase is kind of a hard brittle phase. Reference Wang, Song, Gao, Huang, Shi and Pan23,Reference Wang, Song, Gao, Wei and Pan25,Reference Singh, Somekawa and Mukai26 So it can be understood that the hardness must be increased with the increases of Zn content as the kinds and amounts of the ternary phases changed.
Solidification is carried out by two processes: nucleation and growth, and nucleation is the first step of solidification, as it is related to the size of the as-cast grain size, control of nucleation becomes the focus of many researchers. And a finer grain size can increase the UTS, hardness, and elongation. As discussed above, it can be found that the variations of the grain size: the dendrite spacing decreases when the addition of Zn content is in the range of 1–2%, this standpoint fits with the ultimate tensile strength and elongation (Fig. 6). When the content of Zn reaches to 3%, the increase of UTS and elongation should be thanked to the transformation of the ternary phases.
As a matter of fact, in front of the solidifying interface where Zn/Y atomic enrichment in particular atomic planes, X phase, possesses LPSO structure, can be obtained when every six close-packed planes in the hexagonal close packed (hcp)-Mg provide the periodic stacking faults layers where the Zn/Y atom can be enriched for the reaction of the X phase,
Reference Wang, Gao, Song, Huang, Shi and Pan28
and the unit cell of 18R-X phase is hexagonal, with a stacking sequence of ABABCACACABCBCBCABA.
Reference Zhu, Morton and Nie10
That means the X phase is coherent with the α-Mg matrix, and X/α-Mg interfaces are not easy to debond during deformation. In fact, the orientation relationship of LPSO with the α-Mg matrix is (0001)18R//(0001)α and
 ${\left[ {010} \right]_{18{\rm{R}}}}//{\left\langle {11\bar20} \right\rangle_\alpha }$
. Due to the structural similarity between α-Mg and the X phase, we can draw a conclusion that the interface between the two phases can not be the favorable nucleation sites for micro-cracks during the deformation (Fig. 6).
As for the W phase, which possesses an FCC structure with a lattice parameter of 0.685 nm, it has a weak atomic bonding with the Mg matrix which should blamed on the asymmetry of the crystal lattice as well as the incoherence of the interface between the W phase and α-Mg. Reference Chen, Zhang, Wang, Ma and Hao9,Reference Wang, Song, Gao, Huang, Shi and Pan23,Reference Wang, Song, Gao, Wei and Pan25 So it is reasonable that the W phase is easy to crack during tensile testing because of the mismatch between the W phase and magnesium matrix. And that is why the alloys with the W phase have relatively poor comprehensive performances. Even so, as seen in Fig. 6, the Mg–4Y–3Zn alloy, with X + W phases together, shows better comprehensive properties than those only consisting of a unique X phase or W phase. Some researchers reported that the W phase has a good strengthening effect in some certain cases, Reference Chen, Zhang, Wang, Ma and Hao9,Reference Singh, Somekawa and Mukai26,Reference Wang, Gao, Song, Huang, Shi and Pan28 and it is partly because of the dispersion-strengthening of the W phase in the α-Mg matrix, especially in the alloy with lower Zn, the diffusive distribution of the W phase can pin the dislocation, hinder dislocation motion, and improve alloy intensity. As a matter of fact, it conforms to our result. As shown in Fig. 4(c), the addition of 3% Zn causes the dispersed distribution of the W phase. So, we can draw a conclusion that the W phase, just as the X phase, is a good strengthening phase as well. Reference Wang, Gao, Song, Huang, Shi and Pan28 However when the Zn content is up to 4%, there is no X phase but the W phase, in other words, we can see a much more developed W phase [comparing Figs. 4(c) and 4(d)] with a pocket becoming more obvious in the triangle boundary junctions [Fig. 4(d)], and also, we can find that the strengthening effects have disappeared from the results. The truth is the UTS and elongation of the alloy with 4% Zn are relatively lower (Fig. 6).
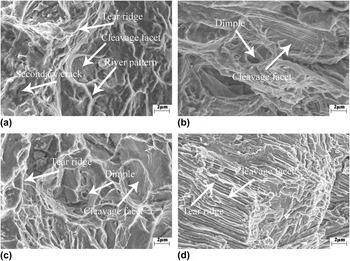
For the alloy with 1% Zn, the fracture surface is characterized by some river patterns, secondary cracks, and cleavage facets [Fig. 7(a)], also we can find a lot of short, curved tear ridges, which mean that the fracture mode of Mg–4Y–1Zn is a quasi-cleavage fracture. After 2% Zn being added, some dimples appeared on the fracture surface besides cleavage facets [Fig. 7(b)]; its fracture behavior also belongs to quasi-cleavage, and the plasticity of Mg–4Y–2Zn is better than that of Mg–4Y–1Zn. As the Zn content increased to 3%, a lot of dimples appeared and the dimples became deeper. Also, the cleavage facets became smaller and discontinuous [Fig. 7(c)], which indicated that the plasticity of Mg–4Y–3Zn has become better. Reference Zhang, Zhang, Leng, Liu, Yang, Wu and Zhang31 For the alloy with 4% Zn, there are many parallel tearing edges that can be seen on the fracture surfaces, and we can find parallel cleavage facets on both sides of every tear ridges [Fig. 7(d)] but no dimples as well as river patterns can be seen. So we can infer that the fracture behavior of this alloy is the cleavage fracture, and the plasticity of this alloy should be the worst of the four alloys, which is correspond to our results.
Fractographs of the alloys with (a) 1%, (b) 2%, (c) 3%, and (d) 4% Zn.

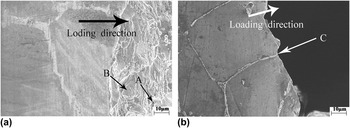
For the alloys with 2 and 4% Zn, side views of the fracture surfaces can be seen in Fig. 8. We can find that the fracture modes of these two alloys are both intergranular fractures. For the alloy with 2% Zn, dimples and fracture facets can be seen in Fig. 8(a) (marked by A and B). As the Zn content increases to 4%, we can find that the fracture is smooth, with no obvious plastic deformation, which means that its fracture belongs to brittle fracture. The W phase is not coherent with the Mg matrix Reference Wang, Song, Gao, Wei and Pan25–Reference Zhang, Liu, Wang, Le, Hu, Bao and Cui27,Reference Zhu, Chen, Wang, Wang, Liu, Liu and Hui29 and their interfaces are easy to debond during tensile testing [marked by C in Fig. 8(b)]. That is to say, the cracks propagate along the W/α-Mg interface for their poor bonding.
Side-views of the fracture surfaces of the alloys with (a) 2% and (b) 4% Zn.

IV. CONCLUSION
-
(1) When the Zn is added in the range of 1–4%, the varied phases in the Mg–Y–Zn alloys can be described as the firstly formed of X phase, and X phase, X + W phases, and W phase precipitated in order. Simultaneously, the secondary dendritic arm spacing is 27–30, 23–25, 25–26, and 37–40 μm, respectively. For the alloy with 1% Zn, the phase distribution of X is between the α-Mg dendrites, in a lath shape. And when 2% Zn is added, the amount of the second phase increases and the second phase appears in a dense fine needle shape. For Mg–4Y–3Zn, the W phase is located at the junction of the grain boundary, while the X phase is still distributed between α-Mg. When the content of Zn reaches to 4%, the W phase is more obvious at the junction of the grain boundary.
-
(2) Zn addition increased the hardness of the test alloys continuously (from 64.7 to 81.5 HV), which should be attributed to the change of the kinds and amounts of Mg–Zn–Y ternary phases, as the ternary phases are relatively hard compared to the α-Mg matrix in any case. The UTS and elongation increased when the Zn addition is in the range of 1–3%, and declined when the content reaches to 4%. The UTS and elongation of the as-cast Mg–4Y–3Zn alloys are 213.6 MPa and 11.82%, respectively.
-
(3) When the Zn addition is in the range of 1–3%, the fracture behavior of the alloys belongs to quasi-cleavage fracture and then it is transformed into a cleavage fracture when the Zn content reaches to 4%.
ACKNOWLEDGMENTS
Thanks are given to the support from The National Key R&D Program of China (No. 2016YFB0301000), Jiangsu Science and Technology Achievement Transformation Project (BA2016039), Top six talent Project of Jiangsu Province (2014-XCL-005), Suzhou science and technology development program (SGC201534), A Project Funded by the Priority Academic Program Development of Jiangsu Higher Education Institutions.