Introduction
Periphytic protozoa are common at the air–water interface, where they mediate the flux of carbon and energy from lower (bacteria and microalgae) to higher (metazoans) trophic levels as a primary consumer through the microbial food chain (Zhang et al., Reference Zhang, Xu, Jiang, Zhu and Al-Rasheid2013; Guiet et al., Reference Guiet, Poggiale and Maury2016; Zhong et al., Reference Zhong, Xu and Xu2017a, Reference Zhong, Xu and Xu2017b). Therefore, they play a crucial role in maintaining both functioning process and water quality status in aquatic ecosystems (Guiet et al., Reference Guiet, Poggiale and Maury2016).
Because of their cosmopolitan distribution, high abundance, fast growth rates and short generation time, functional diversity, ease of collection, sensitivity to environmental changes, the protozoa have been used as a reliable bioindicator of water quality in aquatic ecosystems (Xu et al., Reference Xu, Min, Choi, Jung and Park2009a, Reference Xu, Min, Choi, Kim, Jung and Lim2009b, Reference Xu, Zhang, Jiang and Yang2014; Zhong et al., Reference Zhong, Xu, Wang and Xu2014; Abdullah Al et al., Reference Abdullah Al, Gao, Xu, Wang, Warren and Xu2018a, Reference Abdullah Al, Rahman, Akthar, Alam, Sikder, Warren and Xu2018b). So far, however, monitoring surveys using protozoa there are relatively little information available in the context of tropical marine ecosystems exposed to a complex mixture of pollutants such as coastal engineering and dredging, fishing, aquaculture, maritime transport, agricultural activities (Micheli and Halpern, Reference Micheli and Halpern2005; Lotze et al., Reference Lotze, Lenihan, Bourque, Bradbury, Cooke, Kay and Jackson2006; Duong et al., Reference Duong, Feurtet-Mazel, Coste, Dang and Boudou2007; Sikder and Xu, Reference Sikder and Xu2020).
In this study, the colonization dynamics of periphytic protozoa were studied in the coastal waters of northern Bay of Bengal, Bangladesh. The objectives were to (1) determine colonization dynamics of periphytic protozoa at two water depths during winter and monsoon seasons; (2) examine vertical and seasonal variations in protozoan colonization; and (3) suggest an optimal sampling approach for bioassessment surveys using protozoa in tropical marine ecosystems.
Materials and methods
Sampling station and samples of protozoa
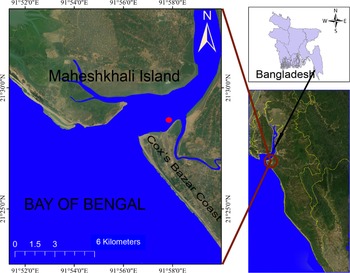
The sampling station was located in the coastal waters of northern Bay of Bengal at Cox's Bazar (GPS 21°28'42.7”N 91°57'46.1”E), near the mouth of Bakkhali river (Figure 1). During the study period, the average water depth was ~4 m and the average water transparency was ~1 m.
Map of the sampling station in the coastal waters of northern Bay of Bengal, Bangladesh.

Samples of protozoa were collected in winter (December 2020) and monsoon (July 2021) seasons using glass slides as artificial substrate after the procedure described by Xu et al. (Reference Xu, Min, Choi, Jung and Park2009a, Reference Xu, Min, Choi, Kim, Jung and Lim2009b) and Abdullah Al et al. (Reference Abdullah Al, Gao, Xu, Wang, Warren and Xu2018a, Reference Abdullah Al, Rahman, Akthar, Alam, Sikder, Warren and Xu2018b, Reference Abdullah Al, Gao, Xu, Wang, Xu and Warren2019). In brief, 240 glass slides (each 2.5 × 7.5 cm = 18.75 cm2) were fixed to 24 polyvinyl chloride frames (5 × 2.5 × 7.5 cm). Twelve frames were submerged in water in each season, six frames at 1 m depth and six frames at 2 m depth, and left for 3, 7, 10, 14, 21, and 28 days to allow periphytic protozoa to colonize on slides. These sampling depths were selected based on water transparency data. During each sampling event, two frames were randomly collected from two different depths. The PVC frames were hanged from boat jetty (act as floater) and a sinker was attached at the end of the frames hanging rope (Xu et al., Reference Xu, Zhang, Jiang, Zhu, Al-Rasheid, Warren and Song2011; Abdullah Al et al., Reference Abdullah Al, Gao, Xu, Wang, Warren and Xu2018a, Reference Abdullah Al, Rahman, Akthar, Alam, Sikder, Warren and Xu2018b). Therefore, the sinker maintained a stable vertical depth against wave action/tidal fluctuations.
After collection slides were transferred into Petri dishes containing in situ water and stored in a cool box for transport to the laboratory and then processed as soon as possible to avoid significant changes in protozoan abundance (Zhong et al., Reference Zhong, Xu and Xu2017b).
Environmental parameters
Water temperature (°C), salinity (ppt), and pH were measured instantly using test kits and thermometer. DO (mg/l), TSS (mg/l), TDS (mg/l), PO42− (mg/l), and NO3− (mg/l) were measured and calculated in the laboratory following APHA (1992).
Species identification and enumeration
Species identification and enumeration were carried out following the methods outlined by Xu et al. (Reference Xu, Zhang, Jiang, Zhu, Al-Rasheid, Warren and Song2011, Reference Xu, Zhang, Jiang and Yang2014) and Song et al. (Reference Song, Warren and Xu2009). The individual numbers were enumerated at a 10–400-fold magnification under an inverted microscope (Wang and Xu, Reference Wang and Xu2015; Xu et al., Reference Xu, Zhang and Xu2015a, Reference Xu, Zhao, Zhang and Xu2015b). Slides were examined to record species occurrences and abundances, using bright fields under light inverted microscope. The abundance was calculated from 10 glass slides in each season in each occasion and then averaging across all species pairs, and expressed as individual species number present per square centimetre (ind. cm–2).
Data analysis
The colonization process of periphytic protozoa can be fitted to the colonization equilibrium model expressed by MacArthur and Wilson (Reference MacArthur and Wilson1967):

where St = the species number at time t; Seq = the estimated equilibrium species number of protozoan colonization; G = the constant value of colonization rate; T90% = the time taken for reaching 90% Seq. Three functional parameters (Seq, G and T90%) were calculated using the statistical software SigmaPlot (v12.5).
Fitness tests were conducted to assess if the species numbers observed according to days fit with the MacArthur–Wilson model at the 0.05 significance level.
The increase of individual abundance over total experimental phase was tested if it was fitted to the logistic model:

where, Nt = the individual abundance at time t; Nmax = the carrying capacity of individual abundance (maximum abundance); r = the growth rate constant; and a = the coefficient constant of initial individual abundance; T50% = the time to reach 50% Nmax. All parameters (e.g., Nmax and T50%) were estimated using the program SigmaPlot. Fitness tests were to determine whether the individual abundance recorded at each time interval fit with the logistic model at the 0.05 significance level (Zhang et al., Reference Zhang, Xu, Jiang, Zhu and Al-Rasheid2012).
The multivariate analyses of the community structures were analysed using PRIMER v7.0.21 + PERMANOVA (Anderson et al., Reference Anderson, Gorley and Clark2008; Clarke and Gorley, Reference Clarke and Gorley2015). A shade plotting analysis in terms of relative abundances of species during colonization period summarized the species distribution, from standardized species-abundance (Anderson et al., Reference Anderson, Gorley and Clark2008; Clarke and Gorley, Reference Clarke and Gorley2015). The temporal differences in community patterns among depths and seasons during colonization period were summarized, using the submodule dbRDA (distance-based redundancy analysis). Relative abundances of species among the two water depths and seasons during colonization period summarized the vertical species distribution, from standardized species-abundance data (Anderson et al., Reference Anderson, Gorley and Clark2008; Clarke and Gorley, Reference Clarke and Gorley2015). PERMANOVA test was used for summarizing the significant vertical community variation among two seasons during the colonization period.
Multivariate correlation analysis (RELATE) was used to test the best matching analysis (BEST) to identify potential driving factors for temporal and spatial structures of the periphytic protozoan communities using the routine BIOENV which were analysed using the program PRIMER (v7.0.21) + PERMANOVA add on (Anderson et al., Reference Anderson, Gorley and Clark2008; Clarke and Gorley, Reference Clarke and Gorley2015).
A univariate correlation matrix (Pearson) was used to summarize the significant relationship with environmental variables from log-transformed data.
Results
Taxonomic composition and species distribution
A total of 61 species of protozoans were identified at two depths of 1 and 2 m during the study period. Of these, 32 species occurred in winter and 58 species in monsoon season at two depths of 1 and 2 m. The species composition, species distribution in terms of present/absent and ecological types are summarized in Table S1.
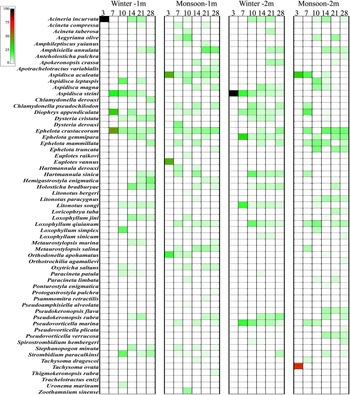
In terms of relative abundance, the shade plotting analysis showed that the colonization processes of the protozoan community represented a dynamic pattern with respect to two water depths and seasons (Figure 2).
Shade plotting analyses showing species distribution using group-average clustering on Bray–Curtis similarities on fourth root transformed/standardized relative abundance data of each species within the protozoan communities in two seasons and at two depths.

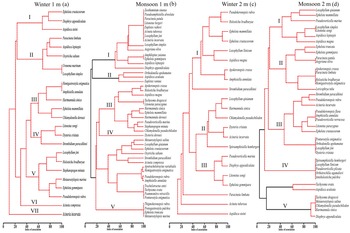
Four dendograms of the species distribution in the samples of two seasons were plotted using group-average clustering from the index of associations on square root transformed species-abundance data (Figure 3). The cluster analysis revealed 24 species at 1 m in winter falling into seven groups (I–VII) at the 50% similarity level: the protozoa of group I to V were composed of 22 dominant ciliates with high abundance and/or occurrence, and other groups represented the assemblages with low abundance and occurrence (Figure 3a). At a depth of 1 m in monsoon season, 47 species were falling into five groups (I–V), where 42 species dominate with high abundance and/or occurrence, and other groups represented the assemblages with low abundance and occurrence (Figure 3b). At a depth of 2 m in winter season, 22 species were assigned to three groups (I–III). At 2 m in monsoon, 40 protozoans composed of five groups (I–V). In both samples, groups I to III included 19 and 28 dominant species, respectively. The assemblages of other groups represented with low abundance and occurrence (Figure 3c, d).
Dendograms of species distribution using group average clustering on index of associations on fourth-root transformed/standardize data of each species within the periphytic protozoa in two seasons and at two depths.

In terms of relative abundance, a significant seasonal and vertical variation (P < 0.05) in protozoan community was noted between the two depths and seasons (Fig. S1).
As for relative abundance, three types were identified: (1) those dominated by Exogenida before 21 days followed by Euplotida (at 1 m, winter season); (2) those dominated by Dysteria before 21 days followed by Urostylida (at 1 m, monsoon season); and (3) those dominated by Euplotida before 21 days followed by Exogenida (at 2 m, both in winter and monsoon seasons) (Fig. S1)
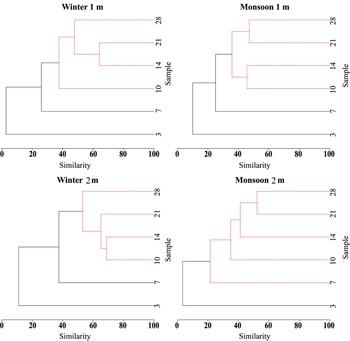
SIMPROF tests revealed that the colonization process of periphytic protozoa was clearly assigned into different stages in both seasons and depths: the initial stage (3 d), the transitional stage (7 d) (Figure 4) and the equilibrium stage (10–28 d); the latter differed among the seasons and depths (Figure 4).
Cluster analyses with SIMPROF tests showing variation in each of the colonization stage in each season of periphytic protozoa during the colonization process in two seasons and at two depths.

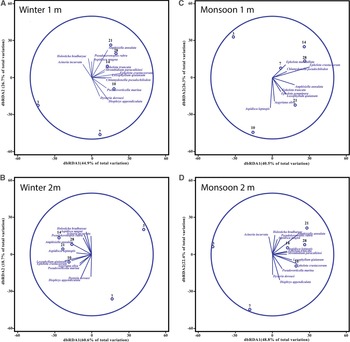
The dbRDA ordinations indicated that there were different colonization patterns of protozoan communities between two seasons and depths (Figure 5). PERMANOVA test demonstrated a significant difference in colonization patterns among seasons and depths (P < 0.05).
Distance-based redundancy analyses showing seasonal variations in community patterns during the colonization process in two seasons and at two depths.

Colonization curves and growth curves
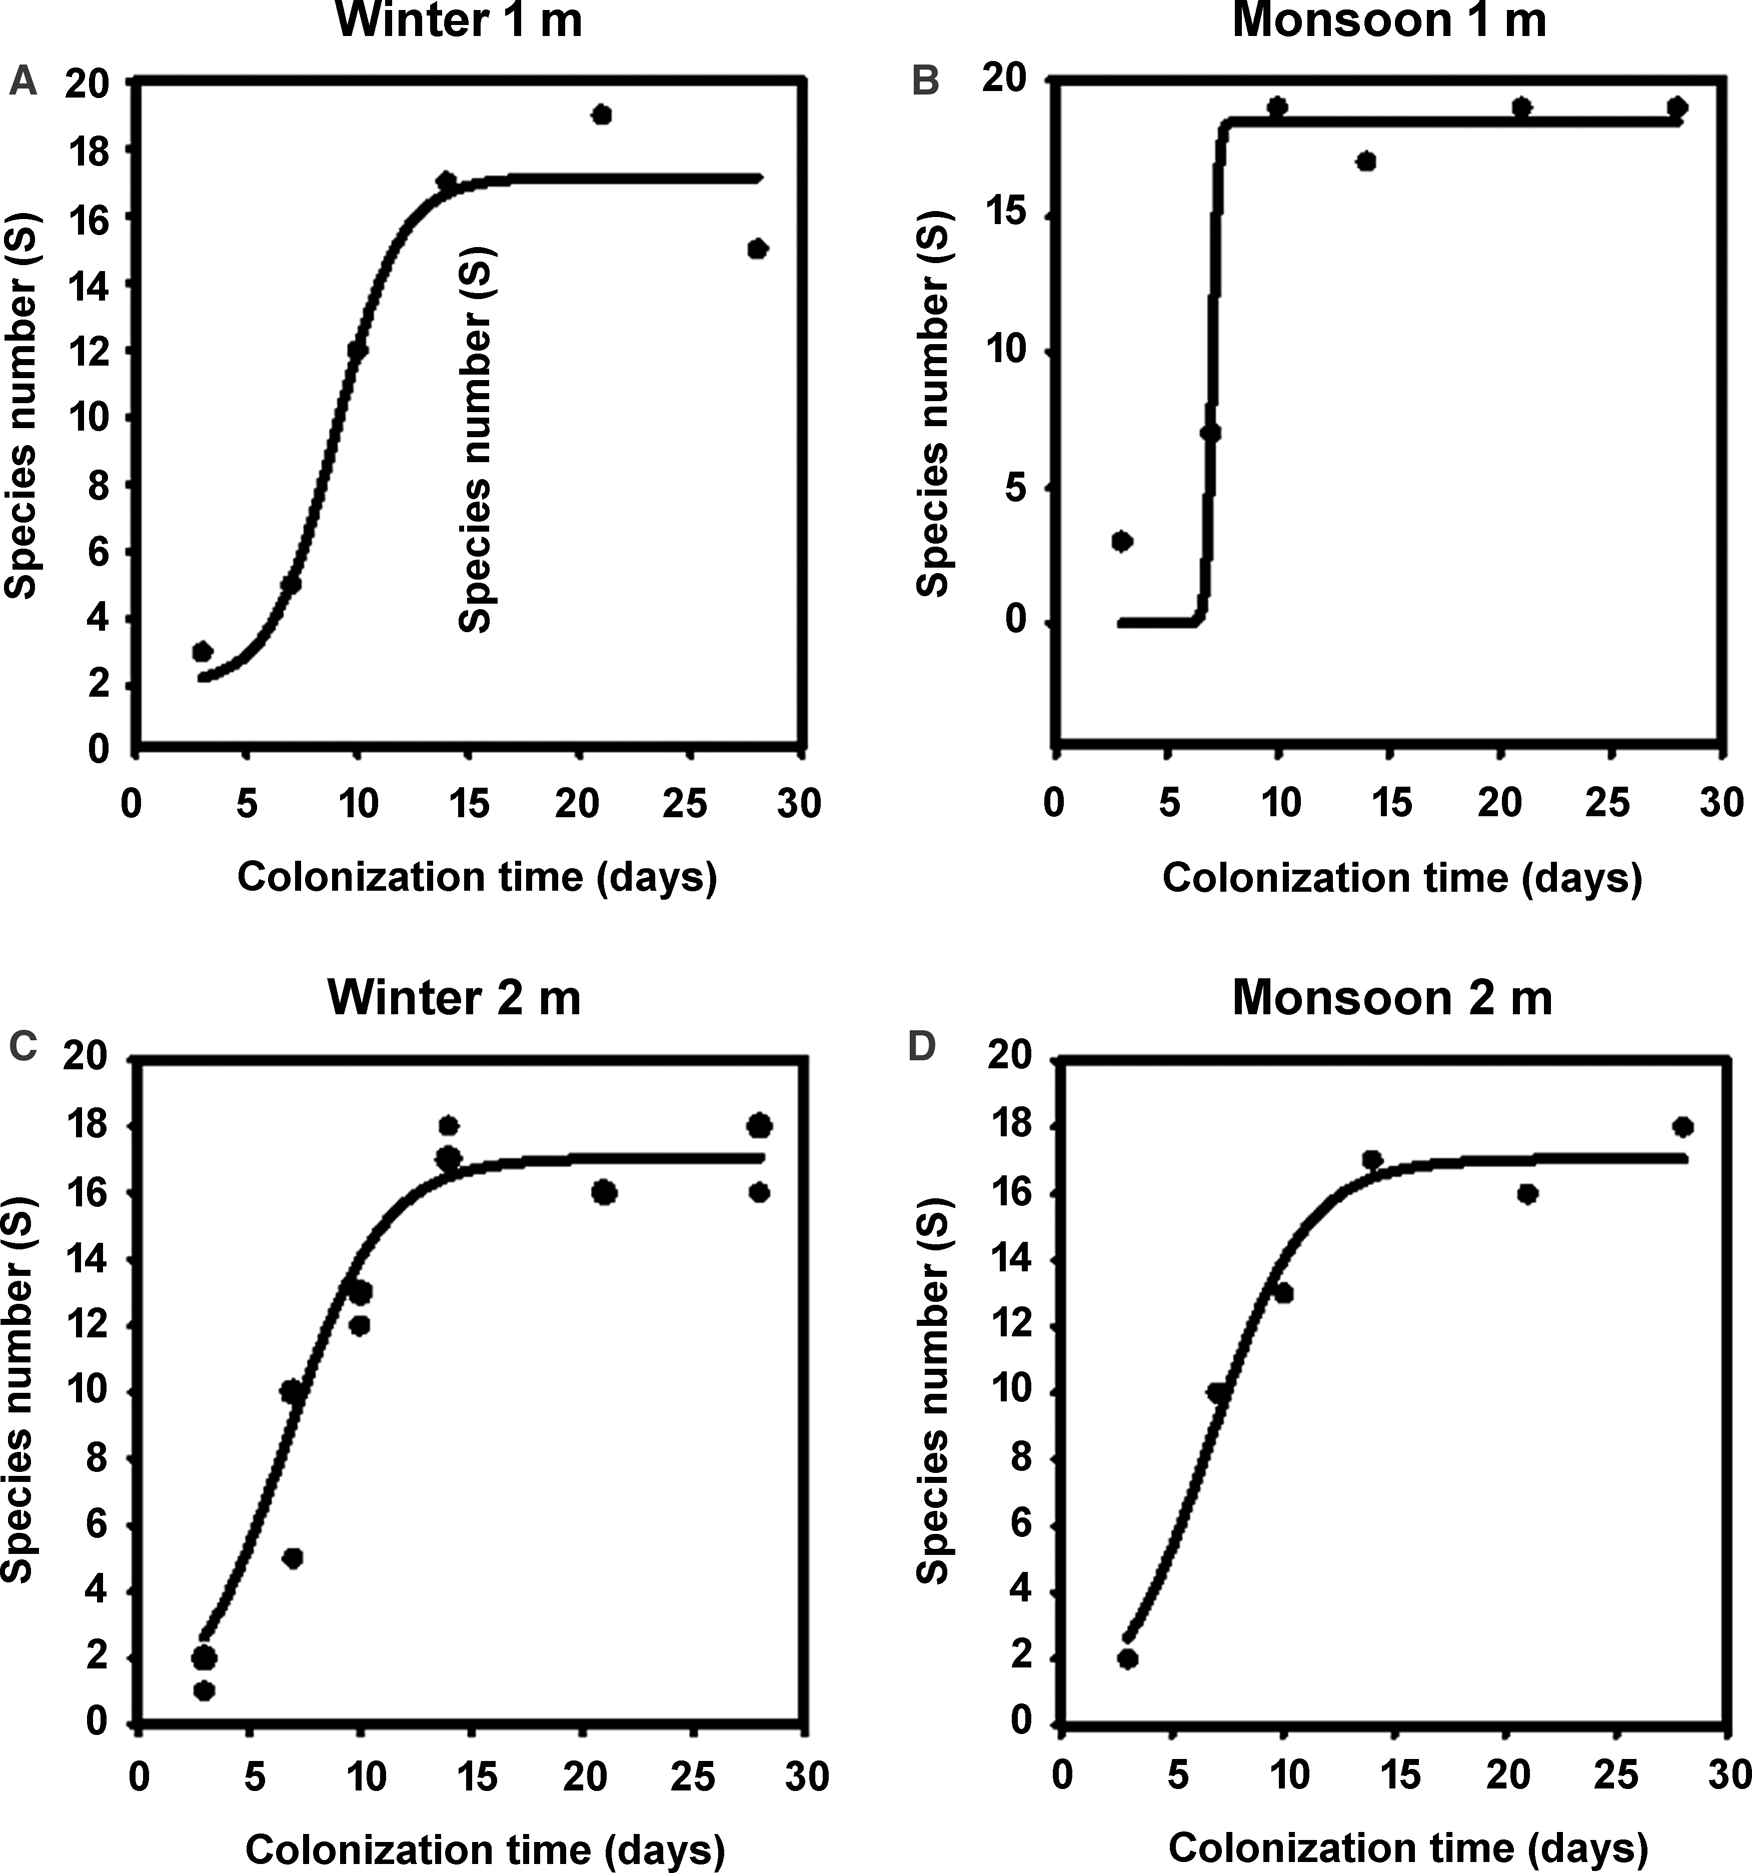
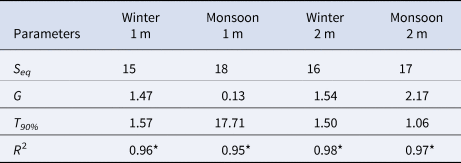
The colonization curves fitness of periphytic protozoa are summarized in Figure 6. Regression analysis confirmed that the colonization processes at depths of 1–2 m were well fitted to MacArthur–Wilson model and divided into three successive stages such as initial, transitional and equilibrium, while the data were not fitted to the model at a depth of 1 m in monsoon (Figure 6). For example, colony formation on slides for reaching to equilibrium stage occurred either 10 or 14 days at 1 and 2 m in winter and at a depth of 2 m in monsoon, although regression value at a depth of 1 m in monsoon was closed to other depths and season but non-fitness to the model (Figure 7).
Colonization curves of periphytic protozoa at 1 m and 2 m in winter and monsoon seasons. (a) Winter 1 m (initial at day 3–7; transition at day 7–10; equilibrium at day 14–28); b, Monsoon 1 m (initial at day 3–7; transition at day 7–10; equilibrium at day 10–28); c, Winter 2 m (initial at day 3; transition at day 7–14; equilibrium at day 14–28); and d, Monsoon 2 m (initial at day 3; transition at day 7–14; equilibrium at day 14–28).

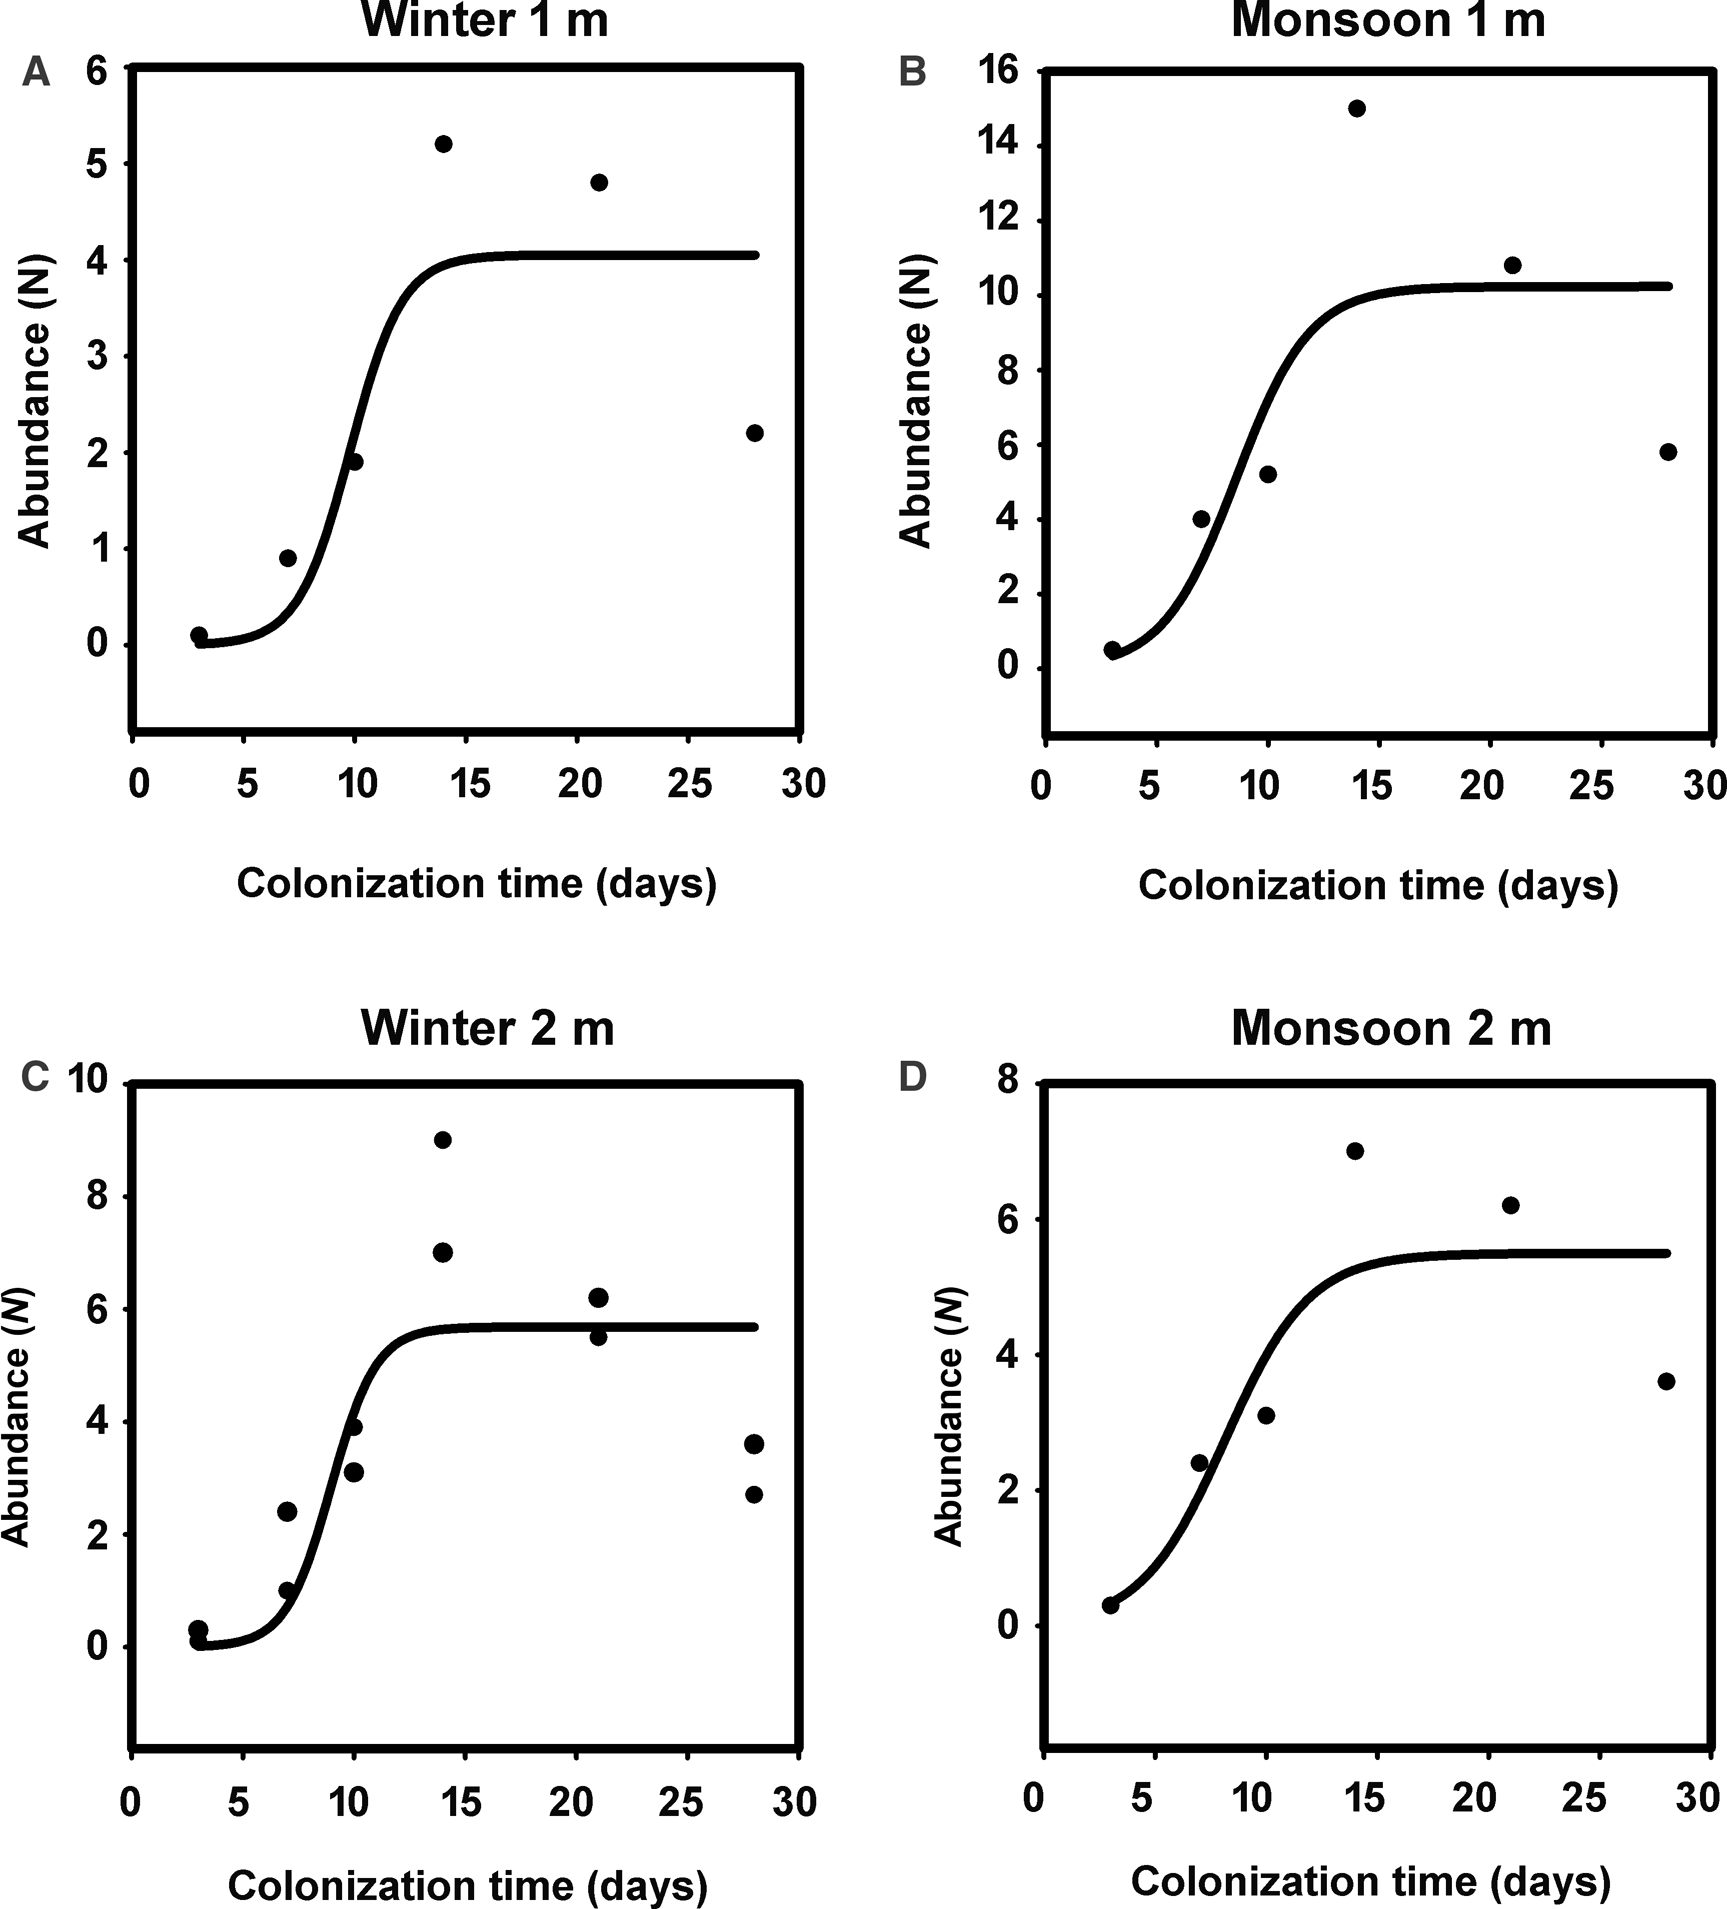
Growth curves of periphytic protozoa at 1 m and 2 m in winter and monsoon seasons. a, Winter 1 m; b, Monsoon 1 m; c, Winter 2 m; and d, Monsoon 2 m.

Three functional parameters based on the MacArthur and Wilson model, equilibrium species number (Seq), colonization rate constant (G), and time required to reach 90% Seq (T 90%) are shown in Table 1. The colonization rates (G values) arranged from 0.13 to 2.17 with a short T 90% values (10–13 days) compared to those at a depth of 1 m in monsoon season (Table 1).
Colonization curve fitness to the Mac-Arthur and Wilson model for periphytic protozoa at depths of 1 and 2 m during winter and monsoon seasons

Seq, the estimated equilibrium species number of ciliates colonization; G, the growth colonization rate constant; T90%, the time (days) taken for reaching 90% Seq; R 2, regression coefficients; *significant difference at 0.05 level.
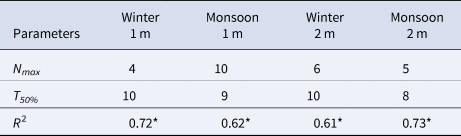
Regression analysis on growth curves revealed that the increasing process of abundances well fitted to the logistic model at two depths and seasons (P < 0.05). The projected maximum values of abundances (Nmax) had a decreasing trend from depths of 1 to 2 m in different seasons, while the values levelled off (11–14 days) at depths of 1 and 2 m both in winter and monsoon seasons (Figure 7, Table 2).
Increase curve fitness to the logistic model for periphytic protozoa at depths of 1 m and 2 m during winter and monsoon seasons

Nmax, the carrying capacity of abundance or maximum abundance; T50%, time (days) for the half of the maximum abundance; R 2, regression coefficients; *significant difference at 0.05 level.
Relationship between spatial pattern and environmental parameters
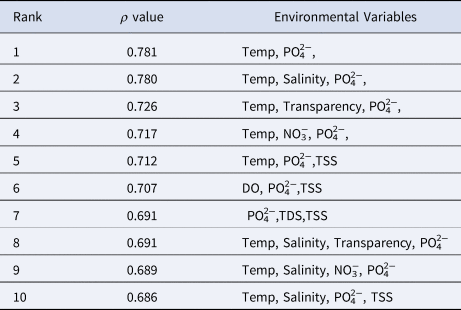
Multivariate correlation (RELATE) analysis suggested that there was a significant correlation between spatial patterns of environmental variables of the periphytic protozoa (correlation coefficient ρ = 329; P = 0.01). Besides, the best matching (BIOENV) analysis revealed that the spatial and vertical variation of the protozoan community were significantly driven by temperature, salinity, and transparency, either alone or combined with NO3−, PO42−, TDS, TSS, and DO (Table 3).
Summary results of the biota-environment matching analysis (BIOENV) showing the 10 best matches of environmental variables with spatial variations of the periphytic protozoa with respect to two water depths and seasons

ρ, Spearman coefficient; Statistical significant level at 0.05 (P < 0.05).
Discussion
Previous studies have demonstrated that the ecosystem functions of protozoan fauna are well linked to environmental heterogeneity mainly due to food supply (Sonntag et al., Reference Sonntag, Posch, Klammer, Teubner and Psenner2006; Xu et al., Reference Xu, Zhong, Abdullah Al, Warren and Xu2018; Abdullah Al et al., Reference Abdullah Al, Gao, Xu, Wang, Xu and Warren2019). In this study, the distribution of protozoan species composition and community structure showed significant seasonal and vertical variations with the environmental heterogeneity in winter and monsoon seasons at different depths.
The community structures of periphytic protozoa can be shaped by water depths despite mixing of water among different layers in coastal waters (Franco et al., Reference Franco, Esteban and Téllez1998; Abdullah Al et al., Reference Abdullah Al, Gao, Xu, Wang, Warren and Xu2018a, Reference Abdullah Al, Rahman, Akthar, Alam, Sikder, Warren and Xu2018b). The abundances of microalgae in biofilms are high in surface layers with high sunlight intensity, while the periphytic and planktonic bacteria are abundant in deep layers (Coppellotti and Matarazzo, Reference Coppellotti and Matarazzo2000; Eisenmann et al., Reference Eisenmann, Pivarnik and Malina2001; Petchey et al., Reference Petchey, Beckerman, Riede and Warren2008; Abdullah Al et al., Reference Abdullah Al, Gao, Xu, Wang, Warren and Xu2018a, Reference Abdullah Al, Gao, Xu, Wang, Xu and Warren2019). Abdullah Al et al. (Reference Abdullah Al, Gao, Xu, Wang, Xu and Warren2019) considered the abundances and composition of food supply as the driver to shift the community patterns of periphytic protozoa at different layers of water columns in coastal waters. In the present study, the colonization processes of protozoan communities represented different dynamics at depths of 1 and 2 m during winter and monsoon seasons. This implies that water depths and different seasons might be alternated the colonization process of protozoan communities due to influence of food supply under different sunlight conditions in water columns in different seasons.
Multivariate approaches are effective tools for summarizing seasonal and vertical variations in community patterns (Anderson et al., Reference Anderson, Gorley and Clark2008; Clarke and Gorley, Reference Clarke and Gorley2015; Abdullah Al et al., Reference Abdullah Al, Gao, Xu, Wang, Xu and Warren2019; Sikder et al., Reference Sikder, Bai, Warren and Xu2019a). In this study, dbRDA ordinations revealed that the colonization process at a depth of 1 m both in winter and monsoon seasons was clearly categorized into three successive stages. This finding was consistent with the reports of Xu et al. (Reference Xu, Min, Choi, Jung and Park2009a, Reference Xu, Min, Choi, Kim, Jung and Lim2009b), Mieczan (Reference Mieczan2010) and Zhang et al. (Reference Zhang, Xu, Jiang, Zhu and Al-Rasheid2012, Reference Zhang, Xu, Jiang, Zhu and Al-Rasheid2013). However, PERMANOVA test revealed that the colonization patterns represented a significant difference between both depths in winter than monsoon. Thus, these findings suggest that a depth of 1 m in winter is the best sampling strategy for bioassessment surveys using protozoa in tropical marine ecosystems.
The functional parameters based on colonization analysis are valuable indicators for assessing the carrying capacity with external organic load/toxic levels of tropical marine ecosystems (Zhang et al., Reference Zhang, Xu, Jiang, Zhu and Al-Rasheid2012, Reference Zhang, Xu, Jiang, Zhu and Al-Rasheid2013). For example, the lower the levels of pollution, the higher the values of S eq and G (Xu et al., Reference Xu, Min, Choi, Jung and Park2009a, Reference Xu, Min, Choi, Kim, Jung and Lim2009b; Burkvoskii et al., Reference Burkvoskii, Mazei and Esaulov2011; Zhang et al., Reference Zhang, Xu, Jiang, Zhu and Al-Rasheid2012, Reference Zhang, Xu, Jiang, Zhu and Al-Rasheid2013, Sikder et al., Reference Sikder, Abdullah Al, Xu, Hu and Xu2019b, Reference Sikder, Abdullah Al, Hu and Xu2019c). In this study, the colonization rate (G), S eq, and N max showed a clear vertical and seasonal variability from a depth of 1–2 m in water columns. The highest values of colonization rates (G), equilibrium species number (S eq), and carrying capacity (N max) were found at 1 m depth, while the lower values were measured at 2 m depth. However, these parameters generally levelled off at stable values at both depths. Thus, this implies that availability of food supply due to light intensity in deeper water might influence the colonization succession with lower abundance and higher variability at different depths. Another reason might be due to organic load since higher organic pollutants can minimize the carrying capacity of an ecosystem (Burkovskii and Mazei, Reference Burkovskii and Mazei2001; Burkvoskii et al., Reference Burkvoskii, Mazei and Esaulov2011).
In summary, the colonization processes of protozoa were generally assigned into three stages at two depths in two seasons: the initial (3 days), transitional (7 days), and equilibrium (10–28 days) stages. The regression analyses demonstrated that the colonization dynamics were fitted to the MacArthur–Wilson model and logistic equation. The species richness reached an equilibrium after 10–14 days and maximum abundances were high at a depth of 1 m. These findings suggest that a depth of 1 m in winter is comparatively more useful reference for bioassessment surveys using protozoa in tropical marine ecosystems.
Supplementary material
The supplementary material for this article can be found at https://doi.org/10.1017/S0025315423000528.
Acknowledgements
This work was funded by ‘Research and Publication Cell, University of Chittagong, Bangladesh’, and special thanks for the Ministry of Education of China and Chinese Scholarship Council (CSC) P. R. China.
Author's contributions
M. J. H. B. and M. N. A. S. carried out the field works and laboratory experiments (sample collection, preparations, identification, data collection etc.). M. N. A. S., S. M. B. H., A. S. M. S., and S. A. U. compiled the whole data sets and completed the analyses. M. N. A. S. and H. X. wrote the manuscript. S. M. S. reviewed and edited the manuscript.
Competing interest
None.