1 Introduction
The time evolution of aggregate economic variables, such as stock prices, is affected by market expectations of individual investors. Neoclassical economic theory assumes that individuals form expectations rationally, thus forcing prices to track economic fundamentals and leading to an efficient allocation of resources. This tradition, which goes back to seminal work by Muth (Reference Muth1961), has a strong theoretical appeal. Unfortunately, this approach also shifts economists’ attention from many interesting short- or medium-run phenomena, such as imperfect learning or herding behavior, which lie outside the domain of full rationality.
Even before rational expectations became a leading paradigm in economics, Simon (Reference Simon1957) argued that rationality imposes unrealistically strong informational and computational requirements upon individual behavior. Furthermore, the rational expectations approach leaves open the question of how people acquire these expectations and, if they do through experience, how the economy behaves during the learning process. Laboratory experiments with human subjects, which allow researchers to analyze this process directly, have shown that individuals do not behave fully rationally, but instead follow simple heuristics (see, e.g. Tversky and Kahneman (Reference Tversky and Kahneman1974) and the Nobel prize lecture by Kahneman, Reference Kahneman2003). These heuristics can account for persistent biases in decision making. This explains why, in laboratory markets, prices may show persistent deviations from fundamentals, similar to the large swings observed in real stock prices.
On the theoretical side, a number of models of bounded rationality have been developed in different fields, see Conlisk (Reference Conlisk1996) for a comprehensive review. In macroeconomics, Sargent (Reference Sargent1993) and Evans and Honkapohja (Reference Evans and Honkapohja2001) advocate the use of different forms of adaptive learning, under which agents do not know the true economic ‘law of motion’ but apply econometric techniques for learning it. In game theory Arthur (Reference Arthur1991) and Erev and Roth (Reference Erev and Roth1998) explain a number of experiments by simple reinforcement-learning models, in which agents choose strategies on the basis of their past success.
All these approaches can be expressed in terms of behavior of a single, representative agent, and leave, therefore, no space for heterogeneity of participants, which is also often found in experiments. But heterogeneity might be crucial for explaining a number of striking findings of the recent ‘learning to forecast’ experiments, described at length in Hommes et al. (Reference Hommes, Sonnemans, Tuinstra and Velden2005). In a stationary environment during 50 periods, participants had to predict the price of a risky asset (say a stock) having knowledge of the fundamental parameters (mean dividend and interest rate) and previous price realizations, but without knowing the forecasts of others. If all agents behaved rationally or learned to behave rationally, the market price would quickly converge to a constant fundamental value p f = 60. While in some groups convergence did happen, in other groups prices persistently fluctuated (see Figure 1, Left). What was even more striking is that in all groups individuals were able to coordinate their forecasts (see Figure 2, Left).
Laboratory experiments and heuristics-switching model simulations. Prices (Left) for laboratory experiments (points) and evolutionary model (lines). Fractions (Right) of four forecasting heuristics: adaptive expectations (ADA, circles), weak trend followers (WTR, squares), strong trend followers (STR, triangles), and learning anchoring and adjustment heuristic (LAA, bars). Coordination of individual forecasts explains three different aggregate market outcomes: monotonic convergence to equilibrium (Top), permanent oscillations (Middle), and oscillatory convergence (Bottom). Oscillations may be triggered by initial prices, are reinforced when the initial fraction of weak and strong trend heuristics is relatively large, and may be sustained by the LAA heuristic

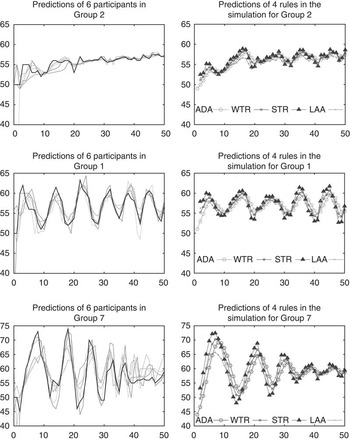
Coordination in laboratory experiments and model simulations. Individual predictions of six participants in the laboratory experiments (Left) and predictions of four forecasting heuristics in evolutionary heuristics-switching model (Right). Heuristics are: adaptive expectations (ADA, circles), weak trend followers (WTR, squares), strong trend followers (STR, triangles) and learning anchoring and adjustment heuristic (LAA, bars). Coordination of individual forecasts arises both in the experiment and in the simulation model in all observed aggregate outcomes: monotonic convergence to equilibrium (Top), permanent oscillations (Middle), and oscillatory convergence (Bottom)

In this paper, we present evidence that evolutionary selection among simple heterogeneous forecasting heuristics can explain coordination of individual behavior, leading to three different aggregate outcomes: slow monotonic price convergence, persistent price oscillations, and oscillatory dampened price fluctuations. In our model forecasting strategies are selected every period from a small population of plausible heuristics, such as adaptive expectations (ADA) and trend-following rules. Individuals adapt their strategies over time, based on the relative forecasting performance of the heuristics. As a result, the evolutionary switching mechanism exhibits path dependence and matches individual forecasting behavior as well as aggregate market outcomes in the experiments. The only differences between the model simulations in Figures 1 and 2 are the initial prices and the initial distribution over the heuristics.
The paper is organized as follows. Section 2 describes the experiment from Hommes et al. (Reference Hommes, Sonnemans, Tuinstra and Velden2005). In Section 3, the evolutionary model is introduced, and its various assumptions are discussed. Model simulations are performed in Section 4. Section 5 is devoted to the stability analysis of the deterministic skeleton of the model, while Section 6 investigates how well the model fits the experimental data. Final remarks are given in Section 7.
2 Laboratory experiment
A number of sessions of a computerized ‘learning to forecast’ experiment were performed in the CREED (Center for Research in Experimental Economics and Political Decision Making) laboratory at the University of Amsterdam; see Hommes et al. (Reference Hommes, Sonnemans, Tuinstra and Velden2005) for a detailed description. In each session of the experiment, six participants had to predict the price of an asset for 51 periods and were rewarded according to the accuracy of their predictions. The participants were told that they are advisers to a pension fund and that this pension fund can invest money either in a risk-free asset with real interest rate r per period or in shares of an infinitely lived risky asset. In each period the risky asset pays uncertain dividend which is a random variable, independent identically distributed, with mean  . The price of the risky asset, pt, is determined by a market-clearing equation on the basis of the investment strategies of the pension fund. The exact functional form of the strategies and the equilibrium equation were unknown to the participants, but they were informed that the higher their forecast is, the larger will be the demand for the risky asset of the pension fund. Participants also knew the values of the parameters r = 0.05 and
 , and therefore had enough information to compute the rational fundamental price (i.e. the discounted sum of the expected future dividend stream) of the risky asset
 .
Every session of the experiment lasted 51 periods. In every period each of the six participants provided a two-period-ahead forecast for the price of the risky asset, given the available information. This information consisted of past prices (up to two lags) of the risky asset and own past predictions (up to one lag) made by the participant. Participants did not know the predictions of other participants, neither did they know exactly how their own forecast affected the equilibrium price. When all six predictions for the price in period t + 1 had been submitted, the current market-clearing price was computed according to a standard model of asset pricing, see e.g. Brock and Hommes (Reference Brock and Hommes1998):

where  denotes an (equally weighted) average of the six individual forecasts, r(=0.05) is the risk-free interest rate,
 is the mean dividend, εt is a stochastic term representing small demand and supply shocks, and nt stands for a small fraction of ‘robot’ traders who always submit a fundamental forecast p f. These robot traders were introduced as a ‘stabilizing force’ in the experiment to prevent the occurrence of large bubbles. The fraction of robot traders increased as the price moved away from its fundamental equilibrium level:

This mechanism reflects the feature that in real markets there is more agreement about over- or undervaluation when the deviation from the fundamental is large. At the end of each period every participant h was informed about the realized price, and his/her earnings were defined by a quadratic scoring rule:

There were seven sessions of the experiment. The stochastic shocks εt were the same in all sessions (normally distributed, with mean 0 and standard deviation 0.5).
2.1 Findings of the experiment
The main findings of the experiment are as follows. First, realized asset prices differed significantly from the rational fundamental price in all sessions. Comparison of the experiment with prediction of the rational expectations model shows that on average the asset was undervalued. Furthermore, prices exhibited excess volatility, with much larger swings than the rational expectations model.
Second, three different price patterns were observed, see Figure 1 (Left). In group 2 (Top) and group 5 (not shown) the price of the asset slowly converged, almost monotonically, to the fundamental price. In group 1 (Middle) and group 6 (not shown) the price oscillated around the fundamental price with an (almost) constant amplitude. In group 4 (not shown) and group 7 (Bottom) large initial fluctuations were observed, dampening slowly toward the end of the experimentFootnote 1.
Third, the analysis of the individual price predictions reveals that during each session the participants were able to coordinate on a common prediction strategy, as illustrated in Figure 2 (Left). Finally, estimation of the individual predictions, based on the last 40 observations to allow for a short learning phase, showed that participants had a tendency to use simple, linear forecasting rules, such as naive expectations (i.e. the forecast is simply the last observed price) and ADA (a weighted average of the last observed price and the last forecast). Many participants only used the two most recently observed prices, for example, in a simple linear trend-extrapolation forecasting rule.
3 Evolutionary model
In our simulation model, agents will select rules from a population of simple forecasting rules or heuristics. The choice of heuristics will be governed by an evolutionary selection mechanism, based on the principle that more successful strategies will attract more followers. Strategy performance is measured by accumulated (negative) squared prediction errors, in line with the payment incentives in the laboratory experiments.
3.1 Forecasting heuristics
To keep our model as simple as possible, but rich enough to explain the different observed price patterns, we have chosen only four heuristics, which are intuitively simple and were among the rules estimated on the individual forecasts in the experiment. A behavioral interpretation underlies each heuristic. The first heuristic is an ADA rule, using a weighted average between the last observed market price and the last individual forecast. Note that at the moment when forecasts of price pt + 1 are submitted, price pt is still unknown (see Equation (1)) and the last observed price is pt − 1. At the same time, the last own forecast  is known when forecasting pt + 1. We have chosen the following ADA rule:

The second and third heuristics are trend-following rules, extrapolating a weak or a strong trend, respectively. They simply predict the last observed price level plus a multiple of the last observed price change, and only differ in the magnitude of the extrapolation factor. In the case of the weak trend rule (WTR) the factor is small and equal to 0.4, so that the rule is

The strong trend rule (STR) has a larger extrapolation factor 1.3 and is given by

The fourth heuristic is slightly more complicated. It combines an average prediction of the last observed price and an estimate of the long-run equilibrium price level with an extrapolation of the last price change. More precisely, the rule is given by

where  is the sample average of all past prices, that is,
 . This rule is a learning anchoring and adjustment heuristic (LAA), since it uses a (time varying, learnable) anchor or reference point,
 , defined as an (equally weighted) average between the last observed price and the sample mean of all past prices, and extrapolates the last price change
 from there. Tversky and Kahneman (Reference Tversky and Kahneman1974) have shown that people often rely on such anchoring and adjustment heuristics. The LAA rule has been obtained from a related linear anchoring and adjustment heuristic (AA):

For some individuals in the experiment the estimated individual forecasting rule was an AR(2) rule very close to the specification in Equation (8). In the experiment, however, subjects did not know the fundamental price p f explicitly, but apparently were able to learn the anchor  and extrapolate price changes from there. Therefore, we replaced p f in the AA rule (8) by its proxy,
 , given by the observed sample average of prices to obtain the LAA rule (7)Footnote 2.
All these heuristics are first-order heuristics in the sense that they only use the last observed price level, the last forecast, and/or the last observed price change.
3.2 Evolutionary switching
Which forecasting heuristics from the population should agents choose? Our simulation model is based upon evolutionary switching between the four forecasting heuristics, driven by the past relative performance of the heuristics. Heuristics that have been more successful in the past will attract more followers. The performance measure is (minus) squared forecasting errors, similar to the financial rewards in the experiment. The performance of heuristic h, 1 ⩽ h ⩽ 4, up to (and including) time period t is given by

The parameter 0 ⩽ η ⩽ 1 measures the relative weight agents give to past errors and thus represents their memory strength. When η = 0, only the performance of the last period plays a role in the updating of the shares assigned to the different rules. For 0 < η ⩽ 1, all past prediction errors affect the heuristic's performance.
Given the performance measure, the weight assigned to rule h is updated according to a discrete choice model with asynchronous updating (Diks & Weide, Reference Diks and Weide2005; Hommes et al., Reference Hommes, Huang and Wang2005):

where  is a normalization factor. There are two important parameters in Equation (10). The parameter 0 ⩽ δ ⩽ 1 gives some persistence or inertia in the weight assigned to rule h, reflecting the fact that not all the participants are willing to update their rule in every period. Hence, δ may be interpreted as the fraction of individuals who stick to their previous strategy. In the extreme case δ = 1, the initial weights assigned to the rules never change, no matter what their past performance is. If 0 ⩽ δ ⩽ 1, in each period a fraction 1 − δ of participants updates their rule according to the well-known discrete choice model used, for example, in Brock and Hommes (Reference Brock and Hommes1997). The parameter β ⩾ 0 represents the intensity of choice, measuring how sensitive individuals are to differences in strategy performance. The higher the intensity of choice β, the faster individuals will switch to more successful rules. In the extreme case β = 0, the fractions in Equation (10) move to an equal distribution independent of their past performance. At the other extreme β = ∞, all agents who update their heuristic (i.e. a fraction 1 − δ) switch to the most successful predictor.
In the evolutionary heuristics-switching model the price pt in period t is computed as

where  are the predictions for period t + 1 according to the four heuristics in Equations (4)–(7),
 are the fractions using these heuristics described by Equations (9)–(10), nt stands for a small fraction of ‘robot’ traders described by Equations (2), r = 0.05 is the risk-free interest rate,
 is the mean dividend, p f = 60 is the fundamental price, and εt is the stochastic term representing small demand and supply shocks (taken to be the same as in the experiment).
3.3 Model initialization
The model is initialized by two initial prices, p 0 and p 1, and initial weights n 1,h, 1 ⩽ h ⩽ 4 (summing to 1; the initial share of robot traders n 1 = 0). Given p 0 and p 1, the heuristics forecasts can be computed and, using the initial weights of the heuristics, the price p 2 can be computed. In the next period, the forecasts of the heuristics are updated, the fraction of robot traders is computed, while the same initial weights n 1,h for individual rules are used (past performance is not well defined yet in period 3). The price p 3 is computed and the initialization stage is finished. Starting from period 4 the evolution according to Equation (11) is well defined: first the performance measure in Equation (9) is updated, then the new weights of the heuristics are computed according to Equation (10), and finally a new price is determined by Equation (11).
4 Model simulations
Three different patterns emerged in the same experiment. An explanation for this finding that we propose in this paper is that heterogeneous learning, formalized in Section 3, has the path-dependence property. To stress the path dependence, we simulate the model for a fixed set of parameters: β = 0.4, η = 0.7, δ = 0.9. The simulations differ only in initial conditions, that is, in the two initial prices and in the initial distribution of agents over the population of heuristics. For the three simulations shown in Figures 1 and 2 the initial conditions are as follows:
• for group 2 with monotonic convergence: initial prices: p 0 = 49, p 1 = 50.5; initial shares n 1,1 = n 1,4 = 0.25, n 1,2 = 0.35 and n 1,3 = 0.15;
• for group 1 with persistent oscillations: initial prices: p 0 = 51, p 1 = 54; initial shares n 1,1 = n 1,4 = 0.15, n 1,2 = n 1,3 = 0.35;
• for group 7 with dampened oscillations: initial prices: p 0 = 44, p 1 = 48; initial shares n 1,1 = 0, n 1,2 = n 1,4 = 0.17 and n 1,3 = 0.66.
We stress that, at this stage, no fitting exercise has been performed. All plots were easily obtained through some trial-and-error experimentation with different initial conditions and parameters. In particular, we experimented with initial prices {p 0,p 1} close to the prices observed in the first two rounds of the corresponding experimental group. The initial shares of heuristics were chosen in such a way to match the trend patterns observed in the corresponding group during first few periods. For all simulations, we use the same realizations  of the noise as in the experiment.
Figure 1 shows realized prices (Left panel) for both the experiments and the heuristics-switching model, as well as the shares (Right panel) of the four heuristics. The switching-heuristics model indeed exhibits path dependence, since the simulations only differ in initial states. In particular, the initial distribution over the population of heuristics is important in determining which pattern is more likely to emerge. The model is capable of reproducing all three qualitatively different price patterns observed in the experiments, that is, monotonically converging prices, permanent oscillations, and dampened oscillationsFootnote 3. This path-dependent feature of the model remains valid for a large range of parameters. Qualitatively the simulation results are robust with respect to the parameters, but some quantitative features, such as the speed of convergence or the amplitude and frequency of oscillations, may change when parameters are varied. Figure 2 shows the individual forecasts in the experiments (Left panel) as well as the forecasts of the four heuristics (Right panel). Similar to the experiments, in the simulation model coordination of forecasts arises.
In the case of monotonic convergence (see the upper panels of Figure 1), the weights of all four heuristics remain relatively close during the simulations, causing slow, almost monotonic, convergence of the price to its fundamental equilibrium p f = 60. The increase of the price together with a series of subsequent positive shocks εt leads to a temporary slight domination of the STR heuristic between periods 13 and 23. However, this rule overestimates the price trend so that, ultimately, the adaptive heuristic takes the lead, and price converges to its fundamental level. In the simulations for the groups with constant oscillations (see the middle panel), the weak and strong trend followers represent the largest proportions in the initial distribution of heuristics, and aggregate prices rise. However, after only five periods the impact of the LAA heuristic starts to increase, because it predicts better than the static strong and weak trend followers, who either overestimate or underestimate the price trend. The impact of the AA heuristic gradually increases, and it dominates the market within 10 periods, rising to more than 70% after 40 periods. Our switching-heuristics model thus explains coordination of individual forecasts as well as persistent price oscillations around the long-run equilibrium level. Finally, in the last simulation (see the lower panel) a large initial impact of (strong) trend followers leads to a strong rise of market prices in the first seven periods, followed by large price oscillations. Relatively quickly, however, after only period 10, the impact of the STR decreases, while the impact of the LAA heuristic rises to more than 80% after 30 periods. Once again, the flexible AA heuristic forecasts better than the static strong trend-following rule, which overestimates the price trend. After 40 periods the impact of the anchoring adjustment heuristic starts decrease slowly, and consequently the price oscillations slowly stabilize. The decline of the impact of the LAA heuristic also implies weaker coordination between individual predictions during the last 10 periods, which is also consistent with experimental data.
5 Analysis of the model
The simulations pose a number of interesting theoretical questions concerning the dynamics of the model. How general is the path-dependent property? Are fluctuations only short-run phenomena or are fluctuations persistent in the long run as well? Are the fluctuations endogenously generated or are exogenous shocks crucial for sustained fluctuations? To address these questions, we shall consider the deterministic skeleton of dynamics, letting εt = 0 in pricing Equation (11), and analyze its properties. To keep the stability analysis tractable and avoid a non-autonomous system, we replace the LAA rule by an analogous AA heuristic (8) with fixed anchor p f instead of the time-varying anchor  .
5.1 Local stability of four heuristic evolutionary switching model
For the sake of generality let us introduce the following four heuristicsFootnote 4, one of which is adaptive, and three other are extrapolative rules (correctly predicting p f if the past history was pt − 2 = pt − 1 = p f):

The resulting dynamics can be described by a multi-dimensional system consisting of the model of evolutionary learning (9)–(11) with forecasting heuristics (12). The following result, which holds also for the non-autonomous system with the LAA heuristic, shows that if price converges, it must converge to the fundamental level.
Proposition 5.1 Assume that the price dynamics of the deterministic skeleton in the asset-pricing model with evolutionary switching, Equations (9)–(12), converges to a constant price p*. Then the price converges to its fundamental level, that is, p* = p f. Furthermore, the share of robots is fixed and equal to 0, and all heuristics with non-zero weights predict the fundamental price.
Proof. See Appendix A. □
It follows that there exists at most one equilibrium steady state of the system. This steady state is the fundamental, with p = p f. We turn then to the local stability analysis of the fundamental steady state. Standard analysis of the Jacobian of the system (9)–(12) leads to the following.
Proposition 5.2 The fundamental steady state of the asset-pricing model with evolutionary switching, Equations (9)–(12)is locally stable if (i) η < 1 and δ < 1, and (ii) all roots of the polynomial

lie inside the unit circle. The fundamental steady state is unstable if at least one of the roots of polynomial (13)is outside the unit circle.
Proof. See Appendix B, where a straightforward computation shows that the Jacobian of the system has eigenvalues 0, η, and δ (of multiplicity 4), as well as three other eigenvalues, which are the roots of polynomial (13). □
When the heuristic coefficients are specified, the roots of the third-order polynomial P(μ) can be computed. Notice that in general, local stability does not depend on the intensity of choice β. Furthermore, its dependence on the other two parameters of the learning process, η and δ, is also limited. As soon as δ ≠ 1, that is, the impacts of heuristics are not ‘frozen’ over time, and η < 1, that is, agents discount their past performances, the local stability conditions are completely determined by polynomial (13) and only depend on the coefficients of the forecasting heuristics. The parameters η and δ, being eigenvalues of the Jacobian matrix, affect, however, the speed of convergence.
A simple analytical expression of the roots of polynomial (13) is not available. Numerical computations of the roots for the four heuristics ADA, WTR, STR, and AA defined in Equations (4)–(6) and (8) yield

The modulus of the complex eigenvalues is ≅0.69. Thus, the fundamental steady state is locally stable. In other words, all simulations of the deterministic version of the four heuristics model presented in the previous section will exhibit oscillatory convergence to the fundamental steady state. At this point we can conjecture that a small amount of noise εt, representing demand/supply shocks in the experiment, was crucial in generating persistently oscillating time series in groups 1 and 6. We stress, however, two caveats of this conclusion. First, the fundamental steady state can be locally unstable under a different pool of heuristics. Second, even if the fundamental steady state is locally stable, other attractors, such as a stable cycle, may co-exist.
5.2 Local stability of the four heuristics model with constant weights
Which combination of rules might generate non-converging dynamics? To answer this question, let us consider an auxiliary version of the model, where the weights of different heuristics are not changing over time. Formally, such a constant weights model corresponds to a special case within our evolutionary model with δ = 1. Assuming that the forecasts are as in Equation (12), the price evolution in the constant weights model is described by

where the weights of heuristics nh are arbitrary constants summing up to 1. The dynamics of the constant weights model is locally stable when all roots of the polynomial

lie inside the unit circle. Comparing P 1(μ) with the polynomial in Equation (13), we observe that the local stability of the evolutionary switching model is governed by the local stability of the constant weights model with equal weights, that is, with nh = 0.25, for h = 1, …, 4. This result is not surprising. Indeed, the evolutionary model tends to choose the best performing heuristic at any time step, and assigns the weights to the forecasting rules according to their performances. In the fundamental steady state all four heuristics perform equally well, so if dynamics converge to this steady state, all heuristics will have equal weights.
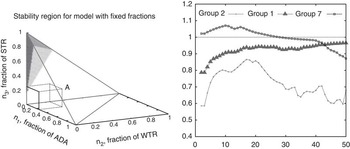
However, the dynamics of the constant weights model with the four heuristics can be locally unstable if the distribution of heuristics is not uniform. In the left panel of Figure 3 we show the simplex

of all possible heuristics’ weights. The dark region in this simplex contains all points where the constant weights model with the four heuristics is unstable. This instability region was obtained numerically by evaluating the roots of the polynomial P 1(μ) in Equation (14) for different values of weights, nh. The instability region has a conic shape connected to the upper-left vertex of the simplex, where the STR has the highest weight. One can easily check that among the four heuristics, this is the only rule that generates unstable dynamics under homogeneous expectations. Consequently, if the weight given to the STR is relatively high and the weights of the remaining three heuristics are relatively low, the dynamics of the fixed weights model are unstable. The simplex, shown in Figure 3, also illustrates that the point of uniform distribution of weights (i.e. point A with n 1 = n 2 = n 3 = n 4 = 0.25) does not belong to the region of instability. As noted above, this implies that the fundamental steady state of the evolutionary switching model with our four heuristics is locally stable.
Local stability of fundamental steady state in the constant weights model. Left: The fundamental steady state is unstable in a model with the four heuristics, when fixed weights (n 1, n 2, n 3) belong to the dark conic region of the unit simplex. Right: Evolution of the modulus of the largest eigenvalue of polynomial (14) corresponding to the simulations of the evolutionary model in Figures 1 and 2

The right panel of Figure 3 illustrates how the evolving distribution of weights generated by the switching model affects the (in)stability in the model with fixed weights, by showing the evolution of the largest eigenvalue of the polynomial P 1(μ) for the simulations discussed in Section 4. As expected, in the converging group 2 the distribution of weights is always such that the constant weights model is stable. In the oscillatory group 1 in the early stage the system is stable, while toward the end of the simulations the weights are evolving to a state where the constant weights model is close to bifurcation. For the oscillatory group, the system thus evolves from a stable process to a near-unit-root process, with the consequence that small noise added to the system causes sustained oscillations. Finally, in group 7 the initial weights correspond to instability, because of a relatively large weight of the STR, but over time the system becomes stable.
5.3 Persistent fluctuations in an evolutionary model
The simplex in Figure 3 suggests that the evolutionary switching model with only two heuristics, STR and AA, will generate dynamics with an unstable fundamental steady state. Indeed, on the vertical edge of the simplex we have n 1 = n 2 = 0, so this edge corresponds to a model with constant fractions of only the STR and AA heuristic. The stability of the fundamental steady state in this evolutionary model with two types is determined by the midpoint of this edge, which belongs to the instability region.
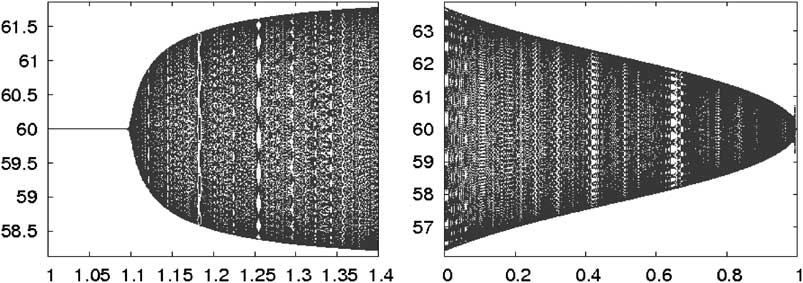
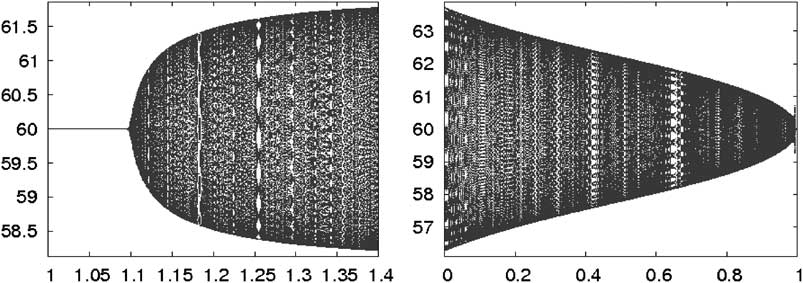
The bifurcation diagrams in Figure 4 illustrate how the dynamics of the switching model with only two heuristics depends on the extrapolation coefficient γ in the STR heuristic (Left) and the memory parameter η (Right). The switching model with competing STR and AA heuristics undergoes a Neimark–Sacker bifurcation, when the coefficient of extrapolation of the STR becomes sufficiently large, around γ = 1.1. The fundamental steady-state loses its stability and endogenous fluctuations arise; for γ = 1.3 the fundamental equilibrium is unstable. Small values of the memory parameter η imply that agents forget about previous performances of both heuristics quite fast. Since the STR is typically self-reinforcing on a short time scale, the STR heuristic will often dominate despite its occasional errors when the trend reverses. Consequently, oscillations are especially large for small η. When memory increases, the model tends to produce small amplitude fluctuations. This is because the STR heuristic has quite a low performance and is only used occasionally.
Bifurcation diagrams in the switching model with two heuristics. 200 points after 1000 transitory steps are shown for the evolutionary switching model with strong trend followers (STR) and anchoring and adjustment heuristics without noise. Initial weights of the heuristics are equal. Benchmark parameters are β = 0.4, η = 0.7, δ = 0.9, and extrapolation coefficient of the STR heuristic γ = 1.3. Left: Bifurcation diagram with respect to the extrapolation parameter γ. Dynamics converge to the fundamental steady state for low values of γ and to the quasi-cycle for high values of γ. Right: Bifurcation diagram with respect to the memory parameter η. The amplitude of the quasi-cyclic oscillations becomes smaller as η increases
6 Model performance
Now we turn to the question of how good our explanation of the experiment is, and, in particular, whether the model with the four heuristics fits the experiment better than the model with only one heuristic without evolutionary switching, that is, a homogeneous-expectation model. In Table 1, for different model specifications, we compute a mean squared error (MSE) for three experimental groups (see columns 2, 3, and 4). Namely, for any period t we compute a squared deviation of the price observed in the experiment,  , from the simulated price,
 , and average these squared deviations over time:

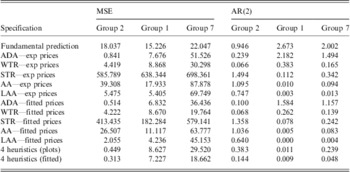
The relative fitness of different models

MSE = mean squared error; ADA = adaptive expectations; WTR = weak trend rule; STR = strong trend rule; AA = anchoring andadjustment heuristic; LAA = learning anchoring and adjustment heuristic.
Fundamental forecast, homogeneous expectations model, and model with switching are compared for three different groups on the basis of the MSE and Euclidean distance from the estimated AR(2) model.
All the models are initialized either with prices observed in the experimental group (exp prices) or with prices resulting in the lowest MSE (fitted prices).
Notice that the two time periods corresponding to the initialization stage of simulations are omitted. The second row of Table 1 demonstrates that the fundamental prediction for every time period performs extremely poorly in predicting actual experiment realizations. The next 10 rows show the MSE for a homogeneous-expectations model with only one of the five heuristics defined in Equations (4)–(8). Each model must be initialized by the prices in the first two periods, and we consider two possible initializations. First, we initialize the model with prices observed in the corresponding experimental session; second, we vary the initial price in order to get the best fit. Finally, the last two rows show the MSE for the heterogeneous expectations, four heuristics-switching model, both with initializations described in Section 4 and with fitted initial prices and given initial weights.
As expected, in group 2 with monotonic convergence the ADA heuristic performs extremely well, giving small values of the MSE. All other heuristics, especially the STR, are much worse in fitting the experiment. However, the model with switching can generate an even better fit than any of the four heuristics. It is remarkable that this happens despite the fact that over all 50 periods of simulation these four heuristics had quite similar impacts. In group 1 with constant oscillations the LAA, ADA, and WTR heuristics generate the smallest MSE. The switching model with the four heuristics does not improve the best fit of the homogeneous-expectations model, but its MSE is comparable with those of the best heuristics. Similarly, in group 7 with damping oscillations the LAA and WTR heuristics perform better than the others. The switching model now improves the results for the best heuristics, even if the overall fit is not as good as for the other groups.
Recalling the simulations in the oscillatory groups, the following problem with the MSE as a measure of fit becomes clear. Even if our model can generate qualitatively similar oscillations, they always have different frequencies from those that were observed in the experimentFootnote 5. Consequently, big errors will be generated at the periods when oscillations in the experiment and the simulations are in different phases. To deal with this problem, we use an indirect inference technique. In the first stage, we estimate an AR(2) econometric model both on the experimental and on the simulational data. In the second stage, we compute the Euclidean distance between estimators. Results of these statistics are reported in columns 5, 6, and 7 of Table 1, and our main focus is on those groups where the MSE was not a good measure, that is, on groups 1 and 7.
Notice that again the fundamental strategy performs extremely badly. Also the model with ADA heuristics, which was leading in two converging groups, generates large deviation from the underlying experimental estimates. In fact, in groups with constant oscillations the STR and LAA heuristics perform better than the others. The switching model does not improve the performance, but generates similar results, which are at any rate better than the results of the homogeneous model with other heuristics. In the groups with damping oscillations, the LAA heuristic gives the best fit, but the model with the four heuristics is better than the second best. To summarize, even if different heuristics are better at fitting the experimental data of different sessions, the model with the four heuristics always performs at least as well as the second-best heuristic and in some cases even improves the fit. Notice that these results are obtained without fit of parameters and initial impacts. The main advantage of the model with the four heuristics is, of course, that this model can be applied to all experimental sessions.
7 Conclusion
In real markets small price movements triggered by random news about market fundamentals may be reinforced by trend-following strategies, causing excessively volatile markets. The recent ‘learning to forecast’ experiment of Hommes et al. (Reference Hommes, Sonnemans, Tuinstra and Velden2005) has confirmed this intuition, but has also revealed that excess volatility may disappear after a short learning phase. Two important questions arise: first, is it possible to express the intuition presented above by means of a simple, parsimonious model; and, second, can such a model both generate persistent excess volatility and converge to the fundamental price?
Evolution of market heuristics along the lines sketched in this paper provides a simple and universal answer to these two questions. The model starts with different forecasting rules, each of which has a simple behavioral interpretation, but generates its own type of dynamics. Then we impose an evolutionary selection mechanism, and end up with dynamics having the path-dependence feature, that is, the capability to produce both persistent oscillating and converging patterns for the same parameter values. Path dependence implies that the initial conditions, such as prices in the first few periods and relative weights of different rules, are responsible for differences in aggregate price pattern. Depending on the pattern during the initial phase, interaction and evolutionary selection of individual forecasting heuristics may lead to coordination of individual behavior upon different rules, which would imply different long-run dynamics. This explanation of the experiment is also consistent with recent work on agent-based models of interaction explaining emergent phenomena in financial markets, including fat tails, clustered volatility, temporary bubbles and crashes, and scaling laws (Mantegna & Stanley, Reference Mantegna and Stanley1995; Farmer & Lo, Reference Farmer and Lo1999; Lux & Marchesi, Reference Lux and Marchesi1999; Hommes, Reference Hommes2006; LeBaron, Reference LeBaron2006).
A number of important questions should be addressed in future work. The first question concerns the robustness of the path-dependence feature of the model. Our extensive simulationsFootnote 6 reveal that path dependence holds for a large range of parameters, however, the precise shape of the corresponding parameter region is not known. Furthermore, our selection mechanism contains three parameters, β, η, and δ, measuring, respectively (i) how sensitive individuals are to the differences in strategy performance, (ii) how much the relative weight assigned to the most recent errors is, and (iii) how strongly individuals stick to their previous heuristic. One would like to know the precise role of these three parameters in simulations, as well as to find the estimates of these parameters on the experimental dataFootnote 7. Finally, one can apply the evolutionary switching model of heuristics to other experimental data to study whether learning parameters are affected, for example, by the precise experimental environment.
Acknowledgments
We would like to thank the participants of the ‘Computation in Economics and Finance’ conference, Montreal, June 2007, the ‘Complexity in Economics and Finance’ workshop, Leiden, October 2007, and seminar participants at the University of Amsterdam, Sant'Anna School of Advanced Studies (Pisa) for stimulating discussions. We are especially grateful to an anonymous referee and the editor, Robert Marks, for their helpful comments, which lead to significant improvement of the paper. This work was supported by the ComplexMarkets E.U. STREP project 516446 under FP6-2003-NEST-PATH-1, and by the EU FP7 POLHIA project, grant no. 225408.
Appendix
A. Proof of Proposition 5.1
In the steady state with fixed price p*, the past price sample average will also be equal to p*. The dynamics (17)in the steady state with fixed price p* then is given as

In the state with constant price p* = p f, the fraction of robots nt = 0, so that the above condition simplifies to  . Then the ADA rule (if it is in actual use) gives fundamental forecast.
If p* ≠ p f, take the limit of t→∞ in Equation (16). Since adaptive expectations converge to p* in such limit, we obtain that 1 + r ⩽ 1, which is impossible.
B. Stability of evolutionary model
Notice, first of all, that the local stability of price dynamics at the fundamental steady state is not affected by the dynamics of robot traders. Indeed, the price dynamics (11) can be written in deviations from the fundamental price as

The first term in the right hand-side is never greater than 1. Thus, dynamics of Equation (17) is a superposition of a contraction with the following process:

with xt = pt − p f and  . If the latter dynamics is locally stable, the steady-state p f of original dynamics (17) will be also locally stable. Furthermore, since the exponential term in the latter dynamics is equal to 1 in the steady state, the linear parts of the dynamics of the last two processes are the same. Thus, processes (17) and (18) lose stability simultaneously and through the same bifurcation type. The robots can be, thus, safely eliminated from the local stability analysis.
After such elimination we obtain a differentiable system. In the body of the paper we have obtained a model describing the dynamics of price and other variables under the evolutionary learning over four heuristics. We will write the dynamical system using the general notation for four heuristics introduced in Equation (12). The dynamics below is written in deviations from fundamental price, both in prices and in forecasts. The variables are introduced as follows:

The following 14-dimensional system of the first-order equations describes the dynamics. It consists of four equations describing the evolution of performance measures, four variables represent the fractions of different forecasting rules, one equation describes the price dynamics, which we will write in deviations, and other three equations are needed to take lags of price deviations into account, and finally two equations describe the evolution of adaptive expectation rule:

where

We are interested in stability of this system near the fixed point with price equal to p f and zero fraction of ‘robots’. First of all, recall that the term exp(−|xt − 1|/200) in the equation for price deviations can be ignored, since its first-order approximation in this fixed point is 1. The Jacobian matrix J of the remaining system is given by

It is straightforward to check that this Jacobian has multipliers equal to 0 (of multiplicity 3) and η and δ (both of multiplicity 4). The remaining three multipliers are the roots of characteristic polynomial for matrix

This characteristics polynomial is given in Equation (13). □