1. Introduction
One of the distinct features of wall-bounded turbulent flows is that they are characterised by multiple scales over a broad range. Owing to the presence of a solid wall, the characteristic length scales in wall turbulence vary from the viscous length scale ( $\delta _{\nu }$) to the outer length scale (
 $\delta$). Such a multiscale nature is described by the friction Reynolds number (
 $Re_{\tau }$), which is the ratio of
 $\delta$ and
 $\delta _{\nu }$. At asymptotically high
 $Re_{\tau }$, there is a region where two different length scales are valid simultaneously. In this region, the only relevant length scale is the distance from the wall
 $y$, and the mean velocity profile follows the logarithmic variation with respect to
 $y$ (Millikan Reference Millikan1938); this is the so-called logarithmic region. Townsend (Reference Townsend1976) conjectured that energy-containing motions in the logarithmic region are self-similar and that their sizes are proportional to
 $y$ because the impermeability of the walls restricts the size of the order of the wall-normal distance. In this respect, Townsend described that these motions are attached to the wall, which is the so-called attached-eddy hypothesis (AEH); see a recent review (Marusic & Monty Reference Marusic and Monty2019). The AEH allows us to establish the relationship between coherent structures and turbulence statistics at asymptotically high
 $Re_{\tau }$ by conjecturing that the logarithmic region is composed of self-similar energy-containing motions. These motions are assumed to be inviscid near the wall; they lead to the logarithmic variation in the wall-parallel components of the turbulence intensities and constant wall-normal turbulence intensity over the logarithmic region.
The AEH was further extended by Perry & Chong (Reference Perry and Chong1982) who deduced the attached-eddy model. They showed that the eddies are randomly distributed in a hierarchical form with a probability density function that is inversely proportional to  $y$ because of their self-similar nature. Based on the attached-eddy model, they expected that the logarithmic variations occur both in the mean velocity and in the wall-parallel components of turbulence intensity. Moreover, the model also shows that self-similar motions contribute to a
 $k_x^{-1}$ scaling in the one-dimensional spectra of the streamwise velocity, where
 $k_x$ is the streamwise wavenumber. The
 $k_x^{-1}$ region was predicted by Perry & Abell (Reference Perry and Abell1977), who assumed that there is a spectral overlap region where
 $y$ and
 $\delta$ scalings hold simultaneously. In this sense, the
 $k_x^{-1}$ region can be a consequence of the AEH and is deemed the spectral signature of attached eddies (Perry & Chong Reference Perry and Chong1982; Perry, Henbest & Chong Reference Perry, Henbest and Chong1986). However, although some studies have reported empirical evidence for the existence of the
 $k_x^{-1}$ region (Nickels et al. Reference Nickels, Marusic, Hafez and Chong2005; Vallikivi, Ganapathisubramani & Smits Reference Vallikivi, Ganapathisubramani and Smits2015), it remains unclear whether such scaling exists in a high-Reynolds-number flow (Rosenberg et al. Reference Rosenberg, Hultmark, Vallikivi, Bailey and Smits2013; Ahn et al. Reference Ahn, Lee, Lee, Kang and Sung2015; Lee & Moser Reference Lee and Moser2015; Agostini & Leschziner Reference Agostini and Leschziner2017; Chandran et al. Reference Chandran, Baidya, Monty and Marusic2017; Baars & Marusic Reference Baars and Marusic2020a). This leads to questions regarding the relationship between the
 $k_x^{-1}$ region and the logarithmic variation of the streamwise turbulence intensity because the latter is satisfied when the spectral overlap argument is valid. Moreover, several high-Reynolds-number experiments have revealed the logarithmic variations in the streamwise turbulence intensity (Hultmark et al. Reference Hultmark, Vallikivi, Bailey and Smits2012; Marusic et al. Reference Marusic, Monty, Hultmark and Smits2013; Örlü et al. Reference Örlü, Fiorini, Segalini, Bellani, Talamelli and Alfredsson2017). However, the
 $k_x^{-1}$ dependence in the same experimental data has not been yet established, especially in premultiplied one-dimensional spectra with a semi-log plot (Baars & Marusic Reference Baars and Marusic2020a).
The ambiguities in the spectral signatures of the attached eddies are related to insufficient scale separation since the AEH requires that the Reynolds number approaches infinity. This means that there is no region where both  $y$ and
 $\delta$ scalings are valid over the same wavenumber space, even in the high-Reynolds-number experiments
 $Re=O(10^{4-5})$ of the aforementioned studies. However, given the fact that the self-similar energy-containing motions follow a hierarchical distribution (Perry & Chong Reference Perry and Chong1982), we may expect that self-similar motions can exist even if scale separation is insufficient. Owing to insufficient separation of scales, self-similar motions are less statistically dominant than other coexisting motions, which in turn leads to ambiguity of the asymptotic behaviours in turbulent statistics. If we properly extract the contributions of self-similar motions by filtering out coexisting motions in turbulent flows, then we may observe the spectral overlap region (Baars & Marusic Reference Baars and Marusic2020a). This conjecture is supported by the existence of very large-scale structures (Kim & Adrian Reference Kim and Adrian1999) or global modes (del Álamo et al. Reference del Álamo, Jiménez, Zandonade and Moser2004) in internal flows and superstructures in external flows (Hutchins & Marusic Reference Hutchins and Marusic2007). The very large scales, characterised by the outer scale
 $\delta$, extend from the outer region to the near-wall region and significantly contribute to turbulence statistics in the logarithmic region (Guala, Hommema & Adrian Reference Guala, Hommema and Adrian2006; Balakumar & Adrian Reference Balakumar and Adrian2007; Lee & Sung Reference Lee and Sung2011; Hwang et al. Reference Hwang, Lee, Sung and Zaki2016b). In other words, the statistical behaviours of self-similar motions in the logarithmic region can be contaminated by the contributions of non-self-similar motions. Jiménez & Hoyas (Reference Jiménez and Hoyas2008) showed that the departure of the streamwise turbulent intensity from the logarithmic variation is due to the contamination by very long and wide motions (i.e. global modes). It is to be noted that other types of coexisting motions related to smaller scales (e.g. viscous scales) also contribute to the absence of the logarithmic law (Perry et al. Reference Perry, Henbest and Chong1986; Perry & Li Reference Perry and Li1990; Marusic, Uddin & Perry Reference Marusic, Uddin and Perry1997), but their effect on the ambiguity of the
 $k_x^{-1}$ scaling may be negligible because such a scaling region will appear over a large scale range
 $O(y)$.
Several works have shown statistical evidence for the existence of self-similar motions in the logarithmic region. del Álamo et al. (Reference del Álamo, Jiménez, Zandonade and Moser2006) and Lozano-Durán, Flores & Jiménez (Reference Lozano-Durán, Flores and Jiménez2012) extracted three-dimensional clusters of vortices and sweeps/ejections in instantaneous flow fields of channel flows and showed that the sizes of the wall-attached objects are proportional to the height. In an artificial channel flow, which resolves only a given spanwise length scale, it was found that the statistical behaviours of energy-containing motions in the logarithmic region are characterised by the spanwise length scale and are self-similar with respect to  $y$ (Hwang Reference Hwang2015). Similarly, Hellström, Marusic & Smits (Reference Hellström, Marusic and Smits2016) reported that the azimuthal length scales of the dominant modes, identified by a proper orthogonal decomposition analysis, are linearly proportional to
 $y$ over a decade in turbulent pipe flows. In turbulent boundary layers (TBL), Baars, Hutchins & Marusic (Reference Baars, Hutchins and Marusic2017) extracted coherent motions using a spectral coherence analysis and showed that the corresponding motions follow a constant streamwise/wall-normal ratio. Subsequently, a linear relationship between the streamwise and spanwise wavelengths, which is evidence for self-similarity, was observed in the two-dimensional spectra of streamwise velocity (Chandran et al. Reference Chandran, Baidya, Monty and Marusic2017). Agostini & Leschziner (Reference Agostini and Leschziner2017) found that the premultiplied derivative of the second-order structure function has a constant region, which reflects the
 $k_x^{-1}$ scaling (Davidson, Nickels & Krogstad Reference Davidson, Nickels and Krogstad2006). However, although previous studies have shown the existence of self-similar coherent motions in wall turbulence, the relationship between the identified motions and statistical behaviours (i.e. logarithmic variation or
 $k_x^{-1}$ region) predicted by the AEH has not been established. This is because the AEH originated from an attempt to explain the asymptotic behaviours of turbulence statistics, and especially two-point correlations, in terms of coherent structures in the logarithmic region. Hence, there remains a need to show whether self-similar coherent motions extracted by a particular method can be attributed to the logarithmic variation in the turbulence intensity or the spectral signature for the
 $k_x^{-1}$ scaling and to reveal whether such behaviours appear in a consistent range where the identified motions are defined.
Recently, Srinath et al. (Reference Srinath, Vassilicos, Cuvier, Laval, Stanislas and Foucaut2018) proposed a model of the one-dimensional streamwise energy spectrum based on wall-attached structures of streamwise velocity fluctuations ( $u$) identified in a streamwise–wall-normal plane. They showed that both streamwise energy spectrum and turbulence intensity follow a power-law distribution with respect to the streamwise length scale, and the sum of the corresponding power-law exponents is close to
 $-1$. In particular, the exponent of the streamwise energy spectrum becomes
 $-1$ (i.e.
 $k_x^{-1}$ scaling) over
 $100 < y^+ < 200$ (below the logarithmic region) at
 $Re_{\tau } \approx O(10^{3-4})$. By extracting a spine or skeleton of contiguous volumes of the intense
 $u$ regions, Solak & Laval (Reference Solak and Laval2018) examined the geometrical features of
 $u$ structures at
 $Re_{\tau } \approx 700$. It was found that the conditionally sampled streamwise intensity follows a power-law distribution with respect to the structure length at a given
 $y$. In addition, the sum of the exponents of the one-dimensional spectra and the intensity was observed close to
 $-1$, which supports the model proposed by Srinath et al. (Reference Srinath, Vassilicos, Cuvier, Laval, Stanislas and Foucaut2018).
Hwang & Sung (Reference Hwang and Sung2018) demonstrated that the wall-attached structures of  $u$ are not only self-similar in terms of their heights, (
 $l_y$) but also directly contribute to the logarithmic variation in the streamwise turbulence intensity. In addition, they showed that the population density of the identified structures is inversely proportional to
 $l_y$, reminiscent of the hierarchies of self-similar eddies (Townsend Reference Townsend1976; Perry & Chong Reference Perry and Chong1982). It is worth mentioning that the presence of the logarithmic region in the reconstructed intensity profile was verified by an apparent plateau in the indicator function of the logarithmic variation although there is no logarithmic behaviour in the profile of the streamwise turbulence intensity at a low Reynolds number (
 $Re_{\tau } \approx 1000$). Moreover, in pipe flows, it was found that the profile of the streamwise velocity reconstructed by the superposition of the wall-attached
 $u$ structures exhibits the logarithmic variation (Hwang & Sung Reference Hwang and Sung2019). In particular, the ranges of the logarithmic variation in the streamwise turbulence intensity and in the mean velocity appear at a consistent location
 $3Re_{\tau }^{1/2} < y^+ < 0.18\delta ^+$, where the superscript
 $+$ denotes viscous scaling. These findings support the supposition that the identified
 $u$ structures can be regarded as the structural basis of the logarithmic region in the context of the AEH.
Despite evidence on the self-similarity of wall-attached  $u$ structures and their contribution to the logarithmic behaviours, their spectral contribution and the turbulence motions contained within the identified structures have not been revealed. The wall-attached
 $u$ structures are identified in instantaneous fluctuating velocity fields and their length scales are measured in terms of the dimensions of the bounding box of each object in physical space. The length and width of the wall-attached structure does not necessarily indicate a particular length scale associated with the identified object since each structure can contribute turbulence energy over a certain range of spectral space (Nickels & Marusic Reference Nickels and Marusic2001). In other words, the physical size of each structure is a particular length scale among a range of scales contained within the individual structure; in particular, it represents one of the large scales related to the volume of intense
 $u$. Hence, spectral analysis is required to reveal whether the large scales contained within the identified object can be attributed to the logarithmic variation or exhibit the spectral overlap argument proposed by Perry and coworkers (Perry & Abell Reference Perry and Abell1977; Perry & Chong Reference Perry and Chong1982; Perry et al. Reference Perry, Henbest and Chong1986).
Given the self-similar nature of the wall-attached  $u$ structures, we may expect to see a linear relationship between the streamwise and spanwise wavelength (
 $\lambda _x$ and
 $\lambda _z$) in the two-dimensional energy spectra of
 $u$ (Chung et al. Reference Chung, Marusic, Monty, Vallikivi and Smits2015; Chandran et al. Reference Chandran, Baidya, Monty and Marusic2017; Deshpande et al. Reference Deshpande, Chandran, Monty and Marusic2020). In order for there to be a
 $k_x^{-1}$ region in the one-dimensional spectra, the two-dimensional energy spectra should be characterised by a region of constant energy in the logarithmic region, and this region should be bounded by an identical power-law between
 $\lambda _x$ and
 $\lambda _z$ (Chung et al. Reference Chung, Marusic, Monty, Vallikivi and Smits2015). Chandran et al. (Reference Chandran, Baidya, Monty and Marusic2017) observed that constant-energy contours in the two-dimensional spectra are bounded by a linear relationship (
 $\lambda _x \sim \lambda _z$), which represents the self-similarity of turbulence motions. They found that the linear behaviour appears at high
 $Re_{\tau } (\approx 26\,000)$ TBLs in the large-scale range (
 $\lambda _x > 10y$), while only square root behaviour is observed at low
 $Re_{\tau } (\approx 2400)$; this is consistent with the work of del Álamo et al. (Reference del Álamo, Jiménez, Zandonade and Moser2004) who examined the two-dimensional energy spectra of a turbulent channel flow at
 $Re_{\tau } = 1900$. However, there was no clear plateau in the premultiplied one-dimensional spectra (i.e.
 $k_x^{-1}$ region) over a similar range of the linear behaviour in the two-dimensional spectra. As discussed, the energy spectra of
 $u$ represent the contributions of all coexisting eddies and this obscures the appearance of self-similar behaviours since those behaviours are only achieved in the limit of infinite
 $Re_{\tau }$. Therefore, extracting proper
 $u$ motions satisfying the AEH is required to examine the spectral-overlap arguments. Recent studies have been conducted to filter out the spectral contribution of self-similar motions. Given the hierarchies of the attached eddies, Hu, Yang & Zheng (Reference Hu, Yang and Zheng2020) extracted
 $u$ in the one-dimensional spectra over the range of
 $5.7y < \lambda _x < 3\text{--}4\delta$ and
 $y^+ > 100$. Baars & Marusic (Reference Baars and Marusic2020a) extracted the energy contributed from wall-coherent motions by decomposing the streamwise turbulence intensity through spectral coherence analysis. Using the two-point correlation of
 $u$, Deshpande et al. (Reference Deshpande, Chandran, Monty and Marusic2020) obtained the two-dimensional spectra, which represent the energy distribution of the wall-attached motions across
 $\lambda _x$ and
 $\lambda _z$. Although these studies showed that the extracted energy distributions exhibit the self-similarity (
 $\lambda _x \sim y$ or
 $\lambda _x \sim \lambda _z$) in the logarithmic region, the extracted signals also include contributions from tall wall-attached motions (non-self-similar motions) that extend from the wall to the outer region (i.e. beyond the logarithmic region). In other words, contamination by non-self-similar motions could mask the asymptotic statistical behaviours predicted by the AEH.
The objective of the present study is to explore the spectral contribution of turbulence motions that comprise wall-attached  $u$ clusters by computing the two-dimensional spectra of
 $u$, in which the velocity signals contained within self-similar structures are isolated. To do so, we examine the direct numerical simulation (DNS) data of a fully developed turbulent channel and pipe flows, along with zero-pressure-gradient TBL at
 $Re_{\tau } \approx 1000$, and identify the wall-attached self-similar structures by applying universal filters in terms of height. The wall-attached self-similar clusters, identified in the physical space, not only exhibit similar geometrical features but also embody scales corresponding to
 $\lambda _x \sim \lambda _z$, which in turn contribute to the existence of the
 $k_x^{-1}$ and
 $k_z^{-1}$ scalings. A brief description of the DNS data and the identification method for extracting self-similar clusters in instantaneous flow fields is provided in § 2. In § 3, wall-attached
 $u$ clusters are decomposed into the buffer-layer, self-similar and non-self-similar structures in terms of their height. Next, the wall-attached self-similar structures (WASS) are examined using the two-dimensional energy spectra to reveal the self-similar behaviours in the logarithmic region of all three flows. We then explore the one-dimensional streamwise and spanwise spectra by comparing the energy contained in the spectral range where the energetic ridges in the two-dimensional spectra follow a linear relationship between the wall-parallel wavelengths. Finally, a summary of the main findings is provided in § 4.
2. DNS data and cluster identification method
In this study, the DNS data of the zero-pressure gradient TBL (Hwang & Sung Reference Hwang and Sung2017; Yoon, Hwang & Sung Reference Yoon, Hwang and Sung2018), and the fully developed turbulent channel (Lee et al. Reference Lee, Lee, Choi and Sung2014; Lee, Ahn & Sung Reference Lee, Ahn and Sung2015) and pipe flows (Ahn et al. Reference Ahn, Lee, Jang and Sung2013, Reference Ahn, Lee, Lee, Kang and Sung2015) are analysed. To solve the Navier–Stokes equations for incompressible flow, the DNS was performed using the fractional step method proposed by Kim, Baek & Sung (Reference Kim, Baek and Sung2002). Table 1 provides the parameters of the DNS data, and a detailed description of the DNS can be found in the aforementioned studies. The friction Reynolds numbers, defined as the ratio of the outer length scale to the viscous length scale, are matched at  $Re_{\tau } = u_{\tau }\delta /\nu \approx 1000$. Here,
 $u_{\tau }$ is the friction velocity,
 $\nu$ is the kinematic viscosity and
 $\delta$ is the flow thickness (i.e. channel half-height, pipe radius or
 $99\,\%$ boundary layer thickness). Throughout the present work, the superscript
 $+$ represents viscous scaling (
 $\nu /u_{\tau }$ and
 $u_{\tau }$). The friction Reynolds number of the TBL (
 $Re_{\tau } = 980$) is chosen at the middle of the streamwise length (
 $L_x \approx 11.7\delta$) of the subdomain. We neglect the Reynolds number effect since
 $Re_{\tau }$ varies from 913 to 1039 across the streamwise direction of the extracted flow field. In the present study,
 $x$,
 $y$ and
 $z$ indicate the streamwise, wall-normal and spanwise directions, respectively. In the pipe flow, the wall-normal direction is defined as
 $y = \delta - r$, where
 $r$ denotes the radial direction. In addition, for an analogy with
 $z$ in the TBL and channel flows, the spanwise dimension of the pipe is defined as the arclength
 $r\theta$, where
 $\theta$ denotes the azimuthal direction. We define the streamwise velocity fluctuations
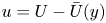 $u = U - \bar {U}(y)$, where
 $U$ is the streamwise velocity, and the overbar denotes the ensemble average. For the TBL, the streamwise fluctuating component is decomposed by considering the local height of the turbulent/non-turbulent interface
 $\delta _i$ (Kwon, Hutchins & Monty Reference Kwon, Hutchins and Monty2016); that is,
 $\tilde {u} = U - \tilde {U}(y,\delta _i)$, where
 $\tilde {U}$ is the conditional mean velocity as a function of
 $y$ and
 $\delta _i$. The profile of
 $\tilde {U}$ shows a significant discrepancy compared with that of
 $\bar {U}$ in the intermittent region, whereas they collapse close to the wall (Kwon et al. Reference Kwon, Hutchins and Monty2016; Yoon et al. Reference Yoon, Hwang, Yang and Sung2020). We focus on coherent motions in the logarithmic region, and thus the fluctuating fields are insensitive to the decomposition method (i.e.
 $u \approx \tilde {u}$ in TBL). In other words, the results presented here remain qualitatively unchanged when using the Reynolds decomposition. Hereafter, we refer to
 $\tilde {u}$ as
 $u$ in the TBL. However, when we examine fluctuating motions that reach
 $\delta _i$ or reside in the intermittent region, we have to consider the oscillation of
 $\delta _i$ in order to avoid contamination in the intermittent region of TBL.
Simulation parameter. Here,  $Re_{\tau }$ is the friction Reynolds number;
 $L_i$ and
 $N_i$ indicate the domain size and number of grid points, respectively; grid spacings in the wall-parallel directions are
 $\Delta x^+$ and
 $\Delta z^+$; the minimum and maximum grid sizes in the wall-normal direction are
 $\Delta y^+_{min}$ and
 $\Delta y^+_{max}$, respectively; and
 $\Delta t^+$ is the time step. In the pipe dataset, the arclength is used to denote the spanwise direction. In the TBL, inner-normalised resolutions are taken at
 $Re_{\tau } \approx 1000$ and
 $\delta _0$ denotes the inlet boundary layer thickness.

We identify the clusters of  $u$ in the instantaneous flow fields by extracting the contiguous points of the intense
 $u$ region (Hwang & Sung Reference Hwang and Sung2018; Han et al. Reference Han, Hwang, Yoon, Ahn and Sung2019; Hwang & Sung Reference Hwang and Sung2019; Yoon et al. Reference Yoon, Hwang, Yang and Sung2020). In the three-dimensional flow field, the irregular shapes of the objects are defined as
 \begin{equation} u(\boldsymbol{\textit{x}}) > \alpha u_{rms}(y) \ \text{or} \ u(\boldsymbol{\textit{x}}) > -\alpha u_{rms}(y), \end{equation}
where  $u_{rms}$ is the standard deviation of the streamwise velocity and
 $\alpha$ is the threshold. Individual objects are extracted using the connectivity rule, in which nodes are labelled among the six orthogonal neighbours of each node satisfying (2.1) in Cartesian coordinates (Moisy & Jiménez Reference Moisy and Jiménez2004; del Álamo et al. Reference del Álamo, Jiménez, Zandonade and Moser2006; Lozano-Durán et al. Reference Lozano-Durán, Flores and Jiménez2012; Hwang & Sung Reference Hwang and Sung2018) and cylindrical coordinates (Han et al. Reference Han, Hwang, Yoon, Ahn and Sung2019; Hwang & Sung Reference Hwang and Sung2019). We chose the threshold
 $\alpha = 1.5$ for all three flows; further discussion can be found in our previous works (Hwang & Sung Reference Hwang and Sung2018; Yoon et al. Reference Yoon, Hwang, Yang and Sung2020). In the vicinity of this value, turbulence clusters show the percolation behaviours over a wide range of
 $Re_{\tau }$ (del Álamo et al. Reference del Álamo, Jiménez, Zandonade and Moser2006; Lozano-Durán et al. Reference Lozano-Durán, Flores and Jiménez2012; Hwang & Sung Reference Hwang and Sung2019) and for different flow configurations; that is, pipes in Hwang & Sung (Reference Hwang and Sung2019) and Han et al. (Reference Han, Hwang, Yoon, Ahn and Sung2019) or adverse-pressure-gradient TBL in Yoon et al. (Reference Yoon, Hwang, Yang and Sung2020). The present identification method allows us to measure the physical length scales of individual structures in instantaneous flow fields. Each structure is bounded by a box of size
 $l_x \times l_y \times l_z$, where the corresponding length, height and width are denoted by
 $l_x$,
 $l_y$ and
 $l_z$. In the pipe flow,
 $l_z$ is computed in terms of the maximum arclength in the plane obtained by projecting each object onto the cross-stream plane.
3. Results and discussion
As mentioned, we focus on WASS of  $u$ reported in the works of Hwang & Sung (Reference Hwang and Sung2018) and Hwang & Sung (Reference Hwang and Sung2019). Here, we briefly summarise the spatial characteristics and the physical interpretation of WASS. The
 $u$ clusters (2.1) can be classified into wall-attached and wall-detached by measuring the minimum wall-normal distance (
 $y_{min}$) of each object. Wall-attached
 $u$ clusters are defined as
 $y_{min}^+ \approx 0$, meaning that each cluster has coherence near the wall. The attached eddies proposed by Townsend do not necessarily adhere to the wall, as the AEH considers coherent motions in asymptotically high
 $Re_{\tau }$. Hence, these eddies are assumed inviscid, which results in non-zero wall-parallel velocity components near the wall. Given that the AEH is an inviscid theory, we could define the wall-attached
 $u$ structures with
 $y_{min}^+ < 20$ (beyond the viscous sublayer), as in the study by del Álamo et al. (Reference del Álamo, Jiménez, Zandonade and Moser2006) or Lozano-Durán et al. (Reference Lozano-Durán, Flores and Jiménez2012). However, we found that approximately 90 % of the wall-attached
 $u$ structures extending below
 $y^+ < 20$ have their minimum wall distance close to zero (Hwang & Sung Reference Hwang and Sung2018) and, in particular, all of the identified structures that extend beyond the logarithmic region have
 $y_{min}^+ \approx 0$. Because the present study primarily focuses on the contribution of the identified structures to the logarithmic region, the criterion of
 $y_{min}$ does not significantly affect our conclusions.
In addition, our use of ‘wall-attached’ and ‘wall-detached’ is to distinguish between whether the identified clusters are physically attached to the wall or floating in a flow since each of them contains self-similar or non-self-similar structures (Marusic & Monty Reference Marusic and Monty2019; Yoon et al. Reference Yoon, Hwang, Yang and Sung2020). This approach takes into account the description of energy-containing motions in Jiménez & Hoyas (Reference Jiménez and Hoyas2008). This nomenclature may provide a better description of coherent structures in the context of the AEH when compared with simply designating the self-similar (i.e. dimensions are proportional to  $y$) structures as ‘attached’. In addition, the identified wall-attached structures, i.e. those that anchor to the wall, might contribute to the skin friction since energy-containing motions in the logarithmic region are responsible for the skin friction (de Giovanetti, Hwang & Choi Reference de Giovanetti, Hwang and Choi2016; Agostini & Leschziner Reference Agostini and Leschziner2019).
According to Hwang & Sung (Reference Hwang and Sung2018), wall-attached  $u$ structures occupy approximately
 $90\,\%$ of a total volume of
 $u$ clusters and carry significant turbulent energy throughout the TBL. The length and width of the wall-attached structures are scaled with their heights and the population density exhibits an inverse power-law with respect to
 $l_y$. In addition, the streamwise turbulence intensity contained within these structures shows the logarithmic variation even at low
 $Re_{\tau } (\approx 1000)$, suggesting that the identified structures are prime candidates of Townsend's AEH. Moreover, Hwang & Sung (Reference Hwang and Sung2019) demonstrated that the WASS identified in turbulent pipe flows contribute to the presence of the logarithmic velocity law, and thus they may play a role as the structural basis for the inertial region. In addition, the number of uniform momentum zones (UMZs) contained in the WASS increases with
 $l_y$ and the peak magnitude of the streamwise turbulence intensity in the near-wall region follows a log–linear increase with
 $l_y$. These results support the inference that the structural organisation of WASS can be interpreted in terms of both the hierarchical length scale distribution and a nested hierarchy of the hairpin packet (Adrian, Meinhart & Tomkins Reference Adrian, Meinhart and Tomkins2000). In this manner, the turbulence statistics carried by the WASS result from the collective contribution of coherent motions with heights of less than
 $l_y$; for further discussion, see § 5 in Hwang & Sung (Reference Hwang and Sung2018).
However, the length scales of each cluster (i.e.  $l_x$ and
 $l_z$) correspond to the dimensions of the bounding box defined in physical space. In other words,
 $l_x$ or
 $l_z$ is a particular length scale among a range of scales contained within the individual structure; in particular, it represents one of the large scales related to the volume of intense
 $u$. We will analyse the two-dimensional energy spectrum of WASS to observe the energy distribution across the streamwise and spanwise wavelengths (
 $\lambda _x$ and
 $\lambda _z$). This analysis allows us to clarify the wavelength scales associated with the WASS identified in the physical space and to interpret the organisation of WASS in view of the spectral argument (Perry & Abell Reference Perry and Abell1977; Perry & Chong Reference Perry and Chong1982; Perry et al. Reference Perry, Henbest and Chong1986).
3.1. Decomposition of wall-attached structures
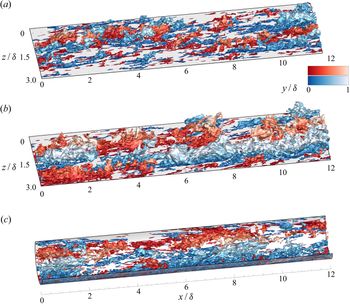
First, we decompose the wall-attached structures of  $u$ in order to extract the self-similar structures. Figure 1 shows the isosurfaces of wall-attached structures (
 $y_{min}^+ \approx 0$) identified in all three flows. Here, light to dark shading indicates an increase in the wall-normal location. As seen, we can observe the coexisting streaky structures over a wide range of
 $l_y$ distributed over the surface. A noteworthy feature is that very tall structures with heights approaching
 $\delta$ are more evident in internal flows (figure 1
 $b$,
 $c$) compared with TBL (figure 1
 $a$). These large structures meander in the spanwise direction (Hutchins & Marusic Reference Hutchins and Marusic2007) and appear with the streamwise length over
 $10\delta$ in internal flows (Monty et al. Reference Monty, Stewart, Williams and Chong2007, Reference Monty, Hutchins, Ng, Marusic and Chong2009). Such a difference in very long structures may imply that we need to filter out those structures to examine the self-similar features of energy-containing motions in the logarithmic region.
Isosurfaces of wall-attached structures in an instantaneous flow field: ( $a$) TBL; (
 $b$) channel; and (
 $c$) pipe. Red and blue isosurfaces indicate positive and negative streamwise velocity fluctuations, respectively. Light to dark shading indicates an increase in
 $y/\delta$.

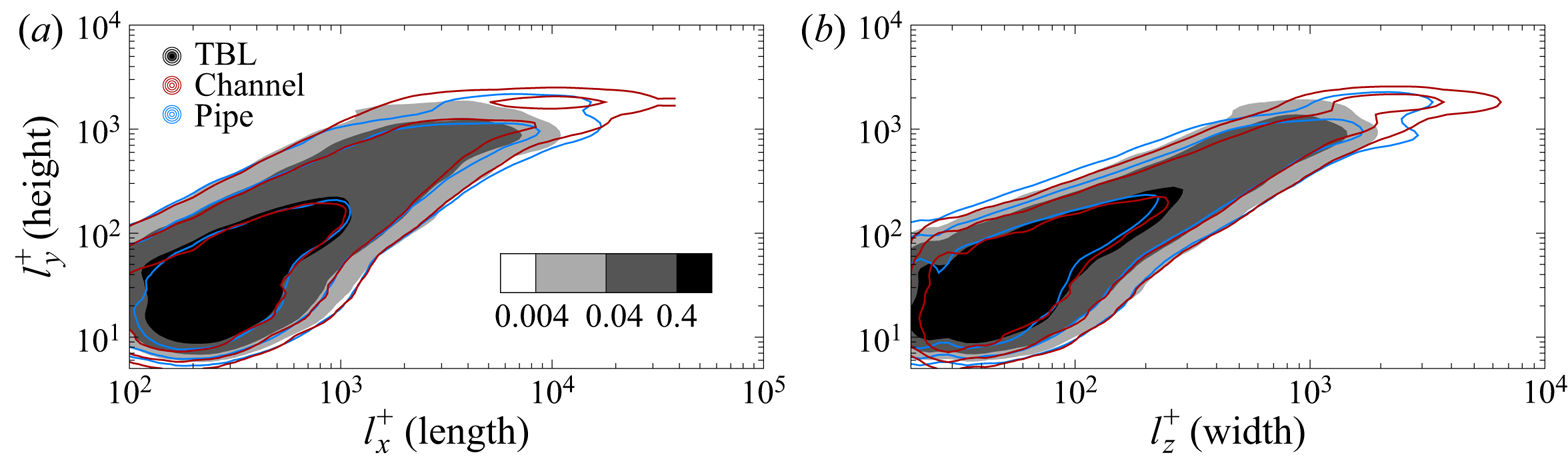
To quantify the geometrical features of wall-attached structures, the joint probability density functions of the sizes of the identified structures are plotted in figure 2. Here, the shaded, red line and blue line contours denote the datasets of the TBL, channel and pipe flows, respectively. In general, the length ( $l_x$) and width (
 $l_z$) of the structures increase with increasing heights (
 $l_y$) in all three flows. Interestingly, the distributions of
 $l_x$ and
 $l_z$ show a reasonably good collapse over a wide range of
 $l_y$ except for
 $l_y \approx O(\delta )$. This result indicates that the geometric features of the wall-attached
 $u$ structures in the inner region are presumably universal in canonical wall turbulence. On the other hand, there are very large-scale structures with
 $l_y \approx O(\delta )$, and some with
 $l_y \approx 2\delta$, in internal flows (red and blue line contours), which is consistent with the largest clusters of ejections or sweeps in channel flows (Lozano-Durán et al. Reference Lozano-Durán, Flores and Jiménez2012). The sizes of these structures are analogous to those of very large-scale motions (Kim & Adrian Reference Kim and Adrian1999) or global modes (del Álamo et al. Reference del Álamo, Jiménez, Zandonade and Moser2004) reported in internal flows. In TBL, very tall structures (
 $l_y \approx O(\delta )$) are associated with superstructures (Hutchins & Marusic Reference Hutchins and Marusic2007) because
 $l_x$ extends over
 $6\delta$ (see figure 1
 $a$) and they are physically attached to the wall (i.e. footprints in the near-wall region). Recent studies (Hwang & Sung Reference Hwang and Sung2018; Baars & Marusic Reference Baars and Marusic2020a; Yoon et al. Reference Yoon, Hwang, Yang and Sung2020) have reported that tall wall-attached structures are non-geometrically similar (or non-self-similar). In other words, this may reflect the fact that the statistical characteristics of these motions are non-universal and can be directly affected by the flow geometry. Hence, we need to filter out tall wall-attached structures in order to analyse the existence of self-similar features in the logarithmic layer (Hwang & Sung Reference Hwang and Sung2018; Baars & Marusic Reference Baars and Marusic2020a).
( $a$,
 $b$) Joint probability density functions of the logarithms of the streamwise length (
 $l_x$) and spanwise width (
 $l_z$) of wall-attached structures with respect to their wall-normal heights (
 $l_y$). Here, the shaded, red line and blue line contours indicate the datasets of the TBL, channel and pipe, respectively. Contour levels are logarithmically distributed.

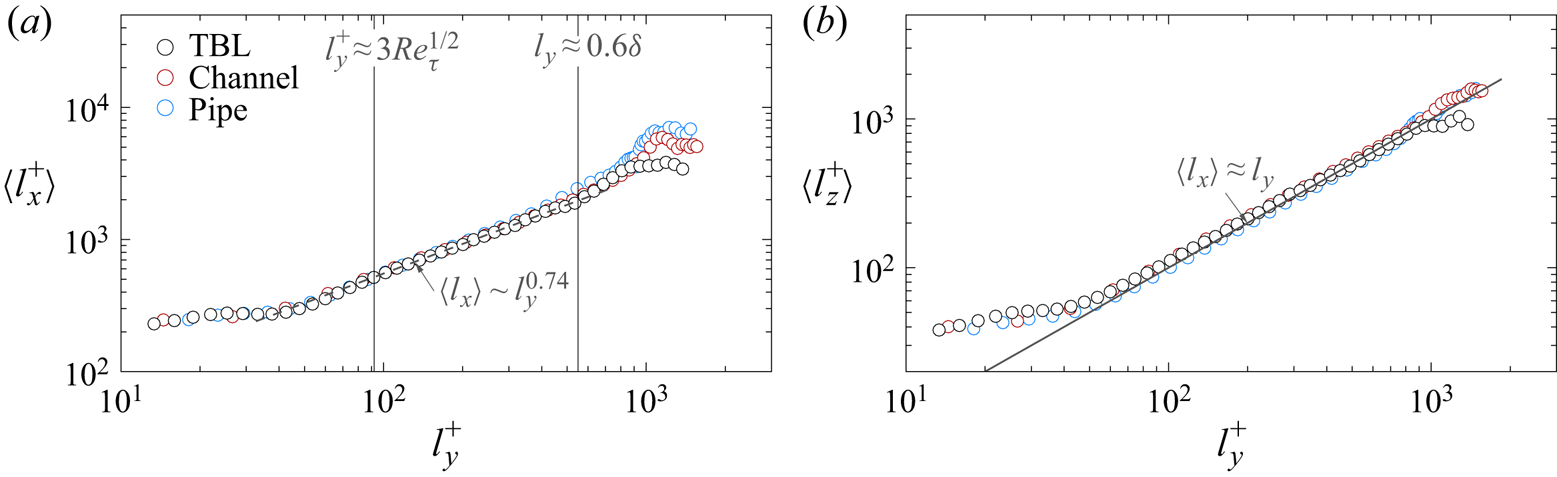
Figure 3 presents the variation of the mean streamwise length  $\langle l_x \rangle$ and the mean spanwise width
 $\langle l_z \rangle$ at a given
 $l_y$. The growth rates of
 $\langle l_x \rangle$ and
 $\langle l_z \rangle$ with respect to
 $l_y$ are comparable in all three flows. In figure 3(
 $b$), we can see the linear relationship
 $\langle l_z \rangle \sim l_y$ over
 $l_y^+ > 3Re_{\tau }^{1/2}$. In contrast,
 $\langle l_x \rangle$ shows a power-law behaviour (i.e.
 $\langle l_x \rangle \sim l_y^{0.74}$) over
 $3Re_{\tau }^{1/2} < {l_y}^+ < 0.6\delta ^+$ (figure 3
 $a$) in all three flows. For
 $l_y^+ \ge 0.6\delta ^+$, the distribution of
 $\langle l_x \rangle$ starts to deviate away from the power law (
 $\langle l_x \rangle \sim l_y^{0.74}$). Although there is no linear relationship for the wall-attached
 $u$ structures over
 $3Re_{\tau }^{1/2} \le l_y^+ < 0.6\delta ^+$ in figure 3(
 $a$), the sizes of the structures are scaled with
 $l_y$ and show a good agreement regardless of flow geometry. This result supports the supposition that the wall-attached structures in this range may share similar features. Moreover, the mean length
 $\langle l_x \rangle$ is approximately
 $3\delta$ at the upper limit
 $l_y^+ = 0.6\delta ^+$, which is consistent with the criteria to distinguish between large-scale and very large-scale motions (Guala et al. Reference Guala, Hommema and Adrian2006; Balakumar & Adrian Reference Balakumar and Adrian2007; Wu, Baltzer & Adrian Reference Wu, Baltzer and Adrian2012; Hwang, Lee & Sung Reference Hwang, Lee and Sung2016a; Hwang et al. Reference Hwang, Lee, Sung and Zaki2016b). This limit also corresponds to the criteria that distinguish self-similar structures from non-self-similar ones in an adverse-pressure-gradient TBL (Yoon et al. Reference Yoon, Hwang, Yang and Sung2020). Notably,
 $l_y^+ = 0.6\delta ^+$ is larger than the wall-normal location of the outer peak in the one-dimensional premultiplied spectra of
 $u$, which characterises very large-scale motions or superstructures. Given that
 $l_y$ is measured from the bounding box of each structure, the wall-parallel area of each structure is close to zero as
 $y$ approaches
 $l_y$, and they have the maximum wall-parallel area at
 $y < l_y$.
Mean length ( $\langle l_x \rangle$) and width (
 $\langle l_z \rangle$) of wall-attached structures as a function of
 $l_y$. In panel (
 $a$), the dashed line is
 $\langle l_x \rangle \sim l_y^{0.74}$ (Hwang & Sung Reference Hwang and Sung2018). In panel (
 $b$), the solid line corresponds to
 $\langle l_z \rangle \approx l_y$.

Hence, the wall-attached  $u$ structures can be classified into three components in terms of
 $l_y$: buffer-layer, self-similar and non-self-similar structures defined as
 $l_y^+ < 3Re_{\tau }^{1/2}$,
 $3Re_{\tau }^{1/2} \le l_y^+ < 0.6\delta ^+$ and
 $0.6\delta \le l_y^+$, respectively. Here, the lower bound (
 $= 3Re_{\tau }^{1/2}$ of self-similar structures corresponds to that of the logarithmic region in Marusic et al. (Reference Marusic, Monty, Hultmark and Smits2013) and Hwang & Sung (Reference Hwang and Sung2019), which is a mesolayer scaling (Afzal Reference Afzal1982; Wei et al. Reference Wei, Fife, Klewicki and McMurtry2005). Given that the viscous effect may affect the coherent motions in the logarithmic region (Hwang Reference Hwang2016), the bound
 $3Re_{\tau }^{1/2}$ is used in the present study. The present Reynolds number is
 $Re_{\tau } \approx 1000$ in which, in turn, the lower bound is approximately 100 wall units (i.e.
 $3Re_{\tau }^{1/2} \approx 100$), that is, a classical scaling for the lower bound of the logarithmic region (Perry & Chong Reference Perry and Chong1982). Since we focus on the logarithmic region where
 $y^+ > 100$, the variation of the lower bounds does not have a major impact on our conclusions.
The power law ( $\langle l_x \rangle \sim l_y^{0.74}$) for the WASS could be attributed to the low Reynolds number of the present data. At
 $Re_{\tau } \approx 3000$, the linear relationship (
 $\langle l_x \rangle \sim l_y$) was observed for
 $l_y^+ > 400$ in a turbulent pipe flow (Hwang & Sung Reference Hwang and Sung2019). Given
 $\langle l_z \rangle \sim l_y$, the wall-attached structures with
 $3Re_{\tau }^{1/2} \le l_y^+ < 0.6\delta ^+$ follow
 $\langle l_x \rangle l_y \sim \langle l_z \rangle ^{1.74}$, which is roughly quadratic. This behaviour is consistent with the scaling of the two-dimensional spectra of
 $u$ at
 $Re_{\tau } < 2000$ (del Álamo et al. Reference del Álamo, Jiménez, Zandonade and Moser2004) in which the energetic ridges of the spectra are aligned along
 $\lambda _x y \sim \lambda _z^2$ in the logarithmic region. Chandran et al. (Reference Chandran, Baidya, Monty and Marusic2017) reported that the two-dimensional spectra at low Reynolds number follow
 $\lambda _x y \sim \lambda _z^2$ whereas the larger scales tend to exhibit the linear law (
 $\lambda _x \sim \lambda _z$) at high Reynolds numbers (
 $Re_{\tau } = 26\,000$). Although we defined the length scales of wall-attached structures based on the sizes (
 $l_x, l_y$ and
 $l_z$) of the bounding box of each structure, this result supports the inference that
 $l_x, l_y$ and
 $l_z$ can be used to describe the characteristic length scales of the energetic motions in the logarithmic region. It should be noted that these scales are measured from the physically connected volumes of intense
 $u$, which consist of the energy contributions from a wide range of scales (or wavelengths). In § 3.2, the two-dimensional energy spectra are examined to elucidate the wavelength scales contained within the WASS.
To test the reliability of the present decomposition, we compute the streamwise turbulence intensity distributed among the three components of wall-attached  $u$ structures. The streamwise velocity fluctuations associated with each component (
 $u_i$) can be conditionally sampled based on the bounded volume of each object,
 \begin{equation} \left. \begin{gathered} u_{b}(\boldsymbol{x}) = \left\{ \begin{array}{ll} u(\boldsymbol{x}), & \text{if}\ \boldsymbol{x} \in \varOmega_b, \\ 0, & \text{otherwise}, \end{array} \right.\\ u_{ws}(\boldsymbol{x}) = \left\{ \begin{array}{ll} u(\boldsymbol{x}), & \text{if}\ \boldsymbol{x} \in \varOmega_{ws}, \\ 0, & \text{otherwise}, \end{array} \right.\\ u_{wn}(\boldsymbol{x}) = \left\{ \begin{array}{ll} u(\boldsymbol{x}), & \text{if}\ \boldsymbol{x} \in \varOmega_{ws}, \\ 0, & \text{otherwise}, \end{array} \right. \end{gathered} \right\} \end{equation}
where  $\varOmega _i$ denotes the positions of all contiguous points of each object. The subscripts
 $i$ b, ws and wn refer to wall-attached buffer-layer (
 $l_y^+ < 3Re_{\tau }^{1/2}$), self-similar (
 $3Re_{\tau }^{1/2} \le l_y^+ < 0.6\delta ^+$) and non-self-similar structures (
 $0.6\delta \le l_y^+$), respectively. This classification yields a computation of the streamwise turbulence intensity corresponding to the specific structure. For example, the streamwise turbulence intensity carried by WASS
 $\langle uu \rangle _{ws}$ can be obtained through the ensemble average of
 $u_{ws}u_{ws}$ at a given wall-normal position.
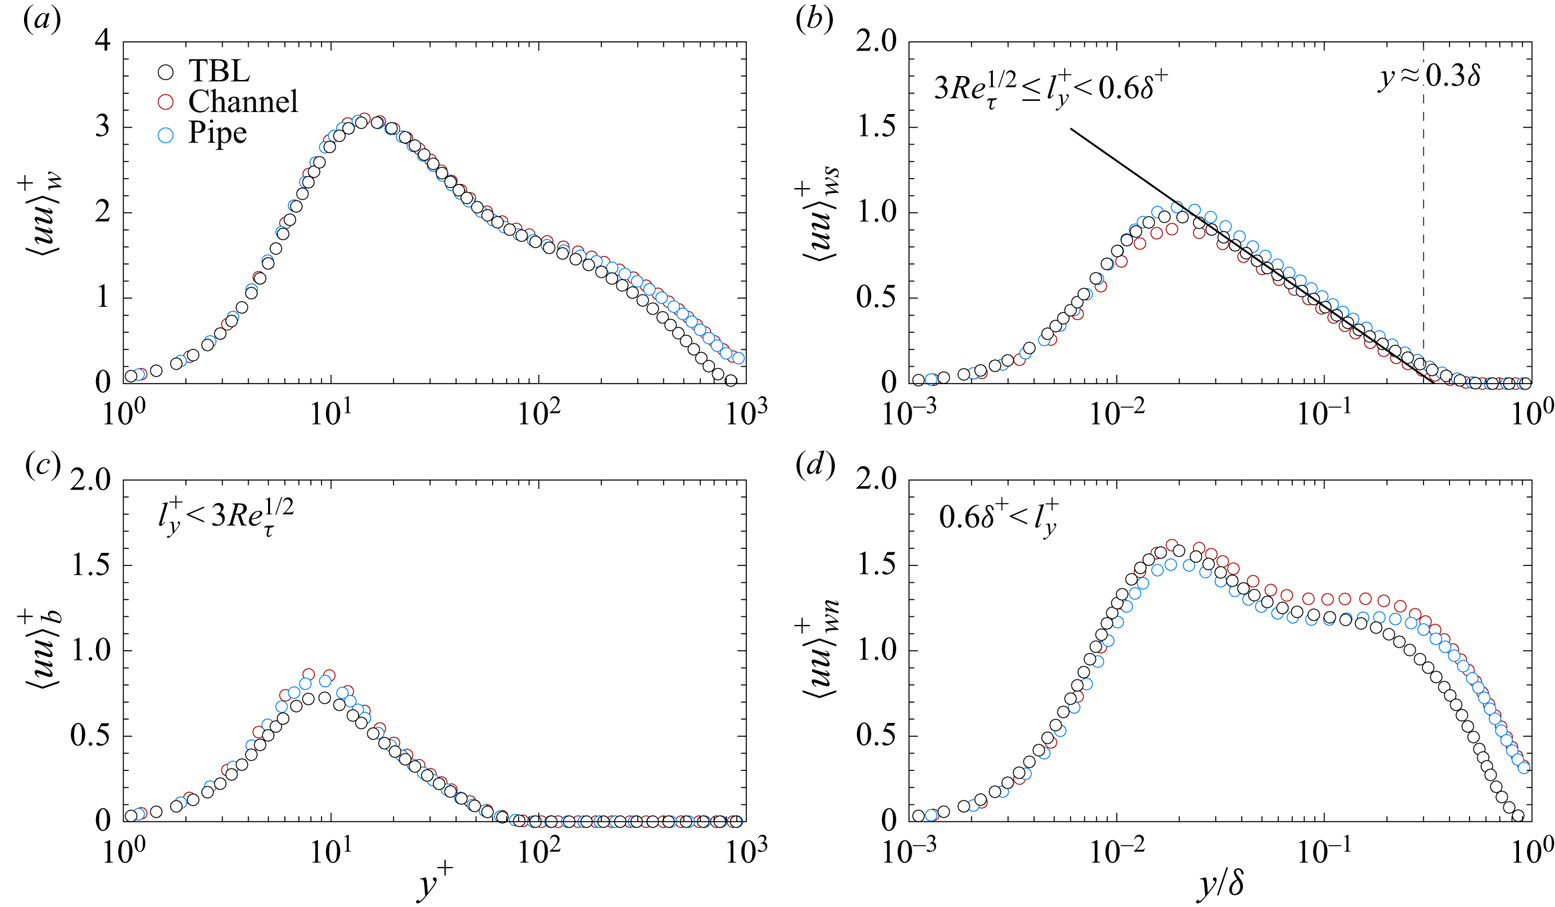
Figure 4 shows the wall-normal distributions of the streamwise turbulence intensity carried by the specific motion. Notably, we can observe the presence of the near-wall peak in all streamwise turbulence intensities because the identified structures physically adhere to the wall. Hence, the near-wall part (or footprint) of each object is related to the near-wall streaks (Kline et al. Reference Kline, Reynolds, Schraub and Runstadler1967), reflecting that the identified structures could be responsible for the near-wall turbulence. However, this is beyond the scope of the present work, which focuses on the logarithmic region. The total streamwise turbulence intensity ( $\langle uu \rangle _{w}$) contained within all three components is shown in figure 4(
 $a$). Here,
 $\langle uu \rangle _{w}$ is obtained using the streamwise velocity fluctuations within the wall-attached structures (
 $= u_b + u_{ws} + u_{wn}$). As seen, there is a complete collapse of the wall-normal profiles of
 $\langle uu \rangle _{w}$ in internal flows across the wall-normal direction. In contrast, the
 $\langle uu \rangle _{w}$ of TBL shows a discrepancy above the logarithmic region (
 $y^+ > 100$). This discrepancy occurs at a lower wall-normal location compared with the results of Monty et al. (Reference Monty, Hutchins, Ng, Marusic and Chong2009), who reported that the difference in
 $\langle uu \rangle$ between internal and external flows appears at
 $y > 0.5\delta$. Given that
 $\langle uu \rangle _{w}$ represents the collective contributions of the wall-attached structures, the deviation in figure 4(
 $a$) is due to the structures with
 $l_y^+ > 100$, which include WASS and wall-attached non-self-similar structures (WANS). The weak-
 $u$ region (
 $|u| < u_{rms}$) also significantly contributes to the total streamwise turbulence intensity because this region has a larger area fraction than the intense
 $u$ region (2.1). The area fraction of the wall-attached
 $u$ structures is only 6–7 % in the logarithmic region. However, the contribution of the wall-attached
 $u$ structures to the total turbulence intensity is approximately 40 %, which is comparable to that of the weak-
 $u$ region. This may lead to the absence of the logarithmic variation in the total streamwise turbulence intensity at the present
 $Re_{\tau }$ (Hwang & Sung Reference Hwang and Sung2018).
Wall-normal profiles of streamwise turbulence intensity carried by wall-attached structures: ( $a$)
 $\langle uu \rangle _w^+$; (
 $b$)
 $\langle uu \rangle _{ws}^+$; (
 $c$)
 $\langle uu \rangle _{b}^+$; and (
 $d$)
 $\langle uu \rangle _{wn}^+$. In panel (
 $b$), the solid line denotes a logarithmic variation corresponding to
 $\langle uu \rangle _{ws}^+ = 0.4 - 0.37\ln (y/\delta )$.

Figure 4( $b$) displays the streamwise turbulence intensity carried by the WASS (
 $\langle uu \rangle _{ws}$). In all three flows, the profiles of
 $\langle uu \rangle _{ws}$ show good agreement (figure 4
 $b$), indicating that the WASS are independent of the flow geometry (Perry et al. Reference Perry, Henbest and Chong1986). In addition, there is a logarithmic variation of up to
 $y = 0.3\delta$ in all three flows, reminiscent of Townsend's attached eddies. In figure 4(
 $c$), the streamwise turbulence intensity of the buffer-layer structures
 $\langle uu \rangle _b$ also exhibits a reasonable match in all three flows. Hence, the similarity in the streamwise turbulence intensity in all three flows (figure 4
 $b$,
 $c$) suggests that geometrical differences are negligible in the near-wall region.
In contrast, figure 4( $d$) shows that the
 $\langle uu \rangle _{wn}$ of internal flows appears to be larger than that of TBL in the outer region. This supports that the discrepancy in
 $\langle uu \rangle _w$ over the logarithmic region (figure 4
 $a$) originates from the non-self-similar nature of very tall structures (i.e. WANS), which extend from the near-wall region to the core region of internal flows. In addition, comparing pipe and channel data,
 $\langle uu \rangle _{wn}$ of the channel flow is larger than that of the pipe flow in the logarithmic region. This might be attributable to a larger population of very long
 $u$ streaks in the channel flow (Lee et al. Reference Lee, Ahn and Sung2015). Owing to pipe curvature, the sizes of very large structures could be restricted in pipe flows; this leads to the dominant contributions of large scales in the channel flow (Hwang et al. Reference Hwang, Lee and Sung2016a; Han et al. Reference Han, Hwang, Yoon, Ahn and Sung2019).
It is worth mentioning that the magnitude of the slope of the logarithmic variation in figure 4( $b$) is 0.37, which is lower than the Townsend–Perry constant reported in previous studies (1.26 by Marusic et al. (Reference Marusic, Monty, Hultmark and Smits2013), 0.98 by Baars & Marusic (Reference Baars and Marusic2020b) and 0.8–1.0 by Hu et al. (Reference Hu, Yang and Zheng2020)). This is due to the decomposition method used here in which
 $u_{ws}$ is zero at the outside of the identified structures (3.1). As a result, the magnitude of
 $\langle uu \rangle _{ws}$ decreases, which leads to a lower slope of the logarithmic variation. However, we primarily focus on the presence of the logarithmic variation in streamwise turbulence intensity and the collapse of the corresponding profiles in all three flows obtained from the classification of wall-attached
 $u$ structures in terms of height. The presence of the logarithmic variation could be a consequence of the spatial organisation (self-similarity and distributions) of WASS in the context of the AEH.
The present decomposition method filters wall-attached structures that are geometrically self-similar. By filtering out the contributions of WANS in the logarithmic region, we can analyse the spectral signature of self-similar coherent motions. In the next section, the two-dimensional energy spectra of  $u_{ws}$ are examined by focusing on the self-similar scaling laws proposed by Perry and coworkers (Perry & Abell Reference Perry and Abell1977; Perry & Chong Reference Perry and Chong1982; Perry et al. Reference Perry, Henbest and Chong1986), and on the energy distribution across the streamwise and spanwise wavelengths (
 $\lambda _x$ and
 $\lambda _z$) in the logarithmic region.
3.2. Two-dimensional spectra of WASS
The contribution of coherent motions ingrained within WASS to the streamwise variance is explored by computing the two-dimensional spectrum. The premultiplied two-dimensional spectrum of  $u_{ws}$,
 $\varPhi ^{2D}$, is defined as
 \begin{equation} \varPhi^{2D}(k_x, k_z, y) = k_x k_z \langle \hat{u}_{ws}(k_x, k_z, y) \hat{u}^{*}_{ws}(k_x, k_z, y) \rangle, \end{equation}
where  $k_x (= 2{\rm \pi} /\lambda _x)$ and
 $k_z (= 2{\rm \pi} /\lambda _z)$ are the streamwise and spanwise wavenumbers,
 $\hat {u}_{ws}$ indicates the Fourier coefficient of
 $u_{ws}$ and the asterisk denotes a complex conjugate. The streamwise variance of WASS (
 $\langle uu \rangle _{ws}$) is the integral of the corresponding two-dimensional spectrum over the wall-parallel wavenumbers. Notably,
 $l_x$ and
 $l_z$ of the identified structures, measured from the bounding box, do not necessarily represent the characteristic scales at a given wall-parallel plane (
 $y < l_y$) because the structures are inclined with respect to the wall and meander in the spanwise direction. Given that
 $u_{ws}$ represents the conditionally sampled
 $u$ which are contained within the WASS with
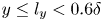 $y \le l_y < 0.6\delta$,
 $\varPhi ^{2D}$ could provide the energy distributions from the collective contribution of WASS. In other words, although the ranges of the corresponding physical length and width are 5–6
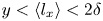 $y < \langle l_x \rangle < 2\delta$ and
 $y < \langle l_z \rangle < 0.6\delta$ (figure 3), the energy in
 $\varPhi ^{2D}$ is distributed across a wide range of wavelengths. This also supports the inference that the structures identified in the physical space consist of a broad range of turbulent motions related to the concept of nested hierarchies (Hwang & Sung Reference Hwang and Sung2018). Here, the energy contained in the very long and wide wavelengths (
 $\lambda _x > 6\delta$ and
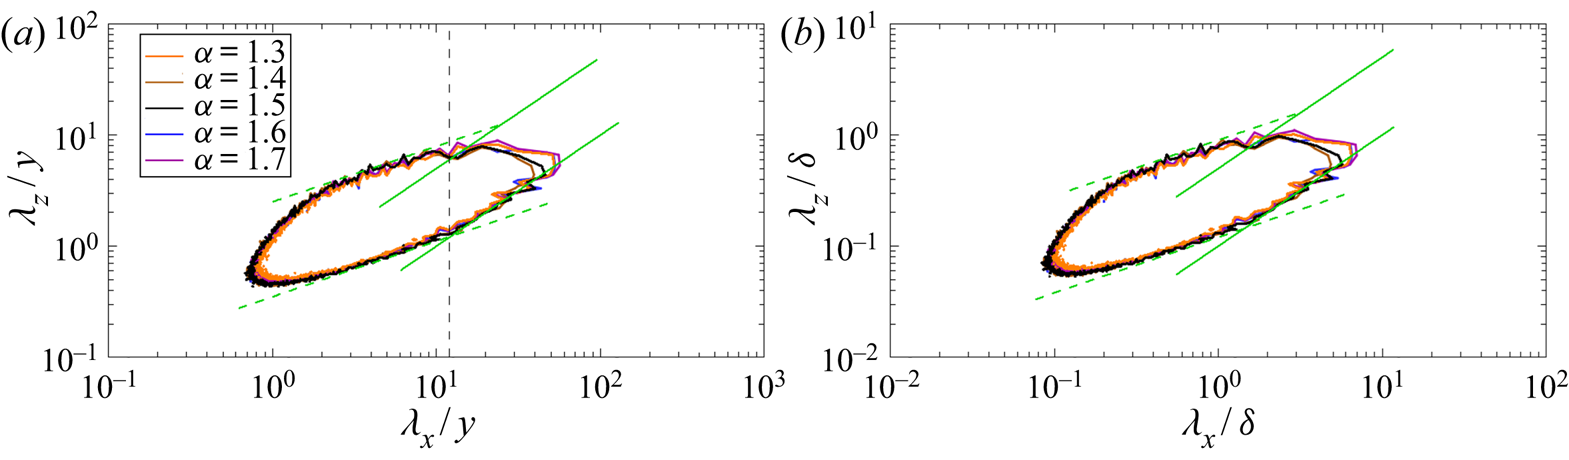
 $\lambda _z > \delta$), which correspond to global modes (del Álamo et al. Reference del Álamo, Jiménez, Zandonade and Moser2004; Jiménez & Hoyas Reference Jiménez and Hoyas2008), is negligible because the velocity fluctuations associated with WANS are subtracted. Hence, we can expect that the energy distribution demonstrates the spectral signature of self-similar coherent motions. The effect of the threshold
 $\alpha$ was examined and the results reported in this section remained qualitatively unchanged (see the Appendix).
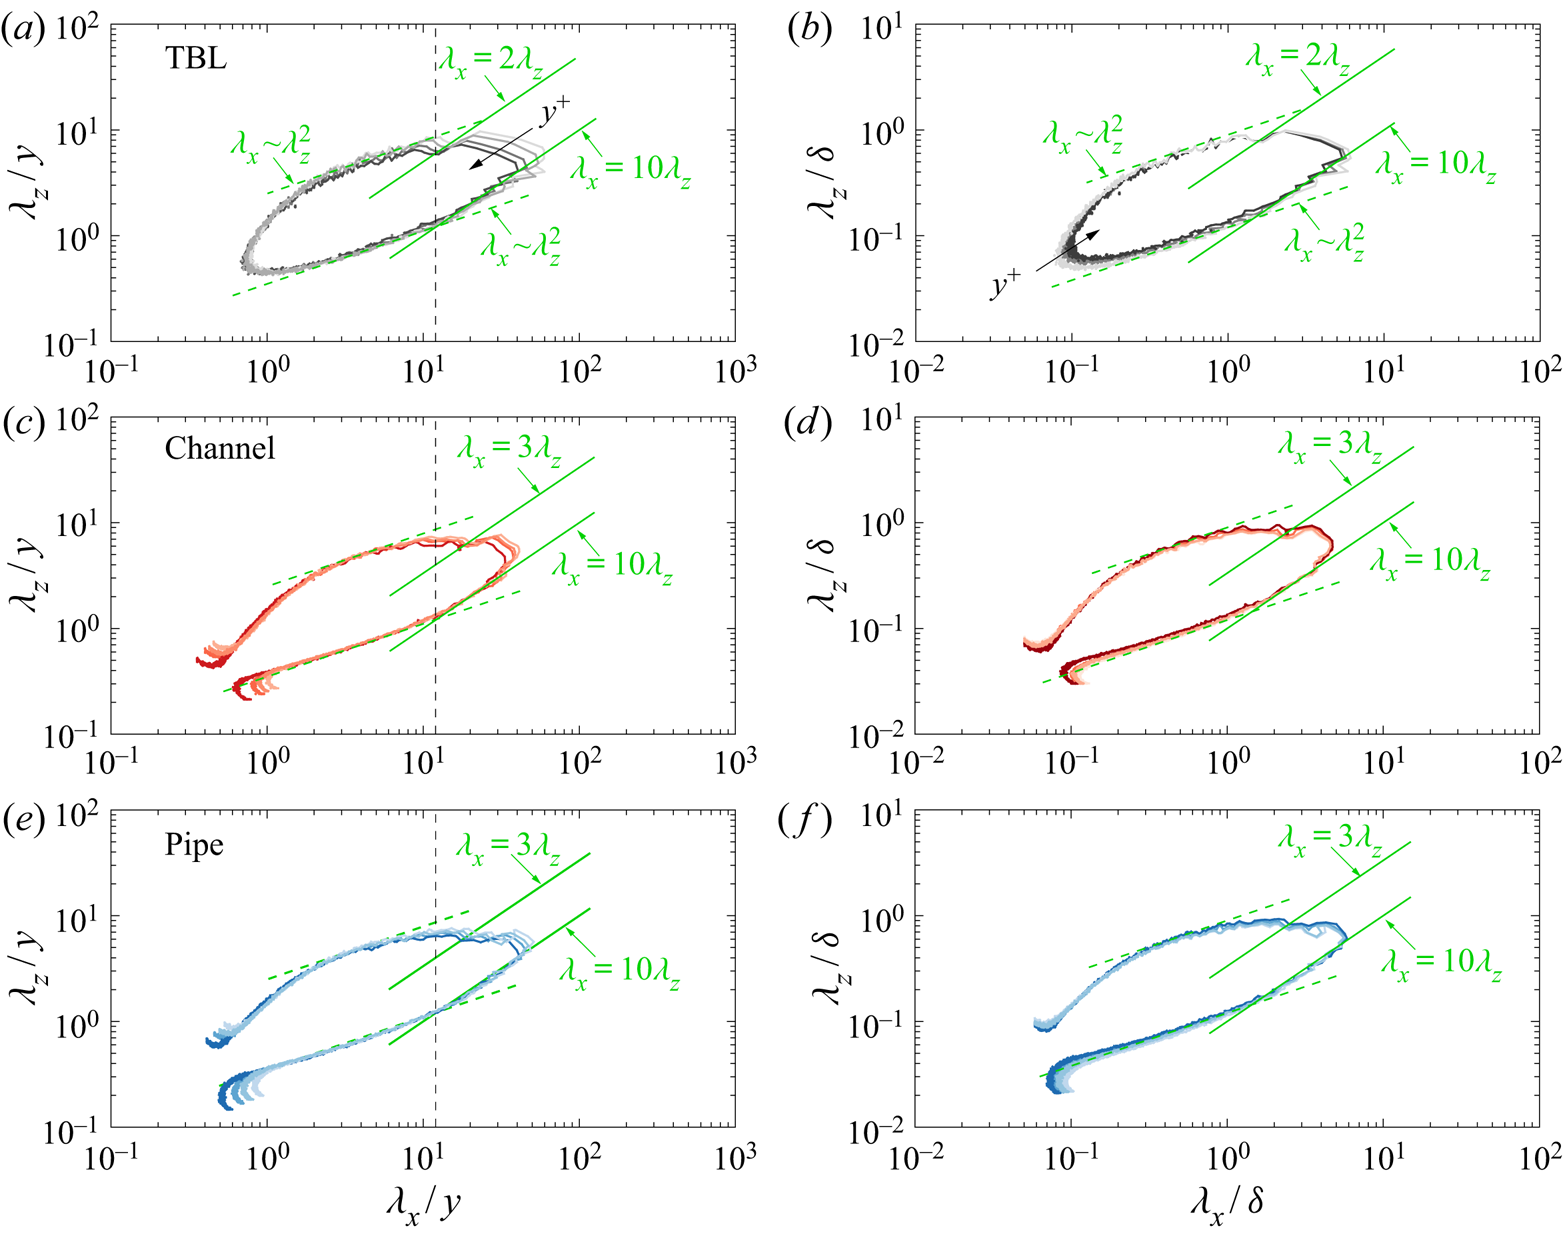
Figure 5 shows the contours of  $\varPhi ^{2D}$ at various wall-normal positions located in the logarithmic region (
 $y^+ = 100, 110, 120$ and
 $130$) for all three flows. Here,
 $\varPhi ^{2D}$ as a function of the wavelengths scaled with
 $y$ and
 $\delta$ is plotted in panels (a,c,e) and (b,d,f), respectively. In general, all three flows show that
 $\varPhi ^{2D}$ scales reasonably well with
 $y$ in the range
 $y < \lambda _x < 10y$ (figure 5
 $a{,}c{,}e$) and with
 $\delta$ in the range
 $\lambda _x > \delta$ (figure 5
 $b{,}d{,}f$). To further examine the spectral behaviour, the bounds of the constant energy distribution are denoted by the green lines. Here, the dashed and solid lines represent a square root
 $\lambda _x \sim \lambda _z^2$ and linear relationship
 $\lambda _x \sim \lambda _z$, respectively. The contours of
 $\varPhi ^{2D}$ in figure 5(
 $a{,}c{,}e$) are bounded by
 $\lambda _x \sim \lambda _z^2$ over the range
 $y < \lambda _x < 10y$. This is consistent with the results of the two-dimensional spectra of
 $u$, which include all coexisting motions, at low
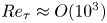 $Re_{\tau } \approx O(10^3)$ in the works of del Álamo et al. (Reference del Álamo, Jiménez, Zandonade and Moser2004) and Chandran et al. (Reference Chandran, Baidya, Monty and Marusic2017). According to del Álamo et al. (Reference del Álamo, Jiménez, Zandonade and Moser2004) and Chandran et al. (Reference Chandran, Baidya, Monty and Marusic2017), the linear relationship was absent in the large-scale range at low
 $Re_{\tau }$. In the large-scale range (
 $\lambda _x > 12y$), however,
 $\varPhi ^{2D}$ are roughly aligned along
 $\lambda _x \sim \lambda _z$ (solid lines), which is an indicator of self-similarity. Moreover, the contour lines of
 $\varPhi ^{2D}$ collapse reasonably well along the lower bound
 $\lambda _x = 10\lambda _z$ with both
 $y$ and
 $\delta$ scaling in this large-scale range, reflecting the overlap arguments of self-similar energy-containing motions (Perry & Abell Reference Perry and Abell1977; Perry & Chong Reference Perry and Chong1982; Perry et al. Reference Perry, Henbest and Chong1986). This result also supports the existence of Townsend's attached eddies, even in low
 $Re_{\tau }$ (Hwang & Sung Reference Hwang and Sung2018), and further reveals that the WASS, defined in physical space, is tightly connected to the spectral signatures of the AEH in the framework used by Perry and coworkers.
Premultiplied two-dimensional energy spectra  $\varPhi ^{2D}$ across the logarithmic region (
 $y^+ = 100, 110, 120$ and
 $130$): (
 $a{,}b$) TBL; (
 $c{,}d$) channel; and (
 $e{,}f$) pipe. Light to dark shading indicates an increase in
 $y$. The contour level is
 $0.4$ times each of the maxima. Here
 $\varPhi ^{2D}$ is plotted as a function of the wall-parallel wavelengths (
 $\lambda _x$ and
 $\lambda _z$) normalised by
 $y$ (
 $a$,
 $c$,
 $e$) and
 $\delta$ (
 $b$,
 $d$,
 $f$). The green dashed and solid lines denote
 $\lambda _x \sim \lambda _z^2$ and
 $\lambda _x \sim \lambda _z$, respectively. The vertical dashed line indicates
 $\lambda _x = 12y$.

It is worth noting that the linear relationship of the upper bound in the large-scale range ( $\lambda _x \approx 2\text{--}3\lambda _z$) seems to appear over a small range owing to low
 $Re_{\tau }$. At high
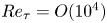 $Re_{\tau } = O(10^4)$, the upper and lower bounds of the two-dimensional spectra follow the linear relationship in the large-scale range (Chandran et al. Reference Chandran, Baidya, Monty and Marusic2017; Deshpande et al. Reference Deshpande, Chandran, Monty and Marusic2020). As shown in figure 5(
 $b{,}d{,}f$), the contour lines of
 $\varPhi ^{2D}$ in the large scale range are aligned along the horizontal line
 $\lambda _z \approx 0.8\delta$. Given that the growth of energy-containing motions can be restricted as their heights reach
 $\delta$, there may not be enough space to maintain large-scale self-similar motions at the present Reynolds number. According to the AEH, self-similar energy-containing motions fill in the scale separation between
 $\nu /u_{\tau }$ and
 $\delta$. At high Reynolds numbers, it can be conjectured that the contours of
 $\varPhi ^{2D}$ in the outer scaling would move to the bottom left-hand corner and lead to a clear upper bound that follows the linear behaviour. This upper bound may lie below
 $\lambda _x = \lambda _z$ (i.e. a higher slope than unity) due to the inclination nature of wall-attached
 $u$ structures (figures 1 and 3
 $a$). In other words, it may imply that self-similar behaviour can be observed when large-scale energy-containing motions have a high aspect ratio
 $\lambda _x/\lambda _z$ (Chandran et al. Reference Chandran, Baidya, Monty and Marusic2017).
As discussed, the linear behaviour of the lower bound ( $\lambda _x = 10\lambda _z$) is observed in the large-scale range where
 $\lambda _x > 12y$ (denoted by vertical dashed lines in figure 5
 $a{,}c{,}e$). Such a feature is found in all three flows indicative of the universality of the self-similar nature of the large scales contained within WASS. In addition,
 $\lambda _x > 12y$ is consistent with the lower limit of the
 $k_x^{-1}$ region in channel flows (Hwang Reference Hwang2015), and is close to the inner-scaling limit (
 $\lambda _x = 14y$) of self-similar motions in TBLs over a wide range of
 $Re_{\tau }$ (Baars et al. Reference Baars, Hutchins and Marusic2017). A recent study by Deshpande et al. (Reference Deshpande, Chandran, Monty and Marusic2020) also found the existence of linear behaviour in two-dimensional cross-spectra of wall-coherent
 $u$ motions over a similar range (i.e.
 $\lambda _x > 15y$). This shows that the WASS identified in the present study is directly related to the self-similar behaviour in the wavenumber space. In § 3.3, the one-dimensional spectra of WASS are examined to observe the presence of the
 $k_x^{-1}$ region over a similar large-scale range (
 $\lambda _x > 12y$), which was absent in the aforementioned study.
It is worth mentioning that  $u_{ws}$ could demarcate the rapid change in the raw
 $u$. Wall-attached
 $u$ structures are composed of multiple UMZs (Hwang & Sung Reference Hwang and Sung2018). Given that the UMZs are demarcated by a thin shear layer or large velocity gradient (Meinhart & Adrian Reference Meinhart and Adrian1995; Adrian et al. Reference Adrian, Meinhart and Tomkins2000), the boundaries of the identified structures may be one of the internal shear layers where the streamwise momentum exhibits a sharp change in the velocity. We can observe a rapid variation of the raw velocity signals near the edges of the identified structure; see figure 9 in Hwang & Sung (Reference Hwang and Sung2018). This result supports the inference that
 $u_{ws}$ can retain the spectral characteristics of the raw
 $u$ signals even if we artificially impose zero velocity outside of the identified structures. Srinath et al. (Reference Srinath, Vassilicos, Cuvier, Laval, Stanislas and Foucaut2018) also reported that binary representation of the negative-
 $u$ structures could preserve the spectral information of raw
 $u$ because of large changes in
 $u$ at the edges of the identified structures.
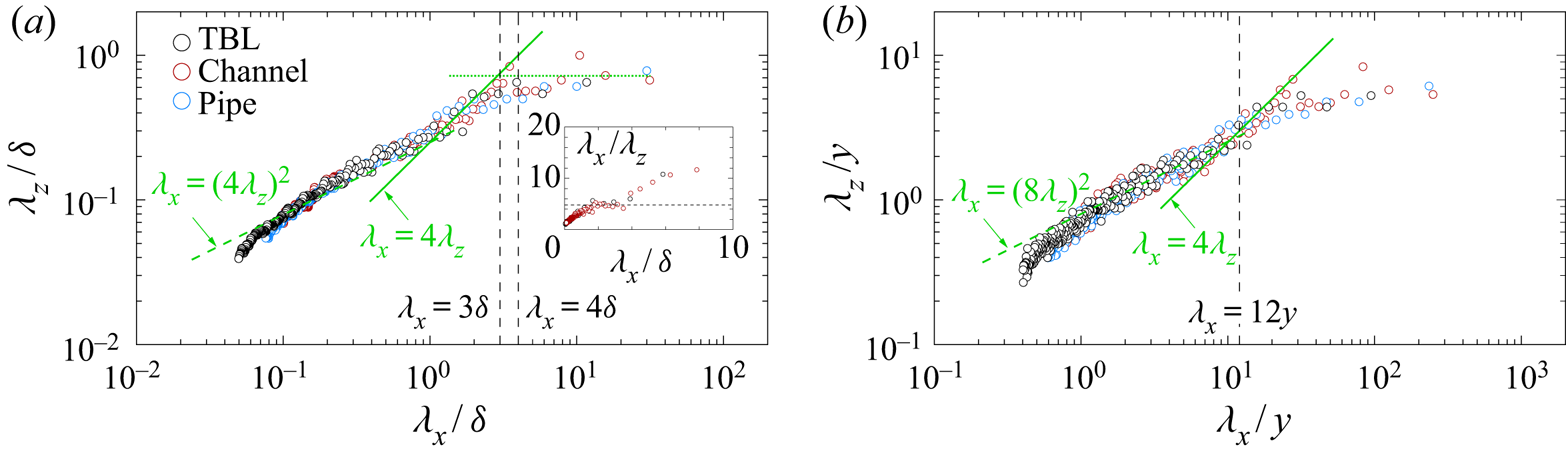
To further explore the energy contribution from self-similar motions, the spectral ridge of  $\varPhi ^{2D}$ is plotted in figure 6. Here, the spectral ridge is determined by identifying
 $\lambda _z$ corresponding to the maximum value of
 $\varPhi ^{2D}$ at a given
 $\lambda _x$. Hence, figure 6 represents the length scale (
 $\lambda _x$ and
 $\lambda _z$) relationship of the energetic motions. All of the spectral ridges are found to agree reasonably well over a wide range of scales. We can observe two growth rates: one with the power-law behaviour
 $\lambda _x \sim \lambda _z^2$ (dashed green line), and one with the linear relationship
 $\lambda _x \sim \lambda _z$ (solid green line) at relatively large scales. In addition, the transition of the ridges from the power law to the linear law appears at
 $\lambda _x = 12y$. This result is consistent with the variation of the lower and upper bounds of
 $\varPhi ^{2D}$ found in figure 5 and reflects that the dimensions of the energetic motions behave in an analogous manner to the wavelength relationship of the bounds (i.e. self-similarity). It is noted that the spectral ridges flatten for
 $\lambda _x > 3\text{--}4\delta$ because at this very long
 $\lambda _x$ the spanwise wavelength
 $\lambda _z$ reaches
 $\delta$, and the growth of
 $\lambda _z$ is restricted. A similar spectral trend was observed in Chandran et al. (Reference Chandran, Baidya, Monty and Marusic2017) and Deshpande et al. (Reference Deshpande, Chandran, Monty and Marusic2020). Given that the wall-attached
 $u$ structures follow
 $\langle l_z \rangle \approx l_y$ (figure 3
 $b$), it may reflect the saturation in their spanwise growth. Although the motions related to these scales are non-self-similar, the energy contribution from the range
 $\lambda _x > 3\text{--}4\delta$ and
 $\lambda _z > 0.8\delta$ is negligible, as shown in figure 5, since
 $\varPhi ^{2D}$ is obtained from
 $u_{ws}$ (3.1).
Energetic ridges of the premultiplied two-dimensional energy spectra  $\varPhi ^{2D}$ at
 $y^+ = 120$. Here, the positions of the ridges are obtained by identifying
 $\lambda _z$ of the maximum
 $\varPhi$ at a given
 $\lambda _x$. The dashed and solid green lines represent the power-law (
 $\lambda _x = (4\lambda _z)^2$) and linear relationships (
 $\lambda _x = 4\lambda _z$), respectively. In panel (
 $a$), the inset shows the lin–lin plot of the ridge scale ratio
 $\lambda _x / \lambda _z$ for the TBL and channel data. The horizontal dashed line denotes a constant ratio
 $\lambda _x / \lambda _z \approx 4.$.

In figure 6, the linear behaviour seems to follow  $\lambda _x \approx 4\lambda _z$ over the range
 $12y < \lambda _x < 3\text{--}4\delta$. Here, the inset shows the ridge scale ratio
 $\lambda _x / \lambda _z$ for the TBL and channel data. The data over this range are not very far from the dashed line (
 $\lambda _x / \lambda _z \approx 4$). Hence, the range of the self-similar energetic motions ingrained in WASS can be expressed by
 \begin{gather} 12y < \lambda_x < 3\text{--}4\delta, \end{gather}
 \begin{gather}3y < \lambda_z < 0.8\text{--}1\delta. \end{gather}
Here, the upper limit for the streamwise wavelength in (3.3a) is  $3\text{--}4\delta$, similar to that of the criteria that distinguishes large-scale motions and very large-scale motions (Guala et al. Reference Guala, Hommema and Adrian2006; Balakumar & Adrian Reference Balakumar and Adrian2007; Wu et al. Reference Wu, Baltzer and Adrian2012; Hwang et al. Reference Hwang, Lee and Sung2016a). In particular, the upper limit of the TBL (
 $\approx 3\delta$) is relatively smaller than that of the internal flows (
 $\approx 4\delta$), which may be related to the dominant contribution of very long scales in internal flows (Monty et al. Reference Monty, Hutchins, Ng, Marusic and Chong2009). Given that the contours of
 $\varPhi ^{2D}$ are restricted to below
 $\lambda _x \approx 3\text{--}4\delta$ in figure 5, this result also supports that
 $\varPhi ^{2D}$ is composed of the contribution from the turbulence motions that include large-scale motions and relatively smaller motions.
It is worth mentioning that a similar linear relationship of wall-attached  $u$ structures was found by Hwang & Sung (Reference Hwang and Sung2019), who showed that the physical length and width of WASS exhibit
 $\langle l_x \rangle = 4\langle l_z \rangle$ in a higher Reynolds number pipe flow (
 $Re_{\tau } \approx 3000$). This result may reflect that, although there is no linear behaviour in the physical length (
 $\langle l_x \rangle$) of WASS (figure 2), the large-scale motions ingrained in WASS are self-similar at a lower
 $Re_{\tau }$. In addition, these motions become prominent in the physical space when there is enough space in the logarithmic region caused by the length scale separation. According to Deshpande et al. (Reference Deshpande, Chandran, Monty and Marusic2020), the two-dimensional spectra of wall-coherent motions at
 $Re_{\tau } \approx 15\,000$ are aligned along a linear ridge
 $\lambda _x = 7 \lambda _z$, which is slightly steeper compared with the proportionality
 $\lambda _x = 4\lambda _z$ found in the present work. However, the spectra reported by Deshpande et al. (Reference Deshpande, Chandran, Monty and Marusic2020) include the contributions from both wall-attached self-similar and non-self-similar motions. Given that very large scales can contaminate self-similar behaviours of turbulent motions (Jiménez & Hoyas Reference Jiménez and Hoyas2008; Hwang & Sung Reference Hwang and Sung2018; Han et al. Reference Han, Hwang, Yoon, Ahn and Sung2019), it would be instructive in future efforts to examine the energetic ridges of
 $\varPhi ^{2D}$ over a wide range of
 $Re_{\tau }$.
The two distinct ridges might reflect a bimodal behaviour of self-similar energy-containing motions. In turbulent channel flows, Hwang (Reference Hwang2015) found that the energy-containing motions consist of two distinct motions, of which one is related to long streaky motions ( $\lambda _x \approx 10\lambda _z$) and the other is associated with packets or clusters of vortical motions (
 $\lambda _x \approx 2\text{--}3\lambda _z$). The aspect ratio (
 $\lambda _x/\lambda _z$) of the latter motion carrying all velocity components of the turbulent kinetic energy is approximately similar to that of the WASS in the present work. This also agrees with the dimensions of tall vortex clusters (del Álamo et al. Reference del Álamo, Jiménez, Zandonade and Moser2006) and tall ejection/sweep clusters (Lozano-Durán et al. Reference Lozano-Durán, Flores and Jiménez2012); here, the use of ‘tall’ denotes structures that extend beyond the logarithmic region. Owing to low
 $Re_{\tau }$ in the present work, the growth of self-similar motions was restricted by (3.3), which in turn leads to a lower contribution of self-similar motions with a high aspect ratio in the logarithmic region. As shown in figure 5, the lower bound of
 $\varPhi ^2D$ is aligned along
 $\lambda _x = 10 \lambda _z$ and presents the
 $y$ and
 $\delta$ scalings simultaneously. The high aspect ratio motions are dominantly ingrained in WANS at the present
 $Re_{\tau }$ and thus we may not observe the self-similarity of the high aspect ratio motions (
 $\lambda _x/\lambda _z = 7$) in the range (3.3a).
3.3. One-dimensional spectra of WASS
In this section, we examine the one-dimensional spectra to further analyse the self-similar scaling observed in the two-dimensional spectra. According to Perry and coworkers (Perry & Abell Reference Perry and Abell1977; Perry & Chong Reference Perry and Chong1982; Perry et al. Reference Perry, Henbest and Chong1986), the  $k_x^{-1}$ scaling in the one-dimensional spectra of
 $u$ can serve as a spectral signature of energy-containing motions satisfying the AEH. Although Nickels et al. (Reference Nickels, Marusic, Hafez and Chong2005) reported the presence of the
 $k_x^{-1}$ region, such a scaling has remained ambiguous at extremely high
 $Re_{\tau }$ (Rosenberg et al. Reference Rosenberg, Hultmark, Vallikivi, Bailey and Smits2013). It seems that the
 $k_x^{-1}$ region may exist when the one-dimensional spectra are plotted in the log–log form (Vallikivi et al. Reference Vallikivi, Ganapathisubramani and Smits2015), but the log–log plot of the one-dimensional spectra without premultiplication exaggerates the
 $k_x^{-1}$ scaling (Baars & Marusic Reference Baars and Marusic2020a). The ambiguity of such a scaling law is also related to the aliasing in the one-dimensional spectra because the one-dimensional streamwise spectra are a measure of average energy distribution without including the spanwise information; thus, the energy carried by smaller wavenumbers (i.e. large scales) can be contaminated (Tennekes & Lumley Reference Tennekes and Lumley1972; Davidson et al. Reference Davidson, Nickels and Krogstad2006). Given the fact that self-similar behaviours appear at large scales, this supports the claim that the
 $k_x^{-1}$ law is relatively hard to observe even when we can observe the logarithmic variation in the streamwise turbulence intensity (Hultmark et al. Reference Hultmark, Vallikivi, Bailey and Smits2012; Marusic et al. Reference Marusic, Monty, Hultmark and Smits2013). It is worth noting that Srinath et al. (Reference Srinath, Vassilicos, Cuvier, Laval, Stanislas and Foucaut2018) showed the relation between the wall-attached
 $u$ structures and one-dimensional spectra, i.e. the one-dimensional spectra follow a
 $k_x^{-1-p}$ scaling in which the exponent
 $p$ is related to the streamwise turbulence intensity within the identified structures. Although they found that the exponent
 $p$ becomes zero (i.e.
 $k_x^{-1}$ scaling) over
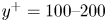 $y^+ = 100\text {--}200$, it has not been revealed whether this spectral behaviour is associated with the self-similar scaling in the two-dimensional spectra.
The analysis of the two-dimensional spectra can avoid the aliasing issue. By analysing the two-dimensional spectra, Chandran et al. (Reference Chandran, Baidya, Monty and Marusic2017) and Deshpande et al. (Reference Deshpande, Chandran, Monty and Marusic2020) successfully showed the existence of self-similar turbulent motions in the logarithmic region. However, there is no clear  $k_x^{-1}$ region over the range where the self-similarity appears in the two-dimensional spectra, although Deshpande et al. (Reference Deshpande, Chandran, Monty and Marusic2020) obtained the spectra of wall-coherent motions of
 $u$. The absence of the
 $k_x^{-1}$ region presumably originates from coexisting scales that are non-self-similar (Baars & Marusic Reference Baars and Marusic2020a; Yoon et al. Reference Yoon, Hwang, Yang and Sung2020). According to our previous work (Hwang & Sung Reference Hwang and Sung2018, Reference Hwang and Sung2019; Yoon et al. Reference Yoon, Hwang, Yang and Sung2020), it is necessary to identify self-similar structures in order to reveal the asymptotic behaviours of wall turbulence predicted by the AEH because of the multiscale nature of turbulence. As shown in § 3.2, the large scales (
 $\lambda _x > 12y$) contained in WASS exhibit self-similarity, and in particular the spectral ridges follow
 $\lambda _x = 4\lambda _z$ over the range (3.3). Hence, the one-dimensional streamwise and spanwise spectra of WASS are computed over the range of (3.3), and the corresponding premultiplied spectra are defined as
 \begin{gather} \varPhi^{1D}(k_x,y) = \int_{3y}^{0.8-1\delta}\varPhi^{2D}(k_x,k_z,y)\frac{{\rm d}\lambda_z}{\lambda_z}, \end{gather}
 \begin{gather}\varPhi^{1D}(k_z,y) = \int_{12y}^{3-4\delta}\varPhi^{2D}(k_x,k_z,y)\frac{{\rm d}\lambda_x}{\lambda_x}. \end{gather}
Here, the upper ends of the TBL and the internal flows are  $\lambda _x = 3\delta$ and
 $\lambda _x = 4\delta$, respectively, as discussed in § 3.2. The corresponding upper ends of the spanwise wavelength are
 $\lambda _z = 0.8\delta$ and
 $\lambda _x = \delta$ according to the linear relationship
 $\lambda _x = 4\lambda _z$ of the spectral ridge.
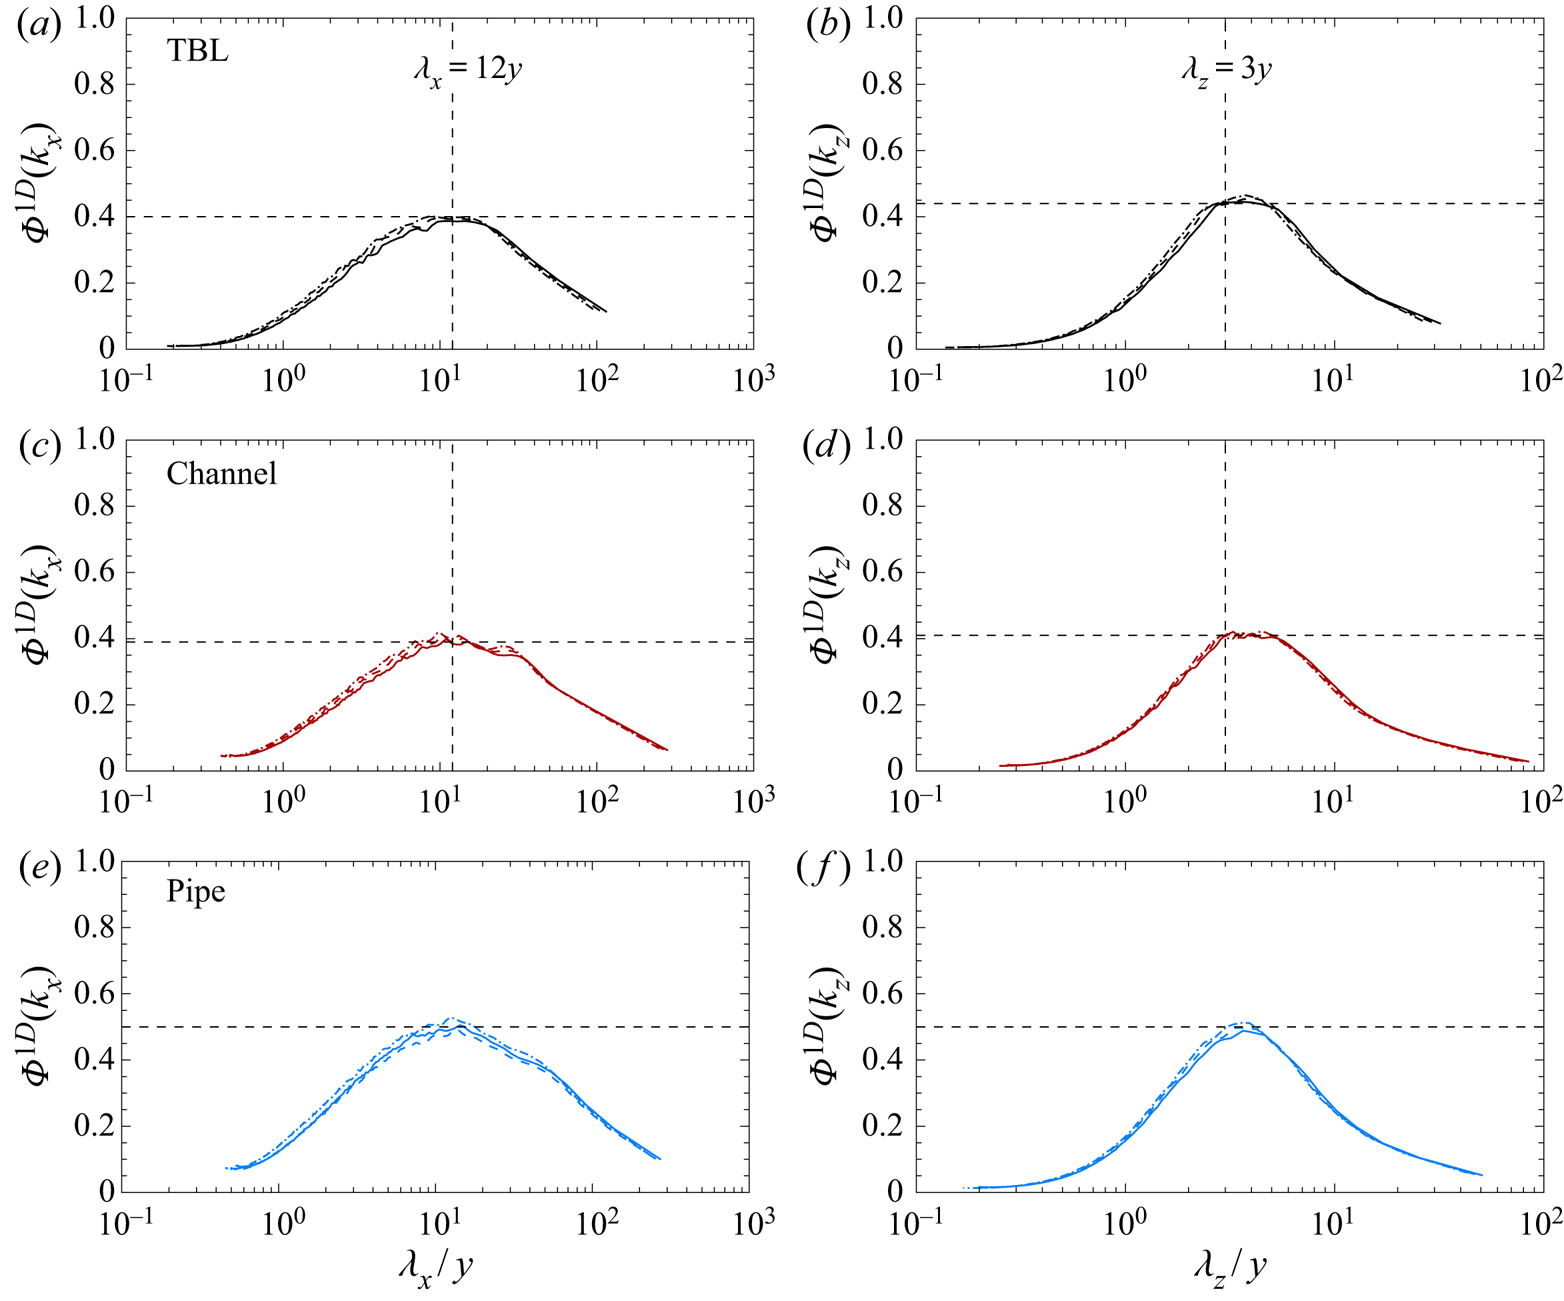
Figure 7 displays  $\varPhi ^{1D}(k_x)$ (panels a,c,e) and
 $\varPhi ^{1D}(k_z)$ (panels b,d,f) normalised by the energy of the fluctuations at a given
 $y$ obtained by integrating each
 $\varPhi ^{1D}$. In the TBL and channel data, we can see a plateau region in both
 $\varPhi ^{1D}(k_x)$ and
 $\varPhi ^{1D}(k_z)$, implying the possible
 $k_x^{-1}$ and
 $k_z^{-1}$ scaling. The lower limits of these regions are located at
 $\lambda _x = 12y$ and
 $\lambda _z = 3y$ (denoted by vertical dashed lines), consistent with those of the linear behaviour in the energetic ridges in (3.3). The plateau appears from
 $\lambda _x = 12y$ to
 $\lambda _x = 20y$ in figure 7(
 $a{,}c$). Given
 $y^+ \approx 100$ and
 $Re_{\tau } \approx 1000$, the upper limit of the
 $k_x^{-1}$ region in the outer unit is
 $\lambda _x \approx 2\delta$. Similarly, the
 $k_z^{-1}$ region is bounded by
 $3y < \lambda _z < 0.5\delta$ in figure 7(
 $b{,}d$). Interestingly, the range of the
 $k_x^{-1}$ spectra (
 $12y < \lambda _x < 2\delta$) is consistent with the bound suggested by Hwang (Reference Hwang2015) who examined an artificial channel flow that only resolves turbulent structures at a given spanwise length scale. This result supports the conjecture that the identification of self-similar motions is required in order to observe the
 $k_x^{-1}$ scaling region. Furthermore, such a scaling can be observed even for a low
 $Re_{\tau }$ if one extracts energy-containing motions properly. This claim also reflects the hierarchical nature of self-similar motions in the context of the AEH (Perry & Chong Reference Perry and Chong1982; Hwang & Sung Reference Hwang and Sung2018). Notably, Baars & Marusic (Reference Baars and Marusic2020a) also investigated the range of the
 $k_x^{-1}$ region based on the spectral filter obtained from spectral coherent analysis. Their filter depends on the Reynolds number leading to the dependence of the
 $k_x^{-1}$ region with
 $Re_{\tau }$ and they predicted that such a scaling region can appear for
 $Re_{\tau } > 60\,000$ at
 $y^+ = 100$. Srinath et al. (Reference Srinath, Vassilicos, Cuvier, Laval, Stanislas and Foucaut2018) also reported the appearance of the
 $k_x^{-1}$ region at
 $y^+ = 100$. These results give some evidence to support that
 $Re_{\tau }^{1/2}$ scaling may not be appropriate for representing the lower bound of the attached eddies (Baars & Marusic Reference Baars and Marusic2020a).
Premultiplied one-dimensional streamwise ( $a$,
 $c$,
 $e$) and spanwise (
 $b$,
 $d$,
 $f$) spectra
 $\varPhi ^{1D}$ obtained over the range (3.3) at
 $y^+ = 100$ (solid),
 $110$ (dashed) and 120 (dashed-dot): (
 $a$,
 $b$) TBL; (
 $c$,
 $d$) channel; and (
 $e$,
 $f$) pipe. Here, each spectrum is normalised by the energy of the fluctuations at a given
 $y$, obtained by integrating
 $\varPhi ^{1D}$. The horizontal dashed lines represent the plateaus or peaks of the respective spectra. The vertical lines denote
 $\lambda _x = 12y$ (
 $a$,
 $c$) and
 $\lambda _z = 3y$ (
 $b$,
 $d$).

According to Chandran et al. (Reference Chandran, Baidya, Monty and Marusic2017), the ratio of the peaks (or plateaus) in the one-dimensional streamwise and spanwise spectra corresponds to the power of the functions that characterise the lower and upper bounds in the two-dimensional spectra. In other words, the ratio ( $m$) is unity when the energy distribution in the two-dimensional spectra is bounded by the linear relationship, and thus the same magnitudes of the plateaus in the one-dimensional spectra indicate the existence of self-similar motions (Chandran et al. Reference Chandran, Baidya, Monty and Marusic2017; Deshpande et al. Reference Deshpande, Chandran, Monty and Marusic2020). In figure 7, the plateau magnitudes of
 $\varPhi ^{1D}(k_x)$ and
 $\varPhi ^{1D}(k_z)$ are approximately
 $0.4$ in the TBL and in the channel flow, which also supports the self-similarity in the large-scale region. In contrast to the TBL and channel data, there is no clear plateau in the pipe data (figure 7
 $e{,}f$). However, the magnitude of the peak is approximately
 $0.5$ in
 $\varPhi ^{1D}(k_x)$ and
 $\varPhi ^{1D}(k_z)$, indicating that the turbulent motions over the range (3.3) are responsible for the self-similar behaviour in the pipe flow. The absence of the
 $k^{-1}$ scaling in pipe flows may be a consequence of a difference in the flow geometry in which there is less space for wall-attached structures in the pipe flows with increasing
 $y$ when compared with the TBL or channel flows (Chung et al. Reference Chung, Marusic, Monty, Vallikivi and Smits2015). Given
 $m \approx 1.0$ in all three flows (figure 7), the present work solely extracts large-scale self-similar motions (3.3) contained in WASS.
The one-dimensional spectrum  $\varPhi ^{1D}$ shown in the present study was obtained by integrating
 $\varPhi ^{2D}$ over (3.3), where some evidence for self-similar scaling (
 $\lambda _x \sim \lambda _z$) is observed. Although the range of the
 $k^{-1}$ scaling region is relatively narrow owing to the low
 $Re_{\tau }$ of our data, the present study shows that such a region appears in a similar subrange of the self-similar scaling in
 $\varPhi ^{2D}$. Moreover, the ratio between the magnitudes of the plateau in the one-dimensional streamwise and spanwise spectra is close to unity, supporting that
 $\varPhi ^{2D}$ over (3.3) is characterised by
 $\lambda _x \sim \lambda _z$. Even at high
 $Re_{\tau }$ (
 $\approx 26\,000$), this ratio was found to be 0.79 by Chandran et al. (Reference Chandran, Baidya, Monty and Marusic2017) and 0.85 by Deshpande et al. (Reference Deshpande, Chandran, Monty and Marusic2020).
Given that  $\varPhi ^{1D}$ was computed over (3.3), and not the entire range of wavelengths, the integration of
 $\varPhi ^{1D}$ does not correspond to the streamwise turbulence intensity
 $\langle uu \rangle _{ws}$ in figure 4(
 $b$). Hence, the magnitude of the plateau in
 $\varPhi ^{1D}$ does not match with the slope in figure 4(
 $b$). However, the results support the inference that only the energy contained within (3.3) contribute to the
 $k^{-1}$ scaling and the energy contributions from other motions (i.e. the scales that are out of the range (3.3)) can contaminate the presence of the
 $k^{-1}$ region. This contamination could ultimately lead to the absence of the
 $k^{-1}$ region even when the turbulence intensity appears to follow the logarithmic variation in experiments with a high Reynolds number. This conclusion aligns with the work of Davidson et al. (Reference Davidson, Nickels and Krogstad2006) who argued the aliasing problem in the one-dimensional spectra was due to the shifting of energy to a longer wavelength Tennekes & Lumley (Reference Tennekes and Lumley1972). In other words, one-dimensional spectra can be contaminated when the spectra are measured over all the wavelengths; e.g. the energy contribution from short
 $\lambda _z$ (
 $\lambda _z < 3y$) is included at relatively long
 $\lambda _x$ (3.3a) in the one-dimensional streamwise spectra.
4. Conclusions
We have demonstrated that the WASS of streamwise velocity fluctuations ( $u$) exhibit self-similar behaviour in the context of Townsend's AEH, with special focus on the spectral contribution of turbulence motions contained within the identified structures. We extract the wall-attached structures of
 $u$ in the DNS data of a zero-pressure-gradient turbulent boundary layer, and turbulent channel and pipe flows at
 $Re_{\tau } \approx 1000$ by identifying the clusters of intense fluctuating regions in the instantaneous flow fields. The wall-attached structures of
 $u$ are decomposed into buffer-layer, self-similar and non-self-similar structures in terms of their height (
 $l_y$); particular attention is paid to the turbulent statistics contained within the self-similar structures. The variations in the physical sizes of WASS not only show a good agreement in all three flows but also scale with
 $l_y$. In addition, the streamwise turbulence intensity carried by WASS exhibits a logarithmic variation with a similar slope across the logarithmic region. On the other hand, the sizes of the tall wall-attached structures (
 $l_y > 0.6\delta$) are characterised by
 $\delta$ (i.e. non-self-similar) and the corresponding turbulence intensity shows a discrepancy among all three flows with an absence of the logarithmic variation. We also examine the two-dimensional spectra of
 $u$ within WASS to explore the spectral signatures of self-similarity proposed by Perry and coworkers. Across the logarithmic region, the lower and upper bounds of the two-dimensional spectra follow a linear relationship
 $\lambda _x \sim \lambda _z$ in the large-scale range (
 $\lambda _x > 12y$). Moreover, the spectral ridges exhibit
 $\lambda _x \approx 4\lambda _z$ over the range
 $12y < \lambda _x < 3\text{--}4\delta$, indicating that only the large-scale motions contained in WASS are self-similar. Based on this spectral band, the one-dimensional streamwise and spanwise spectra are obtained by integrating the two-dimensional spectra. They show some evidence for the existence of the
 $k_x^{-1}$ and
 $k_z^{-1}$ scaling in a similar subrange identified in the two-dimensional spectra. Although the range of such scalings is narrow due to low
 $Re_{\tau }$, the magnitudes of the plateau (or peak) in the streamwise and spanwise spectra are close to each other, representing
 $\lambda _x \sim \lambda _z$. Our results support that the asymptotic behaviours of turbulent statistics, predicted by the AEH, can be captured when we adequately filter out contributions from coexisting non-self-similar motions. It is shown that the logarithmic variation in the streamwise turbulence intensity, the self-similar scaling in the two-dimensional spectra, and the possible
 $k^{-1}$ scaling can be observed simultaneously in the case of instantaneous flow structures extracted by applying the same filter in canonical wall turbulence. Given the hierarchical distributions of attached eddies, the self-similar motions can exist even at low
 $Re_{\tau }$ although they are not statistically dominant owing to insufficient space in the logarithmic region. In this respect, the identified WASS are representative energy-containing motions satisfying the AEH and serve as a structural basis for explaining the asymptotic behaviours of wall turbulence. However, further study is required to conclude a definite bound and wall-normal location of the spectral overlap argument and to associate constants (e.g. Townsend–Perry constant) by exploring a wider range of
 $Re_{\tau }$.
Acknowledgements
This work was supported by the National Research Foundation of Korea (NRF) grant funded by the Korea government (MSIT) (no. 2020R1F1A104853711).
Declaration of interests
The authors report no conflict of interest.
Appendix. Effect of the structure-identification threshold
The wall-attached  $u$ structures defined in the present study (2.1) depend on the threshold value
 $\alpha$ because the structures are identified by extracting the physically connected volumes of intense fluctuations. However, it does not mean that we can use any arbitrary value of
 $\alpha$ to examine coherent structures. As
 $\alpha$ decreases, new structures arise, or some of the previously identified objects become connected. The maximum number of structures occurs in the vicinity of
 $\alpha = 1.5$, indicating that the former behaviour is dominant near
 $\alpha = 1.5$; see figure 2 in Hwang & Sung (Reference Hwang and Sung2018). In addition, the maximum volume of the identified object changes significantly near
 $\alpha \approx 1.5$, which represents the occurrence of the percolation crisis (Moisy & Jiménez Reference Moisy and Jiménez2004; del Álamo et al. Reference del Álamo, Jiménez, Zandonade and Moser2006; Lozano-Durán et al. Reference Lozano-Durán, Flores and Jiménez2012; Hwang & Sung Reference Hwang and Sung2018). In other words,
 $\alpha \approx 1.5$ effectively captures the intense
 $u$ structures. Hence, we examined the influence of the threshold value over a certain range in the vicinity of
 $\alpha \approx 1.5$. The threshold effect on the population density and the sizes of the bounding box was reported in Hwang & Sung (Reference Hwang and Sung2018). In this section, the influence of the threshold on the premultiplied two-dimensional spectra (
 $\varPhi ^{2D}$) is shown in figure 8. The value of
 $\alpha$ varies from 1.4 to 1.7 in the vicinity of the region where the percolation transition occurs (Hwang & Sung Reference Hwang and Sung2018). Notably, the maximum volume of the wall-attached structures decreases two times from
 $\alpha = 1.4$ to
 $\alpha = 1.7$ and the total number of the identified structures varies 10 % over this range. To avoid any repetition, we plot
 $\varPhi ^{2D}$ for TBL only. For comparison, we plot the green solid and dashed lines consistent with those in figure 5. We can see that all the contours collapse reasonably well. In particular, the linear relationship (
 $\lambda _x\ \lambda _z$) appears at
 $\lambda _x > 12y$, and the lower bounds align along
 $\lambda _x = 10\lambda _z$ regardless of the threshold. This supports the inference that the conditionally sampled flow field
 $u_{ws}$ can represent a continuous range of scales related to the energy-containing motions in the logarithmic region. Hence, the results remain qualitatively unchanged over the percolation transition region.
Premultiplied two-dimensional energy spectra  $\varPhi ^{2D}$ at
 $y^+ = 120$ in TBL with
 $\alpha = 1.3, 1.4, 1.5, 1.6$ and
 $1.7$. The green dashed and solid lines are consistent with those in figure 5. The vertical dashed line indicates
 $\lambda _x = 12y$.