This paper documents and analyzes consonant variation among 97 speakers of Ganluo Ersu (52 women, 45 men, ages 8–94), an endangered Tibeto-Burman language in southwestern China. Ganluo Ersu was traditionally spoken in a multilingual setting in contact with two distinct Sino-Tibetan languages: Nuosu (or Yi, Lolo-Burmese, Tibeto-Burman) and Southwestern Mandarin Chinese (xīnán guānhuà 西南官话, Sinitic, hereafter Mandarin) (e.g., Wu Da, Reference Da2004, Reference Da2015). Since the launching of Chinese economic reforms in the late 1970s, one of these contact languages, Mandarin, has become prestigious and dominant in the Ganluo Ersu community through intense contact with industrialized Chinese culture and language. The transition toward this unequal prestige relationship between contact languages has led to considerable variation and change in Ganluo Ersu. In the present study, we focus on four variables: (a) loss of retroflexes, (b) delateralization of the lateral fricative ([ɬ] ~ [x]), (c) devoicing of stops and affricates (e.g., [b] ~ [p]), and (d) simplification of onsets (e.g., [mb] ~ [b]). The observed patterns of variation suggest a trend of Ersu phonological convergence toward Mandarin, that is, the adjustment of the inventory of sounds in Ganluo Ersu to more closely match that of Mandarin. Our data furthermore suggest that the way that phonological convergence manifests itself is socially constrained and stratified, involving quantifiable factors of age, occupation, education, and speaker sex.
Our data lend insight into two key areas at the intersection of contact linguistics and sociolinguistics. First, our data contribute to the understanding of the role of socioeconomic stratification and other social factors in the process of contact-induced convergence. The significance of social factors in convergence in general and phonological convergence in particular has long been recognized in contact linguistics (e.g., Clyne, Reference Clyne2003:104–105, 115–116; Fishman, Reference Fishman1991; Grenoble & Whaley, Reference Grenoble and Whaley1998; Matras, Reference Matras2009:223–226; Poplack & Levey, Reference Poplack, Levey, Auer and Schmidt2010; Thomason, Reference Thomason2008, Reference Thomason and Hikey2009; Thomason & Kaufman, Reference Thomason and Kaufman1988; Winford, Reference Winford2003:54–56; inter alia). However, the empirical and theoretical ramifications in relation to phonological convergence in an endangered language, as in our study, are rarely interpreted from a quantitative variationist sociolinguistic perspective. Our Ganluo Ersu study helps fill this gap.
Second, our case study probes the generalizability of principles central to sociolinguistic theory, specifically, a correlation of patterns of linguistic variation with the social stratification of speech communities (Labov, Reference Labov1966, Reference Labov2001; Trudgill, Reference Trudgill1972, Reference Trudgill1974), in relation to a lesser-studied language. Ganluo Ersu villages (Figure 1) are far removed from the large Western urban centers where many classic sociolinguistic principles were founded. Located near the edge of the Tibetan plateau in Sichuan Province, the Ganluo Ersu language community differs drastically from New York City—geographically, socially, and linguistically. Can Labovian principles be effectively applied in such a setting? Are those principles relevant? Or are the society types simply too different? Labov (Reference Labov2016:586) discussed the need to examine these questions:
Though my New York City study was generally well received, I noted in the years that followed a tendency to regard it as a claim that class stratification of linguistic variables, measured by occupation, education, and income, would be found everywhere in the world. Of course, no such claim was intended. In fact, I wondered whether the techniques we had developed for the study of variation in the Western metropolis . . . would have any application to the study of little-known languages where the linguist is under an imperative to describe the basic elements and structures before the object of description disappears.
A long way from New York City: a small Ganluo Ersu village in rural Sichuan Province, western China.

In prior studies of indigenous languages, researchers have encountered situations where local social structures differ from Western industrialized societies to the extent that some Labovian principles are difficult to apply. Stanford (Reference Stanford2008, Reference Stanford2009) found that rural Sui communities of Guizhou Province have a strong sense of clan identity that provides the most important social patterns, not socioeconomic strata. Rural rice-farming Sui communities are relatively egalitarian, and clan-level linguistic variation far outweighs any patterns of sociolinguistic stratification. Likewise, Clarke (Reference Clarke2009:113) showed that the social patterns of the Sheshatshiu Innu of Labrador, Canada, do not naturally fit this part of the Labovian paradigm: “a classification scheme grounded in socioeconomic stratification, as per urban variationist studies (e.g., Labov, Reference Labov1966), was almost totally irrelevant.” Even so, she found evidence of other types of stratification: three territorial groups that showed varying levels of prestige. For Sheshatshiu Innu, socioeconomic status was not the crucial factor, but the community nonetheless had speech patterns that correlated with locally relevant social structure. This suggests a significant contrast in sociolinguistic patterns between the commonly studied urban Western communities and lesser-studied non-Western indigenous minority communities (Stanford & Preston, Reference Stanford2009). But what happens to those patterns when an indigenous minority community undergoes intense contact with a majority language? Our Ganluo Ersu study shows that when contact-induced phonological convergence occurs in an unequal prestige relationship, the convergence can be realized in terms of socially stratified, quantifiable variation. This suggests that classical Labovian sociolinguistic principles for age, sex, and social class (Labov, 1996, Reference Labov2001; Trudgill, Reference Trudgill1972, Reference Trudgill1974) may also be applicable to the study of a small indigenous community such as Ersu.
The remainder of the paper is structured as follows. We first provide background information on the Ersu people and their language. Following this, we introduce the study site and methods of data collection and analysis. We then discuss the results, summarize the findings of the study, and consider potential avenues for future research. The paper concludes with an appendix that provides the word list used for data collection.
BACKGROUND ON ERSU
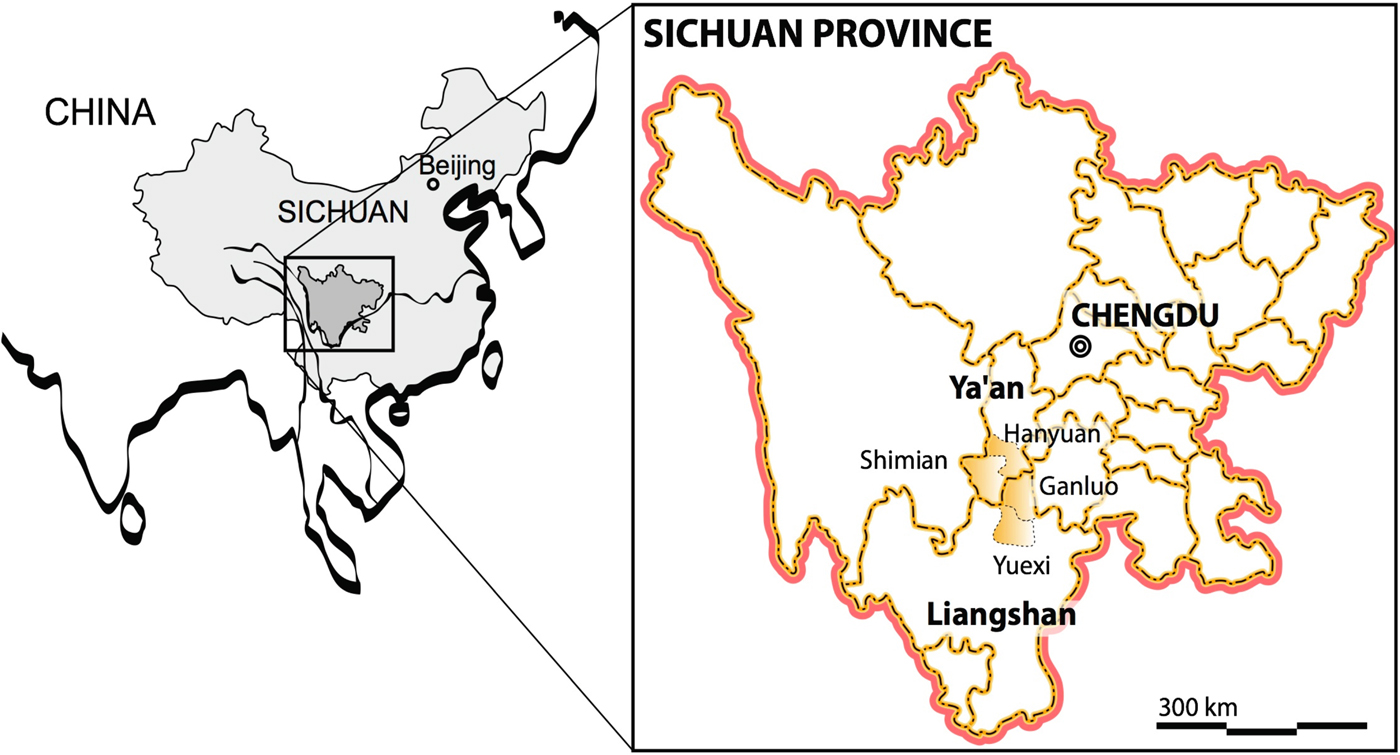
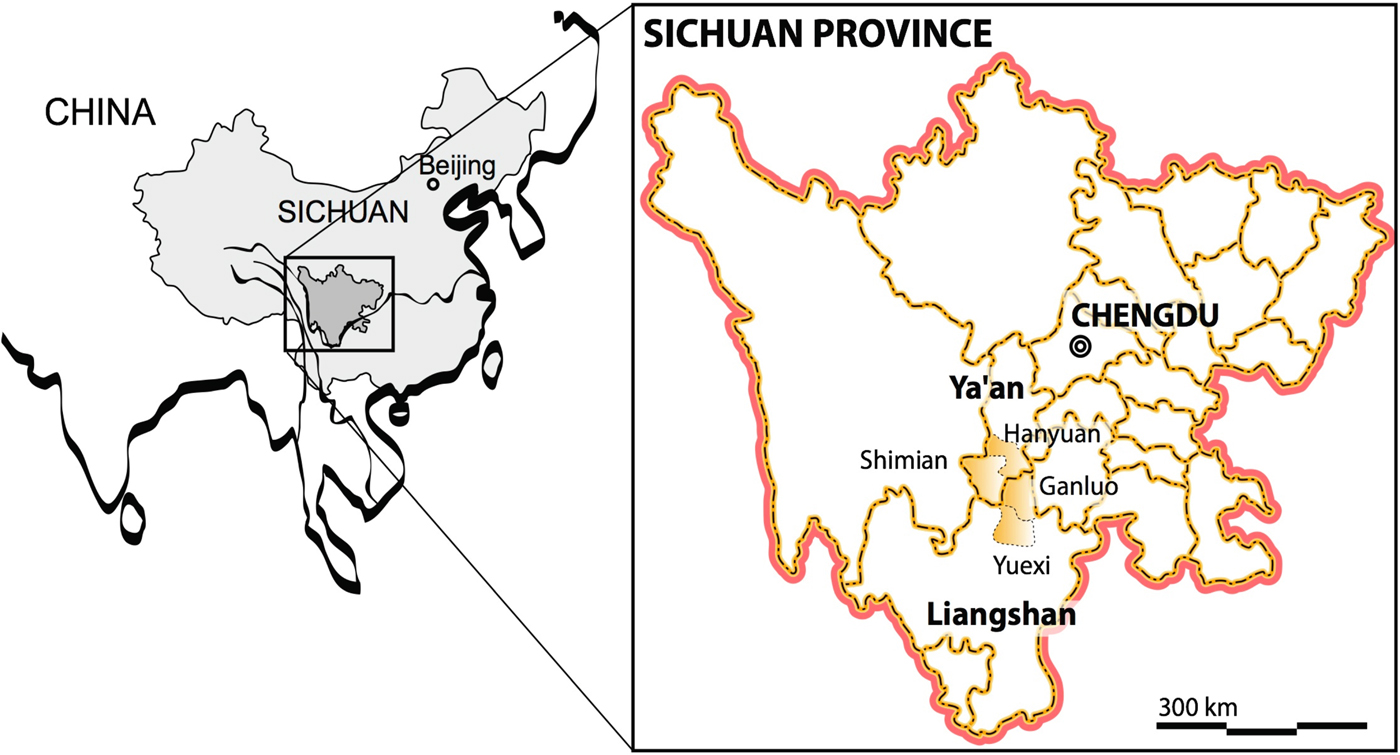
Ersu (/ə́˞-s̪v̩́ xò/, ěrsūyǔ 尔苏语, International Organization for Standardization's ISO-639 code ers) is a little-studied Tibeto-Burman language spoken in rural areas of Southwest China. Ersu is classified as a member of the Qiangic subgroup of Tibeto-Burman (see Bradley, Reference Bradley and Bradley1997:36–37; Chirkova, Reference Chirkova2012; Sun, Reference Sun1983, Reference Sun2001). It is spoken by approximately 8,000 people from an overall ethnic population of approximately 16,800 people in four counties in Sichuan Province (四川省) in the People's Republic of China (Sun, Reference Sun1982, Reference Sun1983; Wang, Reference Wang2010:207; Zhang, Reference Zhang2013:3–29). As Figure 2 shows, the four counties in which Ersu speakers reside are Ganluo (甘洛县) and Yuexi (越西县) in Liangshan Yi Autonomous Prefecture (凉山彝族自治州) and Shimian (石棉县) and Hanyuan (汉源县) in Ya'an Municipality (雅安市).
Distribution of the Ersu language (adapted from Chirkova et al., Reference Chirkova, Wang, Chen, Amelot and Antolík2015:188).
In all four counties, Ersu speakers are a minority and in contact with Nuosu and Mandarin, albeit to different extents. In the counties of Shimian and Hanyuan, Mandarin speakers form the ethnic majority, and the Ersu population is heavily Sinicized. Among the Ersu population in those two counties, reportedly only a few people are still proficient speakers of Ersu. In the counties of Ganluo and Yuexi, on the other hand, Nuosu speakers form the ethnic majority. In Yuexi in particular, Ersu settlements are interspersed with those of Nuosu, bringing them in close contact with the Nuosu language. Finally, Ganluo traditionally has the largest monolingual Ersu-speaking community (e.g., Munai, Reference Munai2015:33). According to our Ganluo Ersu language consultants, “the Ersu people in Yuexi have a Nuosu accent; the Ersu people of Shimian have a Chinese accent. The Ersu as spoken in Zela and Liaoping townships [both in Ganluo county] is the purest form of Ersu” (78-year-old woman, illiterate, farmer).
Traditionally, the Ersu people have been farmers, practicing swidden agriculture—with a focus on cultivating buckwheat—as a major livelihood strategy (Schmitt, Reference Schmitt2011, Reference Schmitt2014). Before the 1980s, they followed a custom of marrying strictly within their own group. But starting with Deng Xiaoping's Reform and Opening-Up Policy (gǎigé kāifàng 改革开放) in the late 1970s, following the Cultural Revolution (1966–1976), Ersu communities have been undergoing profound socioeconomic changes, as their region became more closely integrated into the Chinese state, as well as urbanization and environmental changes.
Integration with the national Chinese economy led to a shift from swiddening to cash crops (corn, potatoes, and soybeans). Implementation of the national reforestation program (tuìgēng huánlín 退耕还林 or Returning Farmland to Forest Program) initiated in 1999 led to an occupational shift from agriculture to nonagricultural sectors. As a consequence, Ersu working-age people (both men and women) now commonly seek jobs in urban areas, and they spend most of the year outside of their home villages. Institutional reforms (including the reinstatement of China's national college entrance examinations [gāokǎo 高考] in 1977) improved educational opportunities for young Ersu. The growing numbers of Ersu studying and working in urban areas also led to a change in marital practices. Intermarriages of Ersu people with Chinese and Nuosu are now very common.
The past decades have also witnessed important changes in the regional linguistic influences. Mandarin has firmly established itself as a regional dominant language and a local lingua franca, replacing Nuosu, the language of the local ethnic majority in that role. It is still possible to find older Ersu speakers (>60 years of age) who are monolingual in Ersu; bilingual in Ersu and Nuosu; or trilingual in Ersu, Nuosu, and Mandarin, but most younger speakers (<30 years of age) are bilingual in Ersu and Mandarin (Wu Da, Reference Da2004).
Ersu is phonologically monosyllabic and tonal, with a simple binary contrast between high and low tones. All documented varieties (Chirkova et al., Reference Chirkova, Wang, Chen, Amelot and Antolík2015; Liu, [1983] Reference Liu, Li and Liu2007; Sun, Reference Sun1982, Reference Sun1983; Zhang, Reference Zhang2013) have relatively simple vowel inventories (consisting of six to eight oral vowels), and complex consonant systems (consisting of 36 to 39 simple consonants and having a rich inventory of consonant clusters). Ersu is unwritten and not codified.
Ganluo Ersu appears to have the most complex consonant inventory of all Ersu varieties described to date. It has 39 simple consonant phonemes, a four-way contrast in affricates at the dental, alveolar, alveolopalatal, and retroflex places of articulation (/t̪s̪ tʃ ʈɽ tɕ/), and three types of clusters (prenasalized, clusters with a schwa-like segment, clusters with approximants).Footnote 1 The canonical Ganluo Ersu syllable has the following linear structure: (C1)(C2)(C3)V, where C1 can be nasal (/N/) or a schwa-like segment (/ə/); C2 can be any consonant; C3 can be either /w/ or /j/; V stands for vowel, and parentheses indicate optional constituents. Examples include /á/ ‘I, first person singular pronoun’, /t̪ʰá/ ‘millstone’, /t̪ʰwá/ ‘mule’, /Nt̪ʰwá/ ‘to be sharp’.
Variation and variables
One feature that distinguishes Ganluo Ersu from the Ersu varieties spoken in the remaining three counties, as well as from the neighboring languages Nuosu (Li & Ma, Reference Li and Ma1983) and Mandarin (e.g., Sichuan sheng Ganluo xian difangzhi bianzuan weiyuanhui, 1996:591–596; Yuan, Reference Yuan2001:24–39), is the presence of typologically uncommon trilled retroflex sounds, namely trilled retroflex affricates /ʈɽ ʈɽʰ ɖɽ/ and the retroflex trill /ɽ/. These typologically uncommon trilled sounds are seen by Ersu speakers as the hallmark of the purest form of Ersu. Currently, they are subject to much variation across all age groups. In addition, we observe delateralization of the lateral fricative, devoicing of stops and affricates, and simplification of onsets. Notably, all of the variables involve phonological distinctions that are not present in Mandarin, the dominant contact language, hence suggesting a trend of phonological convergence between Ersu and Mandarin.
Establishing change
How do we know that Ganluo Ersu is experiencing contact-induced change due to Mandarin rather than other sources of change (cf. Poplack, Walker, & Malcomson, Reference Poplack, Walker and Malcomson2006; Poplack, Zentz, & Dion Reference Poplack, Zentz and Dion2012; Torres Cacoullos & Travis, Reference Torres Cacoullos and Travis2010, Reference Torres Cacoullos and Travis2015, Reference Torres Cacoullos and Travis2016)? Paraphrasing Thomason (Reference Thomason2001:93–94), Poplack and Levey (Reference Poplack, Levey, Auer and Schmidt2010:410) stressed that in order to determine whether contact-induced change is occurring, researchers need to prove that the proposed interference features were not present in the precontact variety, prove that the proposed interference features were present in the source variety prior to contact, and rule out (or situate) internal motivations. These issues are addressed in turn.
1. The changes examined here have a relatively shallow time depth (from the late 1970s until present). The earlier attestations of Ganluo Ersu by Chinese linguists dating from the early 1980s (Liu, [1983] Reference Liu, Li and Liu2007; Sun, Reference Sun1982, Reference Sun1983) document a rich consonantal system with a voicing distinction in stops, affricates, and fricatives; a four-way contrast in affricates at the dental, alveolar, alveolopalatal, and retroflex places of articulation; a rhotic trill; and various types of consonant clusters. In addition, those early Ersu reports are consistent with our apparent-time plots, which provide strong evidence of the presence of all of these features among the current older generations. Inasmuch as the Apparent Time Hypothesis can be assumed here as elsewhere (Labov, Reference Labov1963), our apparent-time evidence points to a far less “Chinese-like” phonology in prior generations of Ganluo Ersu, matching Sun (Reference Sun1982, Reference Sun1983) and Liu's ([1983] Reference Liu, Li and Liu2007) earlier Ersu work.
2. The phonological history of the source variety, Mandarin Chinese, is well researched and understood. Southwestern Mandarin, the Chinese variety in contact with Ersu, is a subgroup of Mandarin Chinese dialects spoken by over 70% of China's Han population. Brought to Southwestern China in the Ming (1368–1644 CE) and Qing (1644–1911 CE) dynasties, it is the most homogeneous of all Mandarin groups. It is also closely related to the standard language of China (Standard Chinese or Putonghua), which is based on a northern Mandarin dialect. The distinctive phonological characteristics of Mandarin dialects include (Norman, Reference Norman1999:190–197; Yuan, Reference Yuan2001:24–39):
a. The Middle ChineseFootnote 2 voiced obstruents (stops, affricates, and fricatives) all became devoiced in Mandarin, hence eliminating voicing as a distinctive feature in the phonological system of these dialects.
b. Most Mandarin dialects have a three-way contrast in affricates at the dental (or alveolar), postalveolar (or retroflex), and palatal places of articulation (/ts, tʃ or tʂ, tɕ/) (e.g., Yuan, Reference Yuan2001:25, Table 2). However, some Southwestern Mandarin dialects, including Ganluo Mandarin, do not have a series of retroflex affricates and sibilants distinct from a plain dental (or alveolar) series (ibid., Sichuan sheng Ganluo xian difangzhi bianzuan weiyuanhui, 1996:591–595). We also note that Mandarin retroflexes (as in Standard Mandarin) are articulatorily quite distinct from Ersu retroflexes, being rather laminal or apical postalveolar sounds, [ʃ̺, ɹ̺, tʃ̺, tʃ̺ʰ] (Ladefoged & Maddieson, Reference Ladefoged and Maddieson1996:152–153; Lee & Zee, Reference Lee and Zee2003:110).
c. Mandarin dialects do not have a voiceless lateral fricative (/ɬ/).
d. Mandarin dialects do not have consonant clusters.
3. Regarding possible internal changes, our data yield no evidence that any of the four variables are sensitive to phonetic conditioning factors that could affect the probability of their occurrence. Put differently, the observed changes occur generally and are not dependent on the phonetic context. Notably, the examined changes do not merely produce novel allophones of existing phonemes, but rather they involve deletion of phonemes in the phonemic inventory of Ersu. Specifically, the changes result in merger of voiced and voiceless stops, and the elimination of retroflex sounds, /ɬ/, and consonant clusters. That is, they lead to a loss of phonemic oppositions, thereby changing the structural organization of the inventory of Ersu sounds. Moreover, these structural changes are all clearly moving in the same direction: toward a consonantal system that is more in line with Mandarin phonology. With these lines of evidence, and following Occam's razor, we conclude that Mandarin-induced phonological change is occurring in Ganluo Ersu.
Finally, we also note that comparable processes of Chinese-influenced phonological change have been reported in other small minority languages of western and southwestern China (e.g., Chirkova, Reference Chirkova2014; Gao, Reference Gao2017; Jamsu Reynolds, Reference Jamsu Reynolds2012; Li & Li, Reference Li and Li2015; Zhou, Reference Zhou2012).
METHODS
Our “triangular” collaboration
We have developed a “triangular” collaborative research approach involving three coauthors: (a) a documentary and descriptive linguist, (b) a variationist sociolinguist, and (c) a native Ersu linguist and ethnographer who is a member of the Ganluo Ersu community. With this triangular approach, we are able to thoroughly examine emic and etic perspectives on the language and culture along with quantitative analyses. Such a multifaceted team is especially valuable in lesser-studied languages such as Ganluo Ersu where prior literature is limited.
Data collection
Data reported in this study were collected in two field trips to Ganluo County in February and August of 2015, with speakers from all Ersu-speaking townships and villages.Footnote 3 The data were collected by Dehe Wang, a native speaker of Ersu and coauthor of the present study. Born and raised in Ganluo County (Zela Township), Wang is an Ersu linguist, ethnographer, and historian, who is actively engaged in the documentation and research of the Ersu language. The bulk of the data were collected by Wang in February 2015 during Chinese New Year celebrations. That time period was chosen because of the long-held tradition among the Ersu to return home and reunite with their family during Chinese New Year.
Participants were recruited through family and friends. They were informed of the general purpose of the research project—documentation of the Ersu language—but not given any information about the linguistic features chosen for this study, so as not to influence their recordings. Participants were recruited randomly based on their availability, except for the second field trip where male speakers were prioritized to help balance the dataset for sex.
All recording sessions consisted of two parts. In the first part, interviewees were asked to read in Ersu the list of 116 words written in Chinese characters (henceforth: word list). The word list includes 37 syllables with retroflex sounds as well as words with various other consonantal variation, and also “distractor” words that do not contain any known variation (see Appendix). In all words, consonants are in syllable-onset position. Literate speakers (the majority) read the list directly from the page. Illiterate speakers with limited knowledge of Chinese (a small group of elderly speakers, mostly women) were prompted by Wang. He read the list in Ersu, placing each word in a minimal context. For example: /ɽájí ɽámá, ɽá/ “[say] ‘chicken’ as in ‘chicken and hen’”; /vέ əzú ɽá əzú, əzú/ “[say] ‘raise’ as in ‘raise pigs and chicken’”; /ɡámέ dὲɖɽù, ɖɽú/ “[say] ‘dry’ as in ‘the clothes are dry’”. The interviewees were asked to pronounce each word in the list three times.
In the second part of the interview (henceforth: Q&A), participants were asked to provide personal information (name, age, place of birth and residence, education, occupation) and to respond to ethnographic questions. In order to facilitate the transcription of data by Mandarin-speaking research assistants, the Q&A interview was, whenever possible, in Mandarin. As a result, 48 interviews were conducted in Chinese, and 49 in Ersu. The ethnographic questions are listed here:
1. Which variety of Ersu do you consider as standard or prestigious? (Given that the notions of “prestige” and “standard” Ersu are generally unknown to Ersu speakers, these notions were translated as ‘pleasing to the ear’, 好听 in Mandarin, /bàní jàd̪z̪έ/ in Ersu.)
2. Is the Ersu variety of your home village different from that of the neighboring villages? Is the Ersu as spoken in the neighboring villages pleasing to the ear? Why?
3. Do you think Ersu is changing? Are there any differences in the Ersu as spoken by older, middle-aged, young people, and children? Are there any differences between the Ersu as spoken by men and women?
Interviews took between 12 and 20 minutes each. All interviews were recorded in uncompressed .wav format using a Fostex FR digital audio recorder and a Beyerdynamic M88 N microphone. All recordings are mono (16-bit at 48 kHz). The present discussion is based on auditory analysis. All sound files, text grids, transcriptions, and metadata related to this study are made available as part of the Endangered Languages Archive.Footnote 4
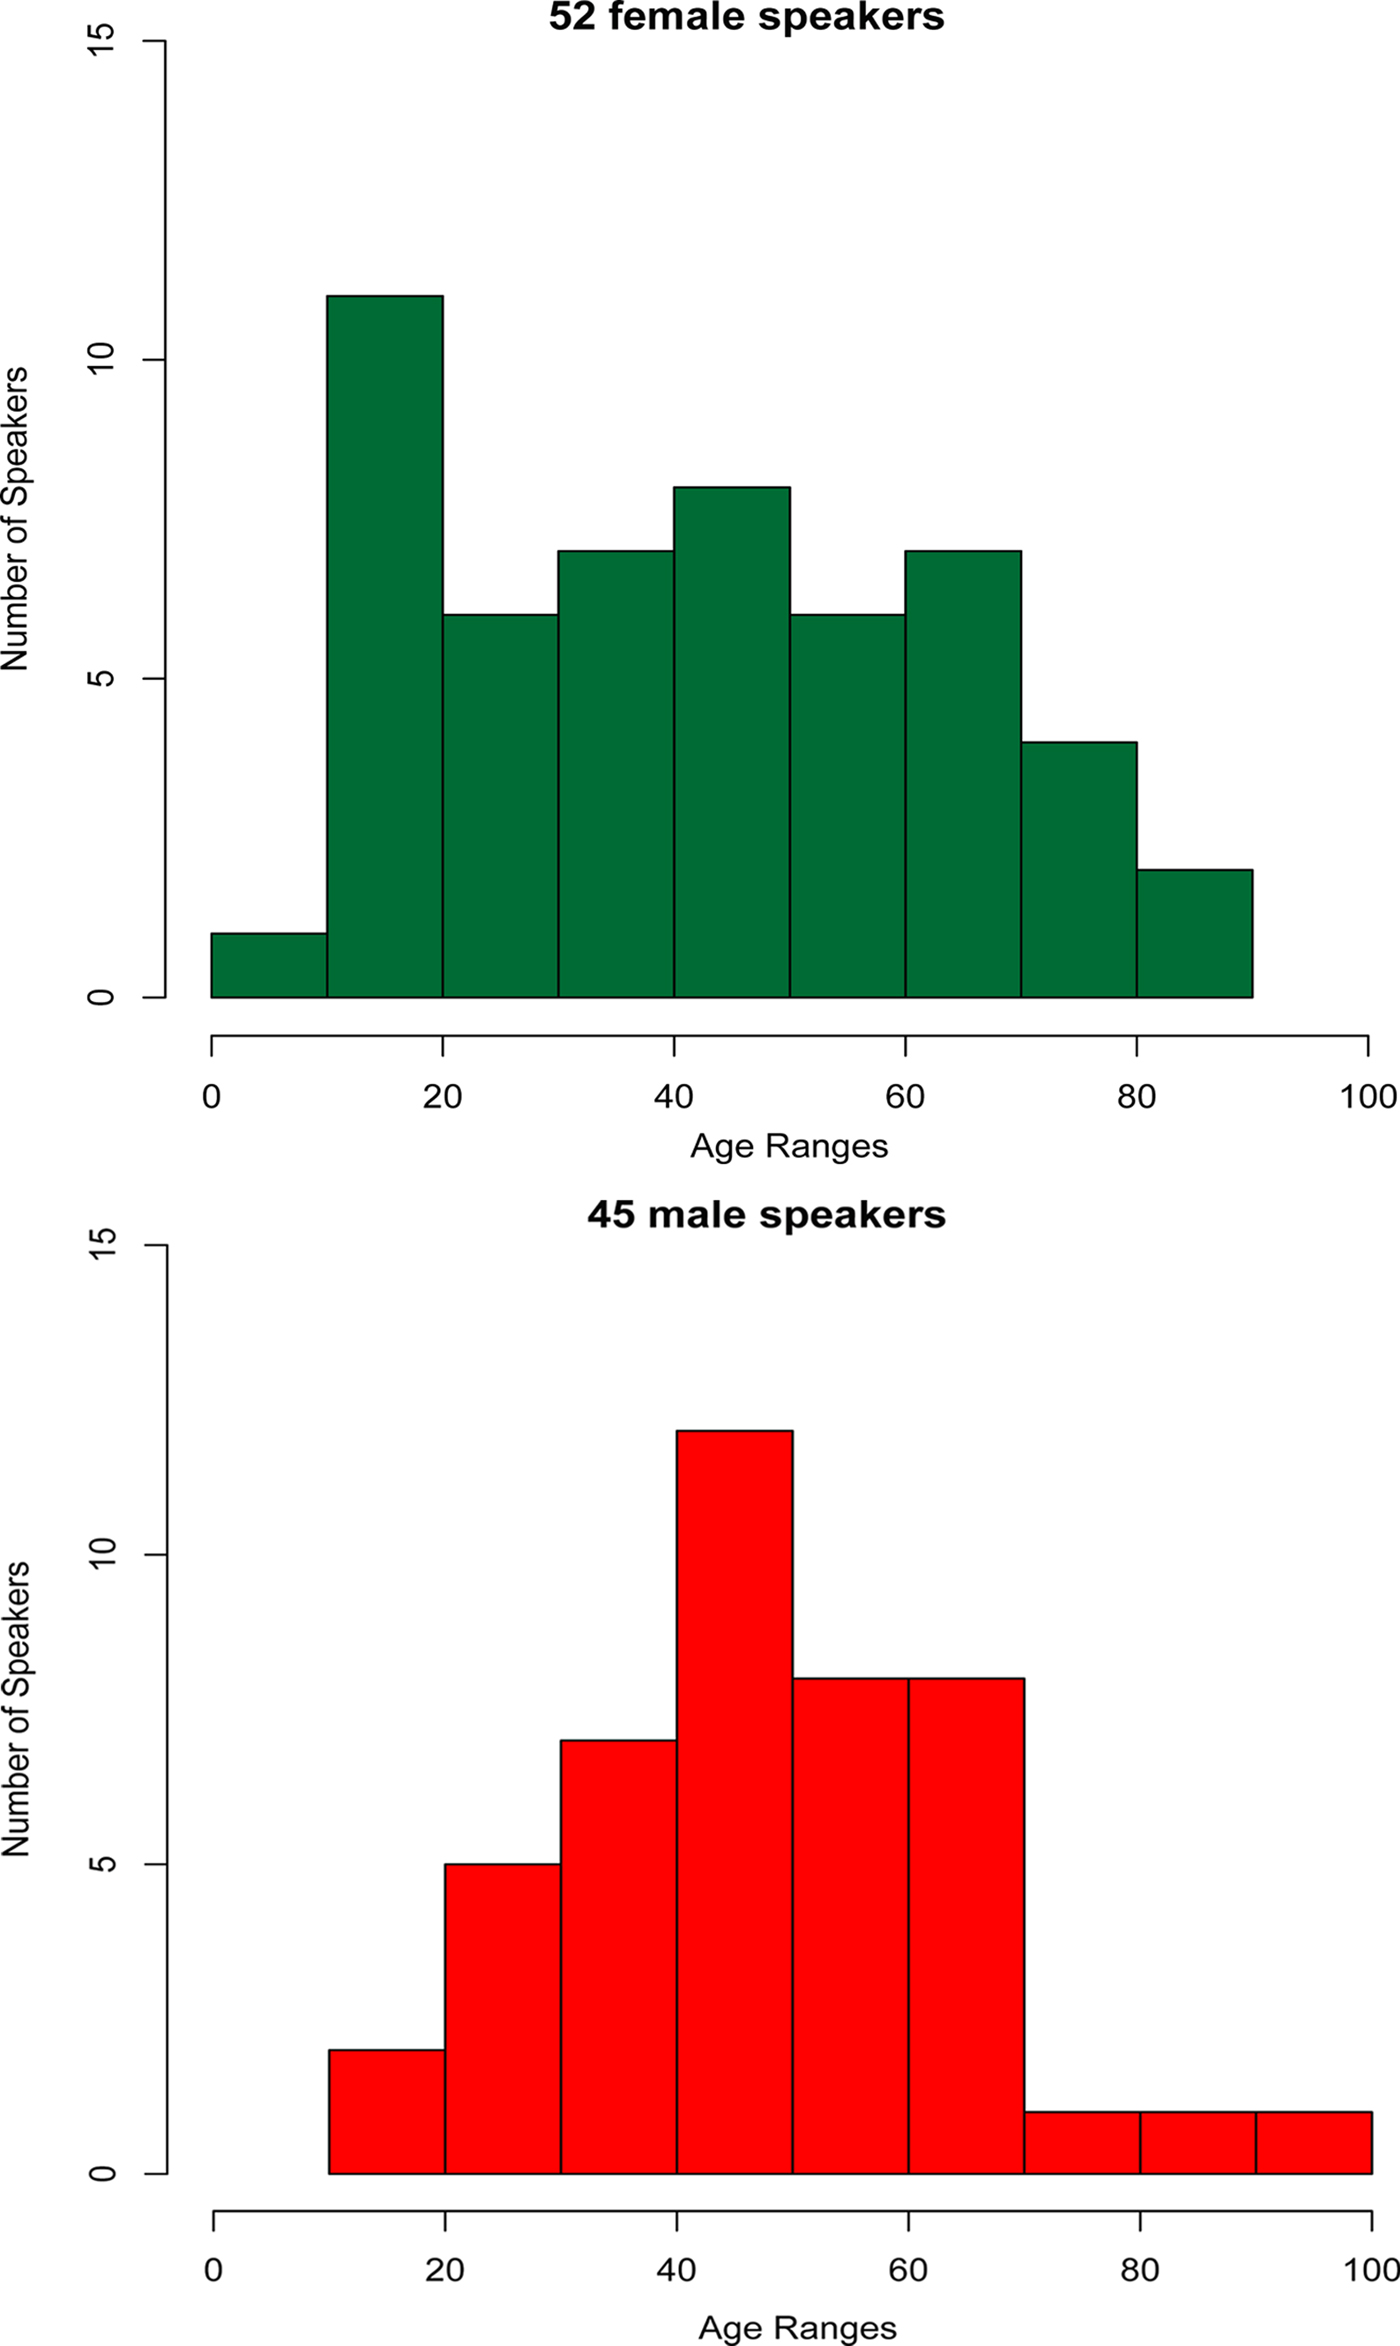
Figure 3 shows the age and sex distribution of the speakers in our study. Most speakers were born and raised in Ersu-speaking villages in Ganluo County. Four speakers were born outside Ganluo (three speakers, two female and one male, were born in Yuexi County; and one speaker, male, was born in Shimian County), but they spent most of their lives in Ganluo County.
Histograms of speaker age, organized by sex.

We must note some methodological limitations of our study. First, we recognize that the use of word list data lacks the naturalness of spontaneous speech. However, a word list makes it possible to collect comparable data from a large and diverse set of speakers in a short time. This was crucial for our project since we needed a large sample across the population that would represent diversity in sex, age, education, and occupation. With limited field resources in this project, we prioritized this approach rather than longer interviews or conversational recordings, which would require further resources for transcription.
An additional problem is that for illiterate speakers, the word list was read by the coauthor Dehe Wang, hence opening up the possibility that his speech may have influence on the production of the interviewee. To examine this possibility, we conducted analyses of available spontaneous Ersu speech samples, that is, all 49 available Q&A interviews in Ersu, which also include all interviews with illiterate speakers.Footnote 5 Specifically, we made auditory counts of the four variables in spontaneous speech and compared the resulting patterns for consistency in the use of the four variables by the same speaker in word list elicitation. Our preliminary analysis did not detect any discrepancy in the use of the four variables in these two contexts.Footnote 6
We acknowledge the constraints that the nature of the data places on the interpretation of the study's results. For a lesser-studied language community, sometimes it is necessary to start with a basic variationist description before moving on to other aspects of sociolinguistic research (Meyerhoff & Stanford, Reference Meyerhoff, Stanford, Smakman and Heinrich2015:10–11).
Data analysis: Social and linguistic factors
Social factors considered for our analysis include age, sex, education, and occupation. We recognize that these factors should be considered from an emic point of view, and our analysis strives for a culturally sensitive and locally relevant approach, rather than trying to artificially force the Ersu data into Western categories (cf. Eckert, Reference Eckert and Coulmas1997; Guy, Reference Guy and Newmeyer1988; Rickford, Reference Rickford1986). Johnstone wisely reminded researchers to consider the “local knowledge that motivates and explains the behavior of a particular group” (Reference Johnstone and Fought2004:76). At the same time, we are aiming for quantifiable results that can be compared cross-linguistically. We believe that our triangular research approach helps us to maintain the appropriate balance in this respect. First, for age, sex, and education, we use simple categories (e.g., male/female) and continuous scales for age and education. Though simplistic, we believe this approach is an appropriate, practical way to make progress in this study as the first quantitative exploration of Ersu. Future research can take further steps to problematize these categories, find more nuanced gendered speaking styles, or probe deeper emic experiences of age, and so on (see, e.g., Eckert, Reference Eckert2012; Eckert & McConnell-Ginet, Reference Eckert and McConnell-Ginet1992; Levon, Reference Levon2015, inter alia).
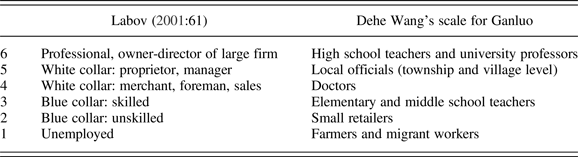
For occupation, our Ersu coauthor (Wang) developed an emic, locally appropriate scale that is reminiscent of occupational scales in prior variationist work but adjusted to match the Ersu experience. Traditionally, Ersu communities revolved around small-scale agricultural work in relatively egalitarian villages organized by kinship (Sichuan sheng Ganluo xian difangzhi bianzuan weiyuanhui, 1996:567). Naturally, during that earlier era, an occupational scale (Western or otherwise) would have been largely meaningless since almost everyone in a village was a subsistence farmer. However, our study examines Ersu during the current period of intense contact with Chinese.
We now describe each of the social factors in more detail.
Education
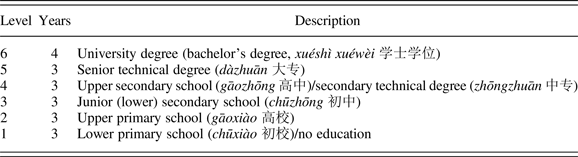
We use a 1 to 6 scale for education, following the scales in Labov (Reference Labov2001, cited in Ash, Reference Ash, Chambers and Schilling2013:355), but we adapt it for the Ganluo Ersu setting in China. Our scale is shown in Table 1.
The 1 to 6 educational scale

The speakers in our study range from illiterate (0 years of education) to a bachelor's degree (16 years). We include 2 more years on the scale (maximum 18 years) for future comparison since some locals have achieved a master's degree (shuòshì xuéwèi 硕士学位), though not among our study participants. This scale captures the overall gradient of community education based on the interviewees’ descriptions of their educational backgrounds and diplomas, although we note that there is some variability in the precise number of years constituting different diplomas at different points in the history of the People's Republic of China. Lastly, note that in Ganluo and many other minority communities in China, the local education system provides exposure to Mandarin, so our factor of education may be viewed as a proxy for Mandarin exposure to some extent.
Occupation
Speakers’ occupations were divided by coauthor Dehe Wang into six categories reflecting the local social and cultural context in which the Ersu speakers live. Dodsworth (Reference Dodsworth, Wodak, Johnstone and Kerswill2011:198) discussed the importance of “locally meaningful distinctions in socioeconomic (or other types of) status that vary by region and community.”
Sociolinguists have utilized a number of occupational scales for work in Western industrialized communities (Ash, Reference Ash, Chambers and Schilling2013), as well as identity-based approaches that avoid socioeconomic categories (for a review, see Dodsworth, Reference Dodsworth, Wodak, Johnstone and Kerswill2011). While quantified scales can uncover important broad-range perspectives, any quantified scale or set of categories runs the risk of “essentializing” and oversimplifying the results. For this reason, some scholars focus on the microlevel of individual style shifts and dynamic, interactive, intersectional constructions of identity (e.g., Eckert, Reference Eckert, Eckert and Rickford2001, Reference Eckert2012). Such approaches all provide valuable insights, especially when there is already a great deal of background information and prior sociolinguistic data available. But sometimes the prior sociolinguistic data is not available, as in the case of Ganluo Ersu, and so we need to start at a more basic level.
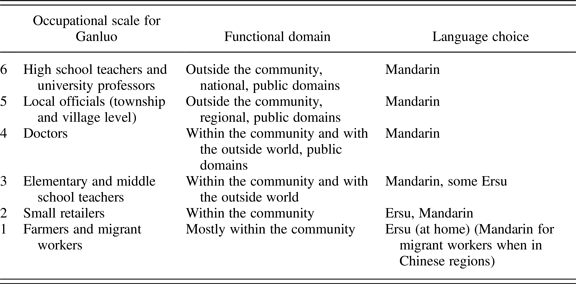
Table 2 compares Labov's (Reference Labov2001) and Dehe Wang's scales for Ganluo Ersu. Despite the differences in specific categories, we note that the notion of categories and stratification is shared in both locations. We also recall that scholars often point out the danger of “exoticizing” other societies to the point that they almost seem to have nothing in common with our own (Gilroy, Reference Gilroy1995:11–12; Groves, Reference Groves, Generett and Jeffries2003; Hopper, Reference Hopper2007:38). That is, Ganluo and New York City are far apart in many ways, but perhaps not in other ways.
Occupational scales

Combined index of education and occupation
Education and occupation are typically correlated to some extent, so we need to examine their relationship closely in Ersu. In the following analyses, we consider interactions and correlations in these factors. Labov (Reference Labov2001:185–186) created a combined index defined as education + occupation + house value (cited in Dodsworth, Reference Dodsworth, Wodak, Johnstone and Kerswill2011:193). He found that the combined index performs better in multiple regressions than the individual factors (education, occupation, house value), and so he based his primary analyses on the combined index. Since our study probes into the applicability of Labovian methods to a lesser-studied language, we take this combinatorial approach as well. Following Labov, we created a Combined Index as our primary measure of socioeconomic status (SES), and we defined it as education + occupation. Since both education and occupation are 1 to 6 scales, the Combined Index scale ranges from 2 to 12. As for the house value factor in Labov's index, this factor is not available in our dataset and may not translate reliably into a rural China environment.
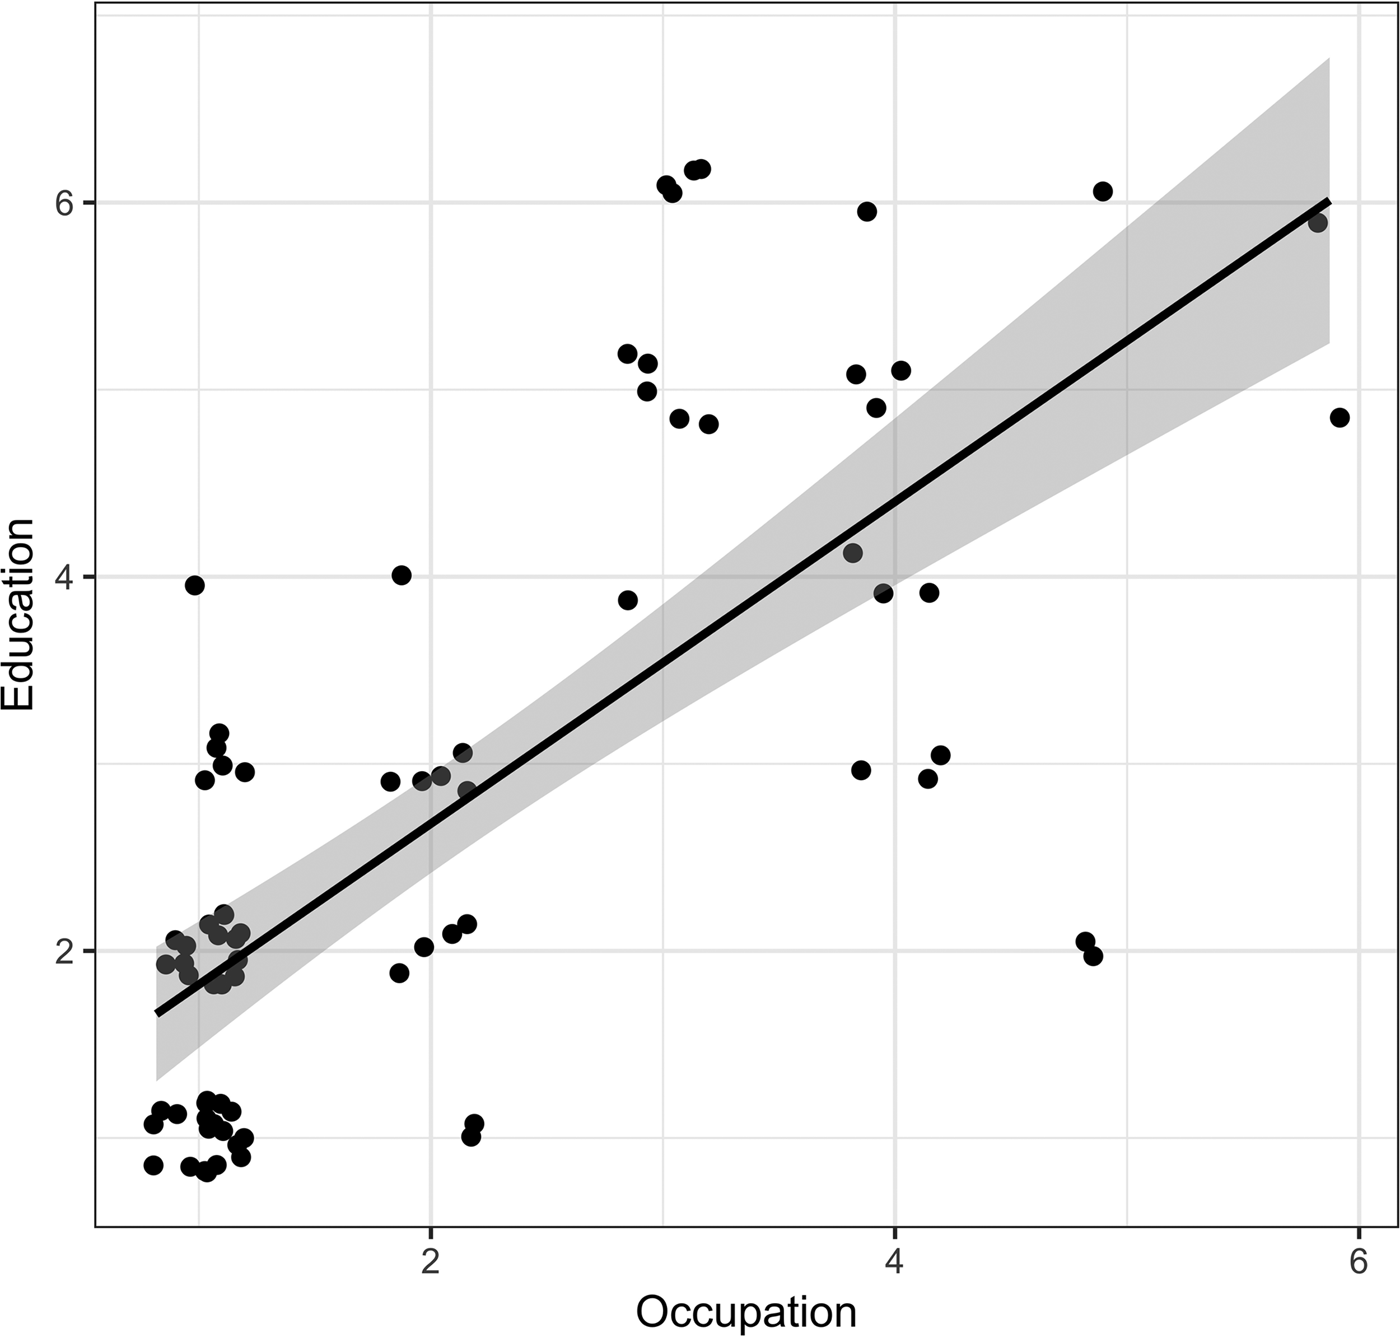
We find that this Combined Index is helpful in reflecting the significant socioeconomic changes affecting rural China. As Figure 4 shows, there is a strong correlation between education and occupation, as expected since education affects a person's occupational prospects almost anywhere in the world. However, there is still a good amount of variance, so our Combined Index helps to ensure that a given speaker's SES is not dependent solely on education or solely on occupation, as this could skew the results.
Correlation of education and occupation for adult speakers. R 2 = .502; p < .0001. Jitter added so that individual speakers are visible.

Functional domains of language use and language choice
In a multilingual speech community such as Ganluo Ersu, different languages have distinct functional and contextual allocations. As is typical for a society with a dominant majority language and a minority language, the minority language is mostly used within the community, inside the family, and in informal contexts. The majority language, by contrast, is used in communication with the outside world, outside family, and in public domains (King, Reference King and Dorian1989:140; Tsunoda, Reference Tsunoda2006:65–69). As is typical in language endangerment situations marked by competition of the minority and majority languages for functional domains of use (e.g., King, Reference King and Dorian1989), the minority language in the Ganluo Ersu community is restricted to a limited set of domains. The majority language, on the other hand, dominates the education system and work in public domains, and it is consciously or unconsciously associated for Ersu speakers with high social status and opportunities for socioeconomic advancement.Footnote 7
This functional differentiation between the minority and majority languages closely correlates with the occupation scale devised by Dehe Wang. Overall, the functional domains occupied by Ersu diminish as we move up the occupation scale in Table 3, while the functional domains occupied by Mandarin increase conversely. The languages in the language choice column are listed according to authors’ qualitative observations of the Ganluo Ersu community. In addition, Munai (Reference Munai2015) provided a detailed investigation of the various functional domains of use of Ersu, Nuosu, and Mandarin in Ganluo County.
Functional domains and language choice versus occupation

In contrast to Mandarin, which is the dominant contact language for the Ersu, the role of Nuosu is more sporadic and varies according to specific social circumstances. For example, an Ersu speaker may have a Nuosu coworker, spouse, friend, or neighbor (Munai, Reference Munai2015:58–59).
RESULTS
We first discuss the loss of retroflex segments separately from the other variables since the retroflex analysis involves our largest dataset and a number of complex socioeconomic issues.
Loss of retroflexes
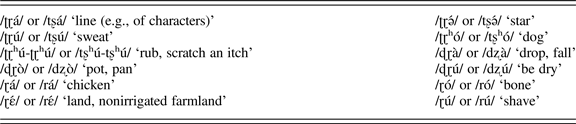
The first variable we analyze is the presence or absence of retroflex segments: trilled retroflex affricates /ʈɽ ʈɽʰ ɖɽ/ and the rhotic trill /ɽ/ (Table 4). These retroflex segments are typically produced with the underside of the tongue top approaching or having contact with the hard palate. They may or may not have a trill release (that is, /ʈɽ ʈɽʰ ɖɽ/ or /tʂ tʂʰ dʐ/; /ɽ/ or /r/) (see Chirkova et al., Reference Chirkova, Wang, Chen, Amelot and Antolík2015; Liu, [1983] Reference Liu, Li and Liu2007; Sun, Reference Sun1982, Reference Sun1983).
Examples of words with retroflexes in conservative Ganluo Ersu pronunciation

In our data, the release of the retroflex affricates may be realized variably as /ɽ/, /ʃ/ and /ɹ/. Using our word list data, we auditorily analyzed each word where a retroflex is present in conservative forms of Ersu, such as /ʈɽə́/ or /tʂə́/ ‘star’. In our word list data, there is an average of 128 such instances per speaker, for a total of 12,501 tokens (10,830 for the adult-only dataset).
Age and sex
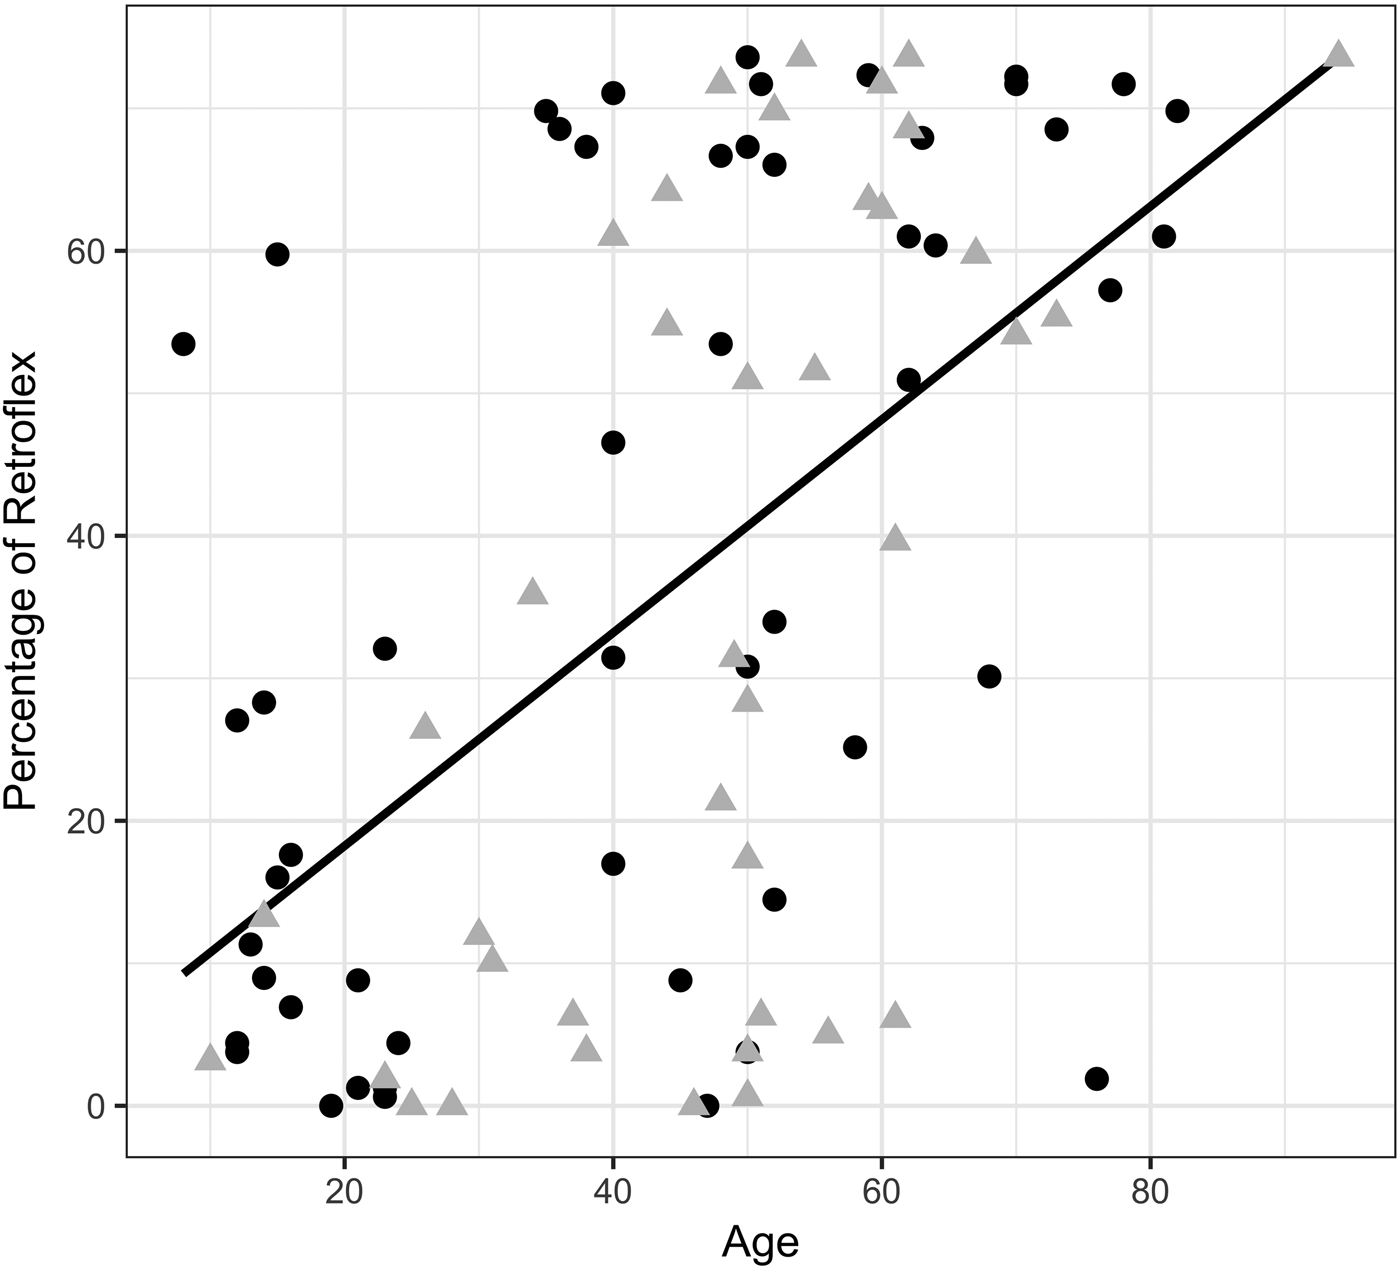
Figure 5 shows the percentage realized as retroflexes as a function of speaker age and sex. Female speakers are represented by black dots, and male speakers as gray triangles. In Figure 5, first note that there is a clear pattern of decreasing retroflexes in apparent time. Second, we note that the greatest variance is found in the middle-aged speakers (e.g., age 50), which is understandable as those speakers are in the middle generation between the two ends of the sound change: older speakers are more likely to have the conservative (retroflex) pronunciation, while younger speakers are more likely to have nonretroflex pronunciations, with some exceptions as seen in the plot.
Percentage of retroflexes in syllables that may contain a retroflex, as a function of speaker age. Female = black dots; male = gray triangles. Regression on percentage of retroflex versus age: .748% higher per year older; R 2 = .296; p < .0001. All speakers, including children.

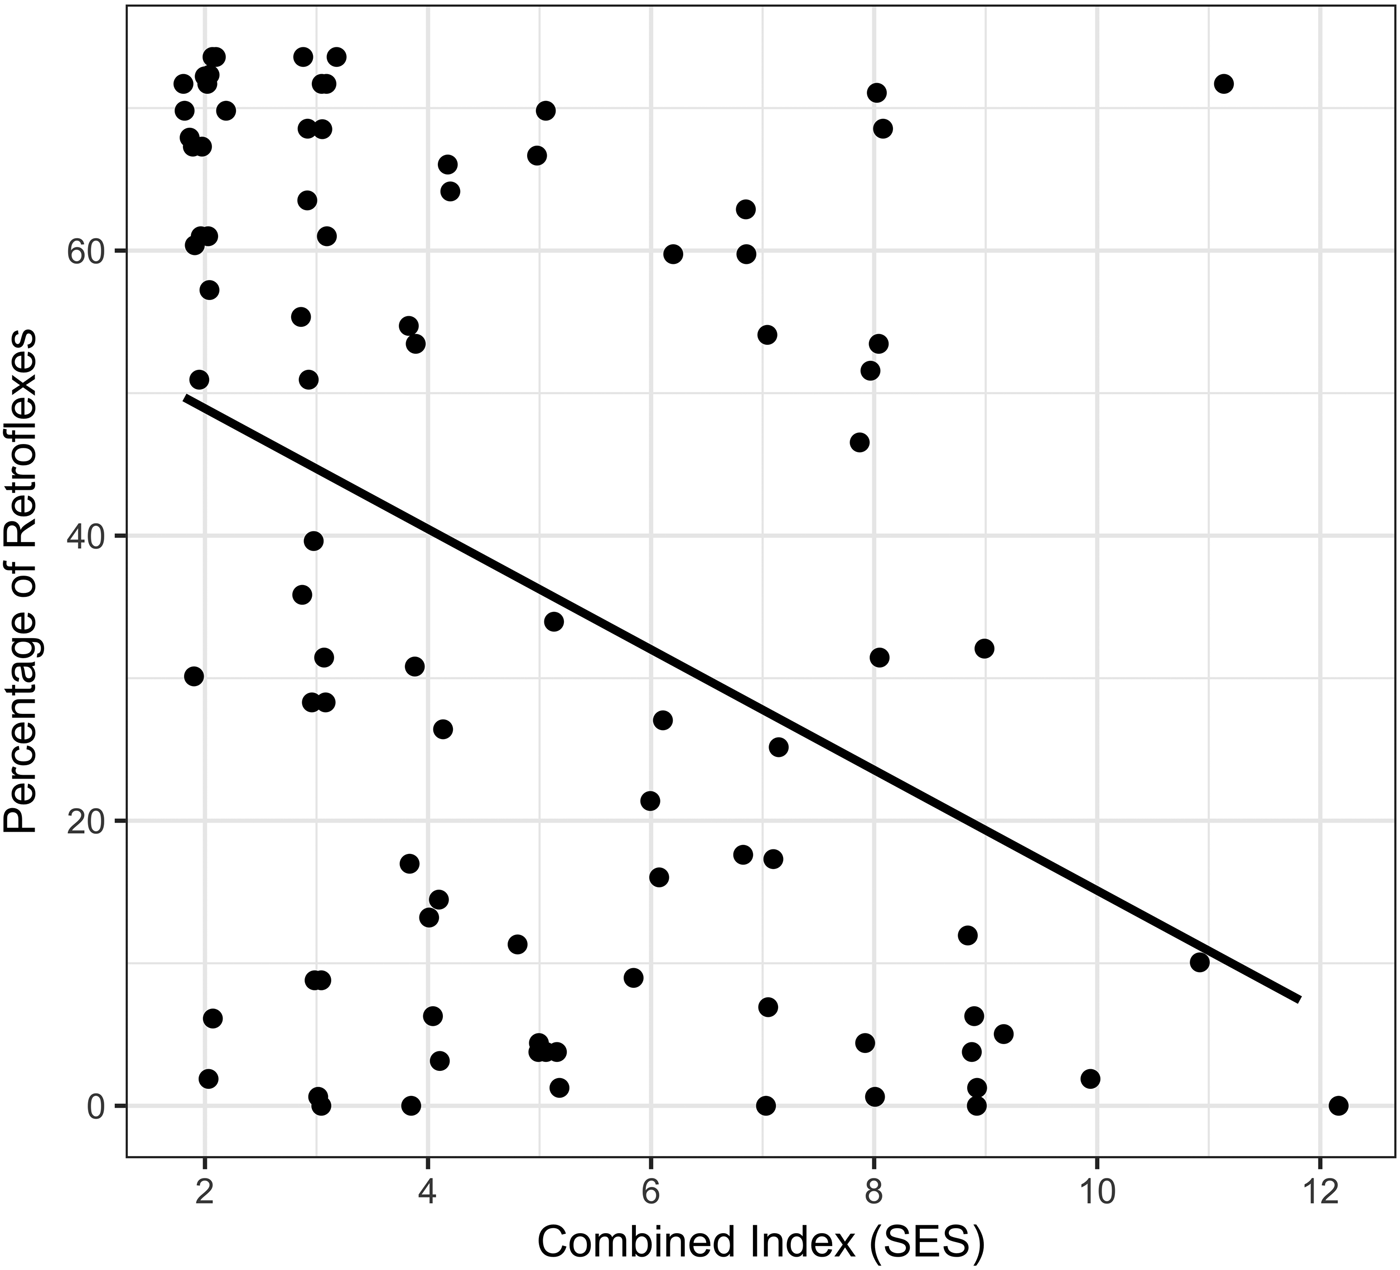
The role of SES can be seen in Figure 6, which is a plot of retroflexes as a function of SES (Combined Index). Notice the large group of people with in the upper-left corner. These people have SES levels around 2 to 3, that is, farmers and other low-education, low-status people. The speakers in this group have high percentages of retroflexes. (Note: Jitter has been added to the plot to help distinguish individuals.)
Percentage of retroflexes as a function of Combined Index (SES), p = .004, 6.5% lower percentage of retroflexes for each step higher on the occupation scale. R 2 = .104. Adult speakers. Jitter added.

Multivariable analysis of retroflexes
We now run a multivariable logistic regression in Rbrul (Johnson, Reference Johnson2009) to model the data as a function of age, sex, and SES, with speaker and following vowel as random effects. The following vowel is included to examine possible phonetic factors that could condition the realization of retroflexes. For the multivariable analysis, we ran logistic regression models in Rbrul and selected the best-fit model. There are 13 children in the dataset, and their educational and occupational factors need to be handled thoughtfully in the analyses. For statistical analyses involving occupation and education, we removed the children. For statistical analyses involving just age and sex, we included the children. Here is our reasoning for this bifurcated analysis: In the rapidly changing socioeconomic environment of contemporary rural China, it is not possible to estimate a child's social status from the parents’ education and occupation; many families are rapidly undergoing upward mobility across generations, and so parents’ occupation/education is not an accurate predictor of a child's socioeconomic identity or trajectory. Children are also frequently raised by different family members for certain periods of time when parents leave the home for migrant labor. Moreover, a given child's academic prospects, scores, and occupational trajectory are unknown, so it may be inappropriate to directly compare a child who is currently in sixth grade with a middle-aged farmer who left school in sixth grade many years ago, for example. Future studies could probe for more detailed information about children's personal socioeconomic/educational plans and identities and collect details about caregivers.
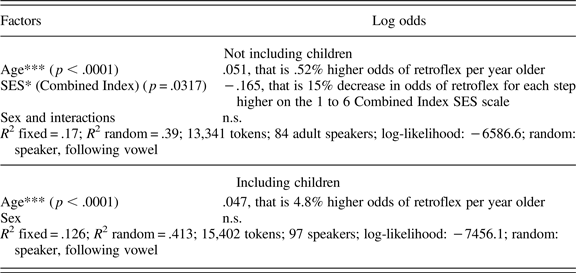
Table 5 shows our results for retroflexes. The best-fit model without children shows age and SES as significant. For each year older, there is a .52% increase in odds of producing a retroflex in words that contain retroflexes in conservative speech. As for SES, the model shows that for each step higher on the 2 to 12 Combined Index SES scale, there is a 15% decrease in odds of producing a retroflex. Sex is not significant, nor are any interactions. Note: Two young adults (ages 19 and 21) were current students in a vocational school (dàzhuān 大专), a career path that corresponds most closely to level 3 on our occupational scale.
Retroflexes by age, logistic regression results, best-fit model (Rbrul; Johnson, Reference Johnson2009)

*p < .05, ***p < .001.
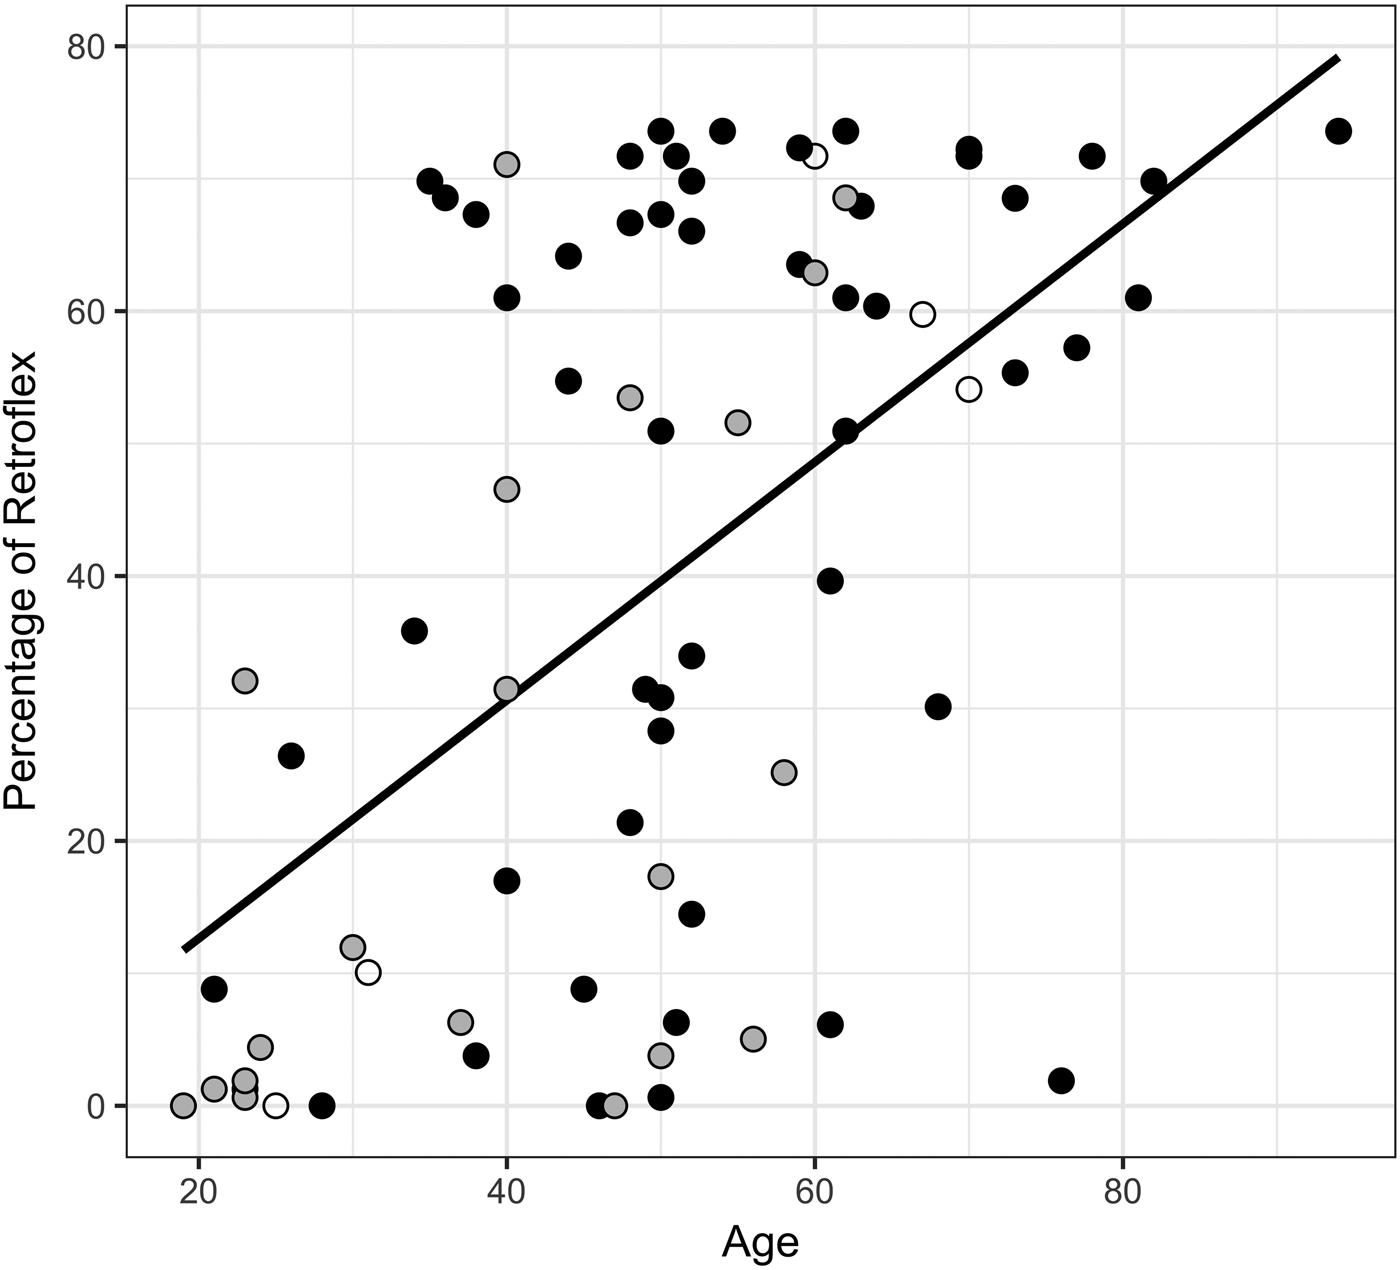
Finally, the best-fit model when children are included shows age as significant, with a 4.8% increase in odds of producing a retroflex for each year older. Figure 7 provides a view of age and percentage of retroflex in terms of SES levels. To help visualize the results, in this figure the Combined Index is divided into three categories: low (black dots), medium (gray dots), and high (white dots). As explained, it is necessary to exclude children in Figure 7 and other SES analyses. Comparing the lower left corner with the rest of the plot, we can see the general tendency for higher SES speakers to be younger speakers who produce few retroflexes (lower left corner).
Percentage of retroflex in terms of age and SES (Combined Index). Black dots = low SES level; gray dots = medium SES level; white dots = high SES level. Adult speakers only.

Sex interactions
Now that we have established a basic analysis for retroflexes, we would like to probe more deeply into sex as a factor. As we will discuss, there are more women than men on the lowest parts of our Combined Index SES scale, but this is changing rapidly in apparent time. We would like to see in what ways this social change may correlate with retroflex pronunciation. In the broad-based modeling, sex did not emerge as significant, but we have a number of empirical and sociocultural reasons to suspect that it could be playing a role. We therefore turn to a more fine-grained analysis.
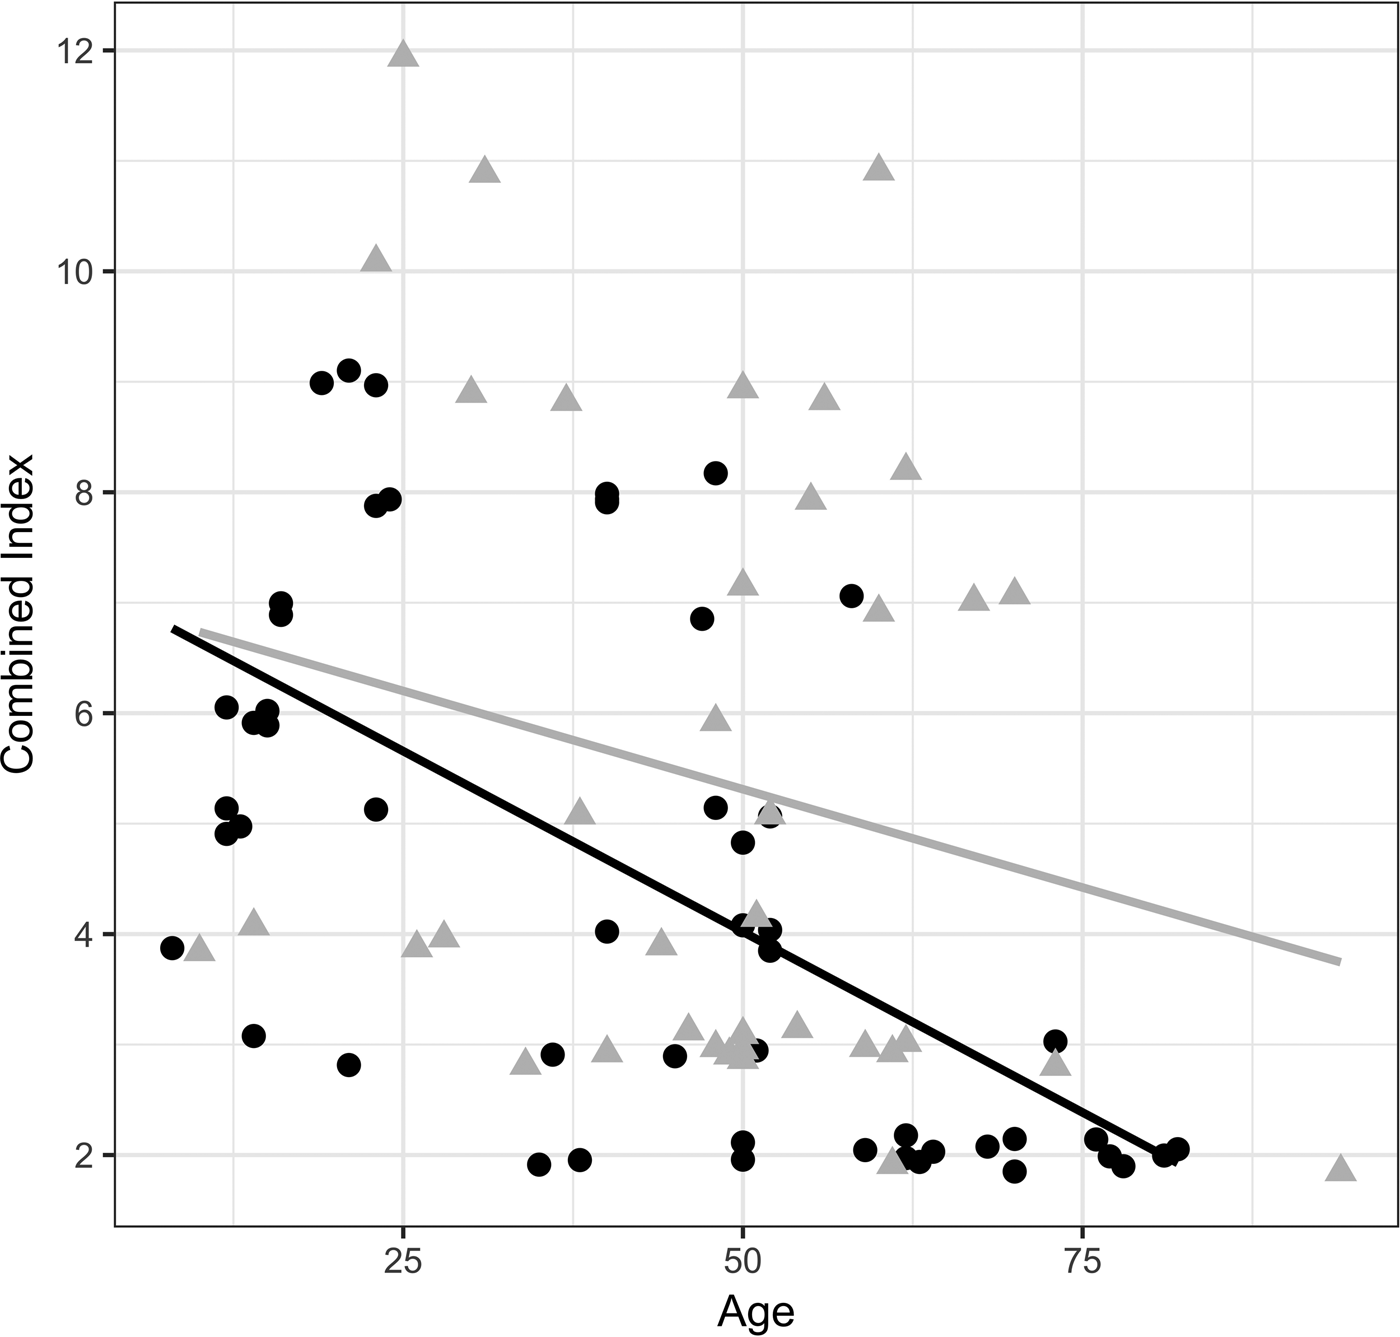
First, consider Figure 8, which plots SES in terms of age and sex. Notice the preponderance of women (black dots) in the lowest SES level, while there are more men in higher SES levels than women across most age categories. Next, observe the different slopes of the gendered trend lines. The contrast in slopes suggests that socioeconomic status is changing in apparent time more quickly for Ersu women than men. In fact, for the men, there is no significant change in SES across apparent time (p = .2099, R 2 = .04), whereas for the women there is a significant change (p < .0001, R 2 = .35). Most of the older women are found in the low SES levels, unlike the men. In particular, notice the large number of older women with low SES levels compared to the group of young women at higher levels 5 to 9. This sharp generational change reflects the fact that in the past women had far fewer educational opportunities and chances for occupational advancement. In recent decades, China's socioeconomic changes have affected the whole population. Yet it is the women who have experienced the most profound changes in lifestyle—because they were farther behind—hence the sharply increasing slope for women in Figure 8. These patterns are sociologically interesting in the context of the rapidly changing economy of China. Naturally, they are also interesting for sociolinguistics, as language reflects and constructs society (Bucholtz, Reference Bucholtz1999:209; Coupland, Reference Coupland, Eckert and Rickford2001:198–199).
Age versus SES (Combined Index). Black dots = women; gray triangles = men. For women: −.064 SES steps per year older; R 2 = .35; p < .0001. For men: −.035 SES steps per year older; R 2 = .04; n.s. (p = .2099). Jitter added.

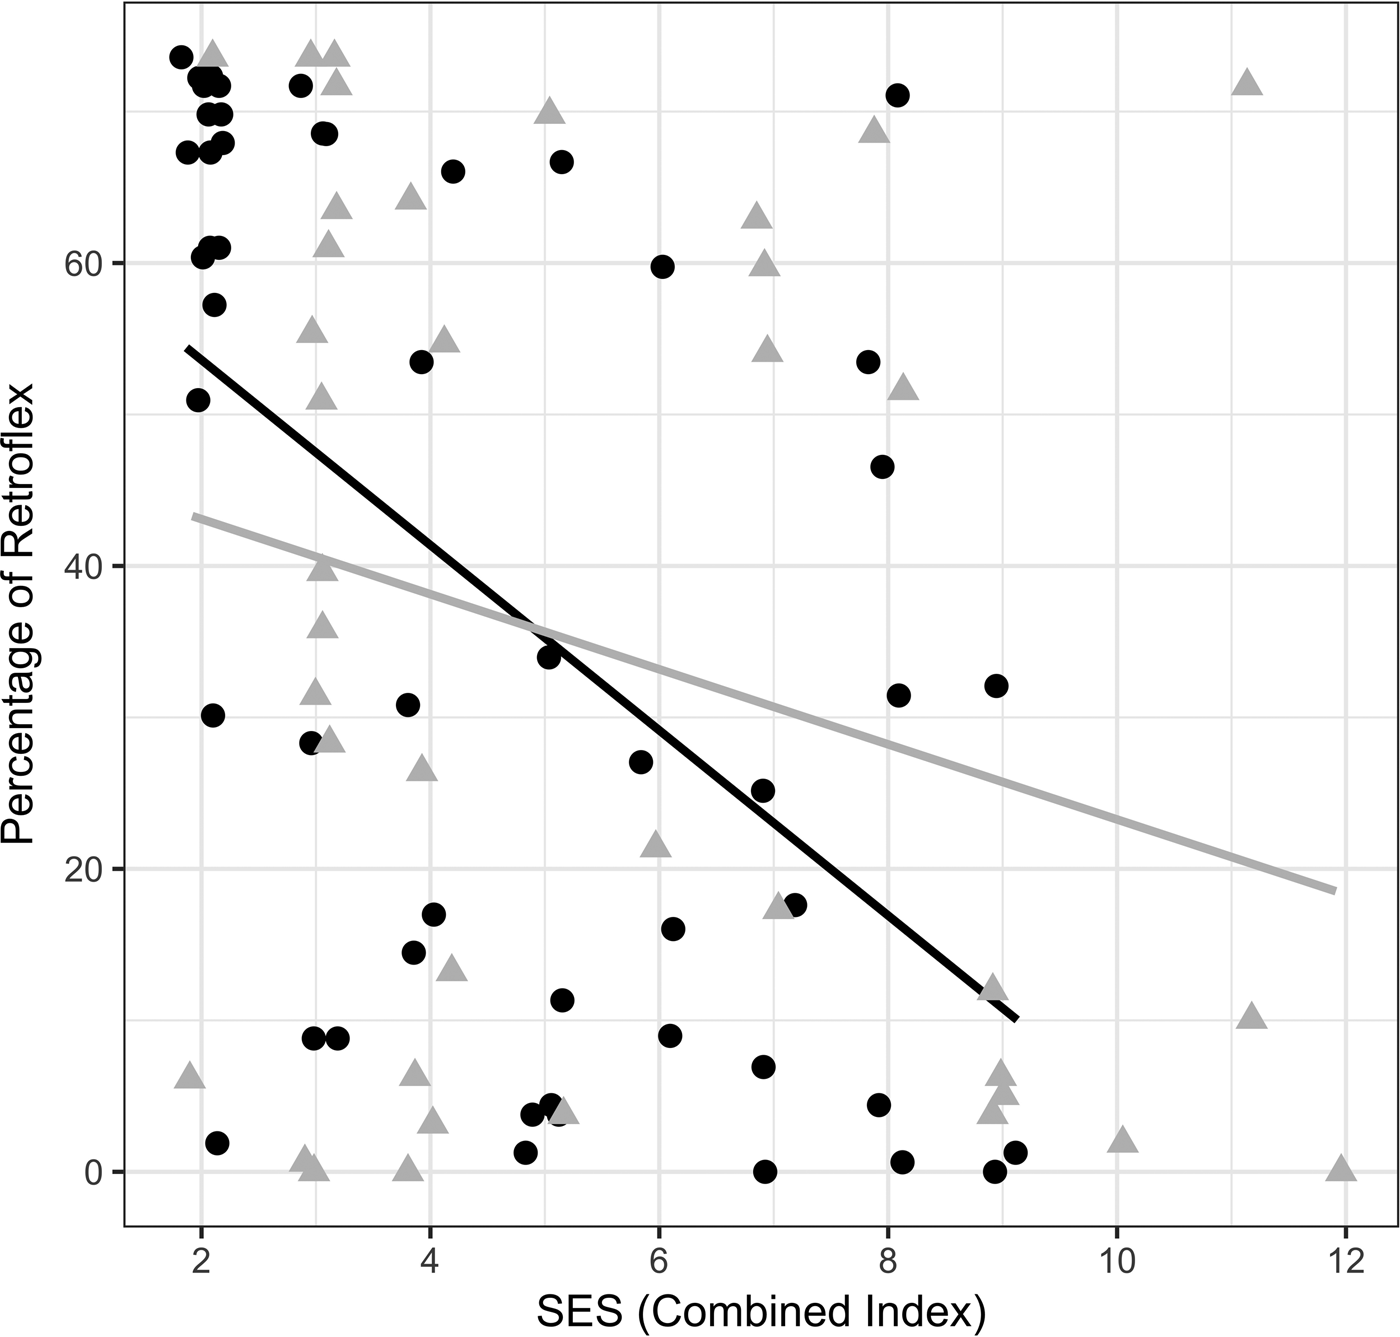
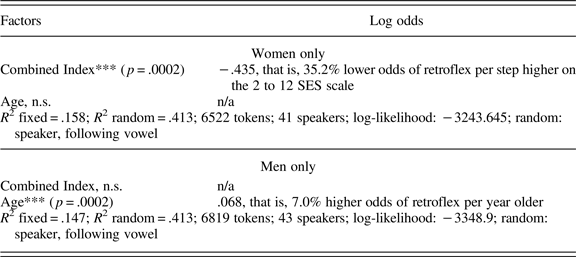
Such gendered contrasts across age and SES emerge in our analysis of retroflexes. When we examine retroflexes as a function of SES, there is a clear contrast in sex. In the upper-left corner of Figure 9, notice the large group of low-SES women (black dots) who have high retroflex percentages. For the linear regressions (trend lines) of Figure 9, SES is a significant factor for women's use of retroflexes (R 2 = .288, p < .0001) but not for men (R 2 = .061, p = .129). That is, women's percentage of retroflexes decreases dramatically as SES increases, whereas men are more stable for this factor. Gendered Rbrul logistic regressions on presence/absence of retroflexes support this analysis. As Table 6 shows, women's percentage of retroflexes is best predicted by SES and not by age, while men's percentage of retroflexes is best predicted by age and not by SES.
Percentage of retroflex as a function of SES for the 84 adult speakers. Black dots = women; R 2 = .288; p < .0001. Gray triangles = men; R 2 = .061; n.s. (p = .129). Jitter added.

Retroflexes by sex, logistic regression results (best-fit model), not including children

***p < .001.
We conclude that Ganluo Ersu speakers’ use of retroflexes is dramatically declining in apparent time, and we find that our Combined Index (an SES index combining occupation and education) and sex are significant factors as well. This change in the direction of Southwestern Mandarin can be characterized as contact-induced socially constrained variation. Speakers with higher SES tend to produce fewer retroflexes, but this effect is gendered: Regression analyses of women-only and men-only datasets suggest that women's retroflexes are best modeled by the Combined Index, while men's retroflexes are best modeled by age. Why? Sociologically, our demographic analyses in this section have shown that SES is increasing in apparent time more rapidly for Ganluo women than men. As China's reform era blossomed in the late 1970s and early 1980s, women started out on lower rungs of the socioeconomic scale than men did, and so women have had a much steeper climb. With this social context, it is not surprising that SES is a stronger predictor for women than for men. The results are consistent with Labov's principle that women favor incoming prestige forms (Reference Labov1990:213–214, Reference Labov2001:261–293), and those gendered linguistic effects are especially salient here due to the acute change-in-progress in women's social status. In the Discussion, we will also consider these results in terms of gendered responses to covert/overt prestige, as well as other related prior work.
Other variables
In this section we consider (a) delateralization of the voiceless lateral fricative, (b) devoicing of stops/affricates, and (c) consonant onset simplification, all of which are typical for the speech of younger speakers.
Delateralization of the voiceless lateral fricative
We observe that the voiceless lateral fricative is delateralized and pronounced as [x] by many speakers. For example: [ɬá] ~ [xá] ‘month’. We will examine delateralization with the same social factors.
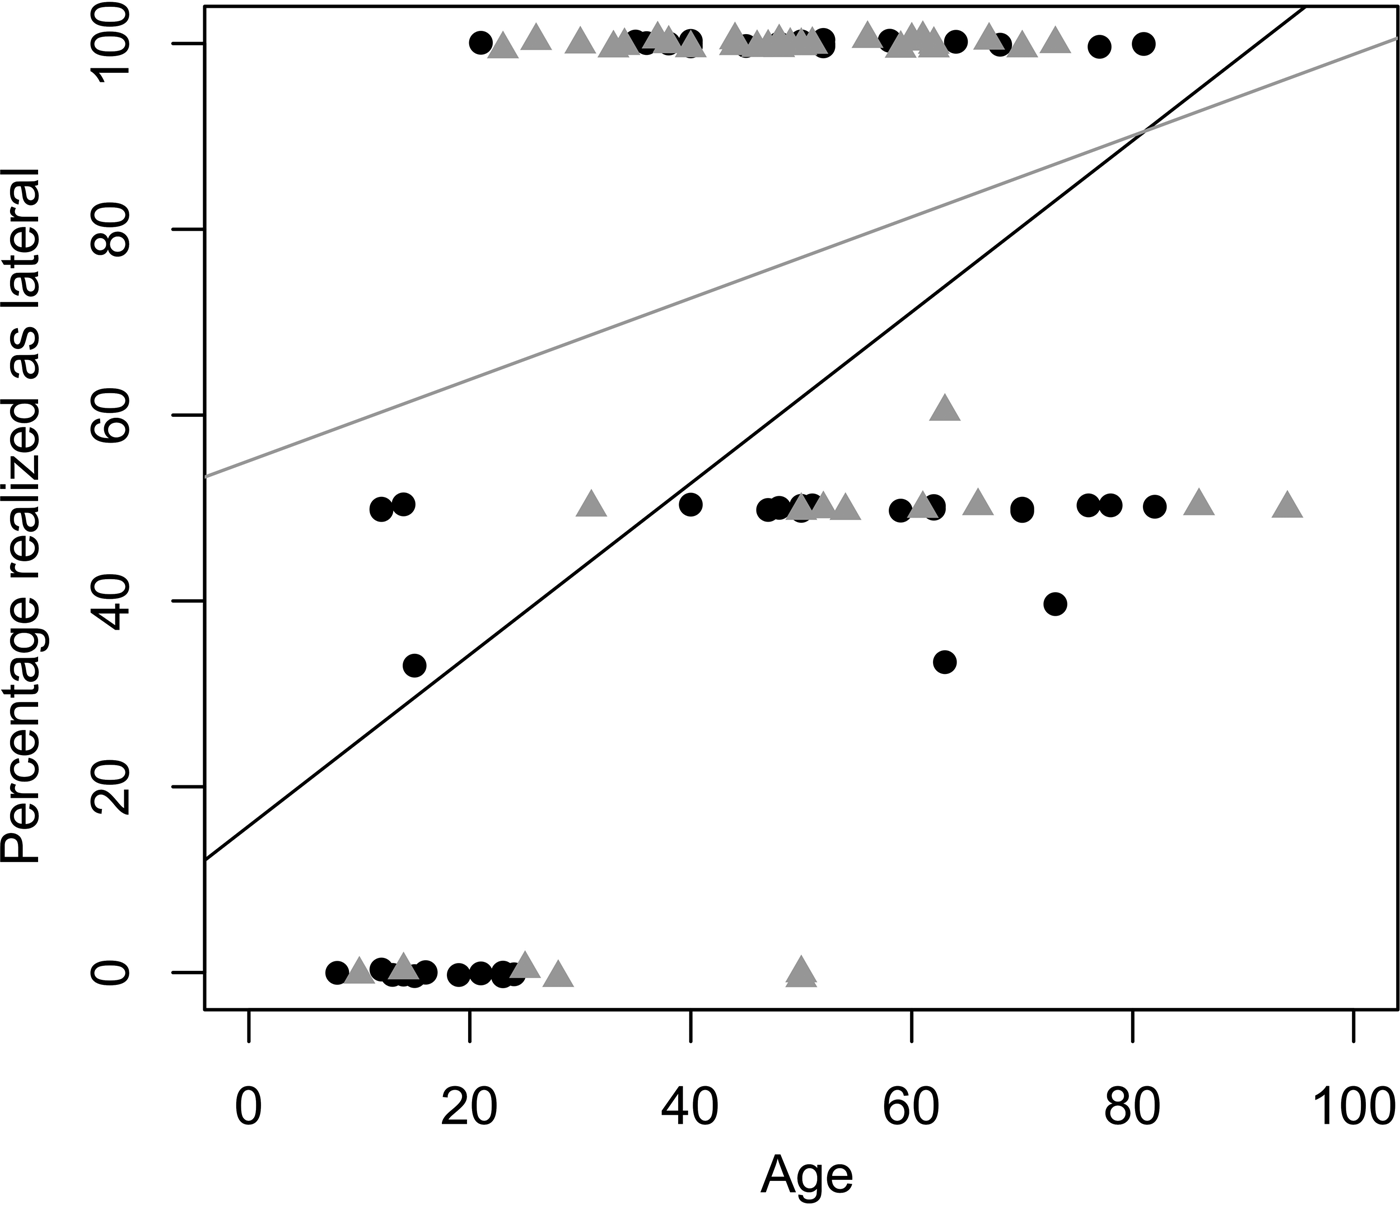
Age. In Figure 10, we plot the percentage of Ganluo Ersu laterals as a function of age, dividing in terms of female speakers (dark dots) and male speakers (gray triangles). Graphically, we observe an overall trend toward lower percentages of lateral realizations for younger speakers.Footnote 8
Percentage of laterals versus age. Black dots = female speakers; .922% per year; R 2 = .268; p < .0001; 52 female speakers. Gray triangles = male speakers; R 2 = .043; n.s. (p = .175); 44 male speakers. Jitter added.

Multivariable analysis of delateralization:The dataset for lateral fricatives is more modest than the retroflex dataset (387 tokens from 96 speakers) since only six words contain a segment that may be realized as a lateral fricative.
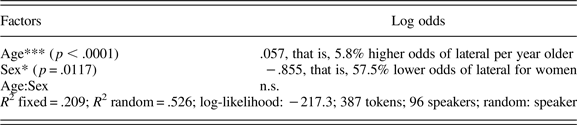
The logistic regression testing age, sex, and SES (Combined Index) finds sex alone is significant: Female speakers have log-odds −.753 or 52.9% lower odds of producing a lateral. But it is not a strong model, as R 2 is only .056. We obtain more meaningful results by including the children. As explained in the retroflex discussion, when we include children in the model, we only test for age and sex (not educational or occupational factors). For the dataset including children, the multiple regression best-fit model shows both age and sex are significant (Table 7). Consistent with Figure 10, Table 7 shows that speakers’ production of the lateral voiceless fricative is modeled as 5.8% higher odds for each year older and 57.5% lower odds for women.
Lateral fricatives: Logistic regression results (best-fit model), including children

*p < .05, ***p < .001.
Conclusion for delateralization of the lateral voiceless fricative: We conclude that delateralization of fricatives is increasing in apparent time, and this change is led by younger women. Unlike retroflexes, we do not find a socioeconomic effect for this variable, but we also note that the tokens available for modeling are more limited than the retroflex data in the “Multivariable analysis of retroflexes” section.
Devoicing of stops and affricates
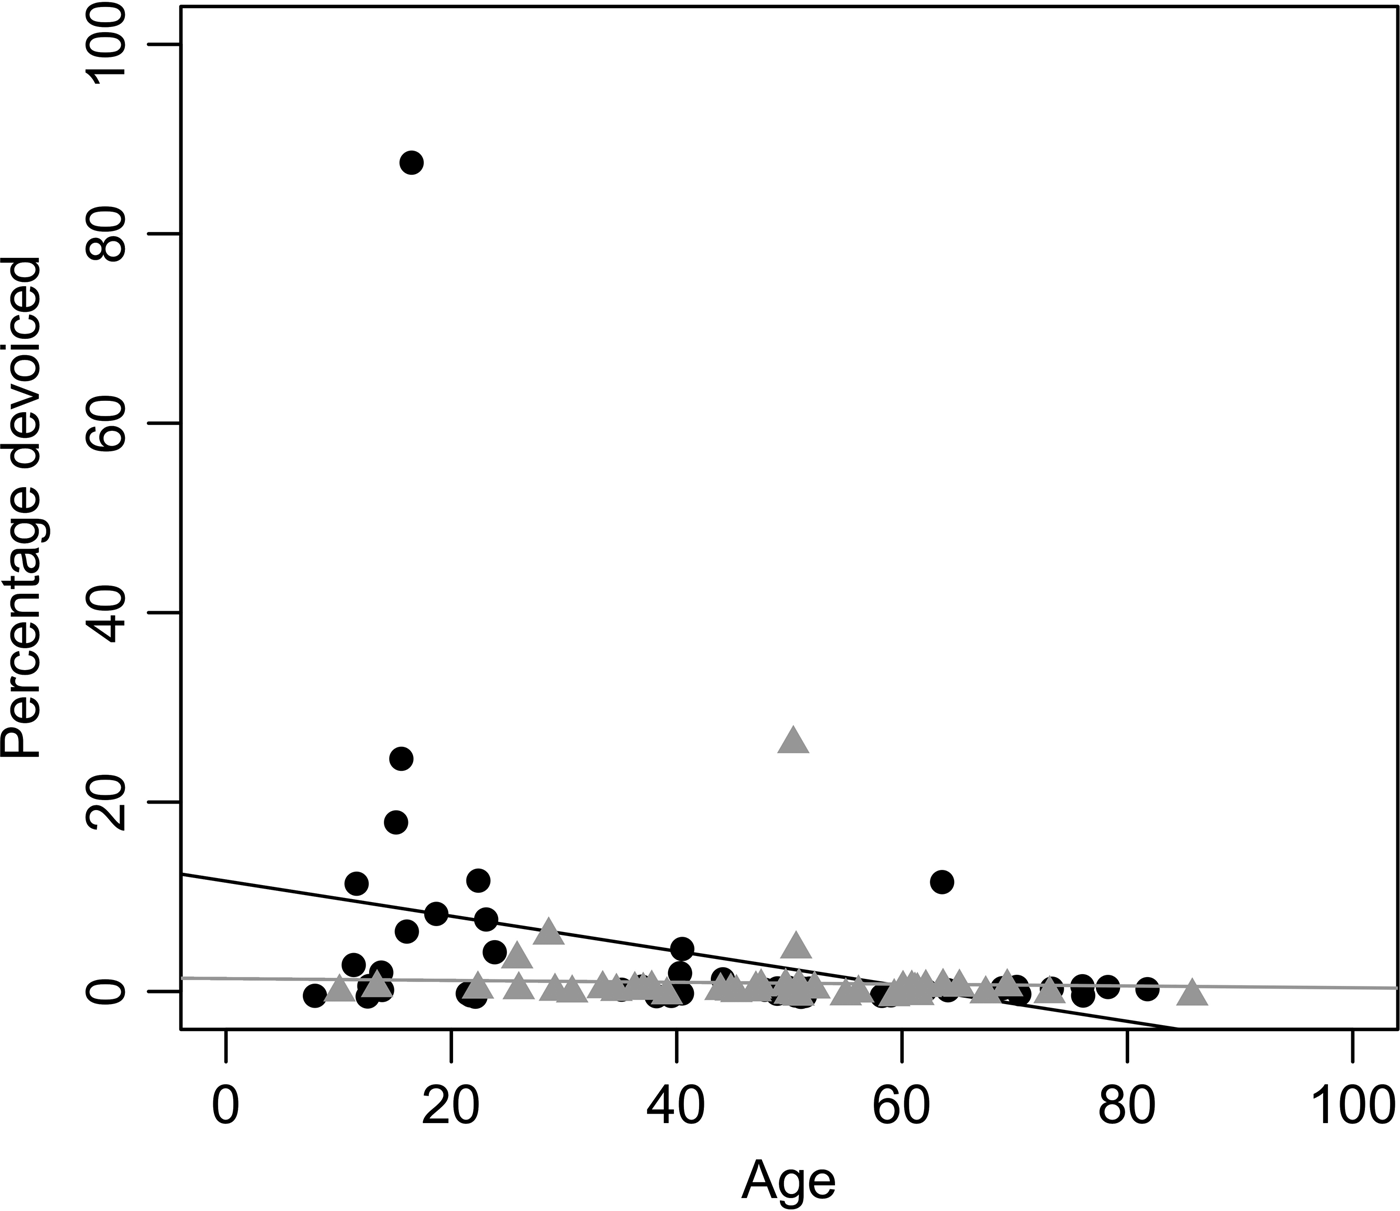
We observe that younger speakers are more likely to devoice stops and affricates, in accord with Mandarin phonology, which lacks voiced stops and affricates. Examples are given in (1). Figure 11 is a plot of the percentage of devoiced stops/affricates versus age.
(1) [d̪z̪à] ~ [t̪s̪à] ‘paddy’
[bέ] ~ [pέ] ‘insect’
[dʑó] ~ [tɕó] ‘push’
[vá] ~ [fá] ‘net’
Percentage of devoiced stops/affricates as a function of speaker age. Black dots = female speakers; −.186% per year; R 2 = .097; p = .026; n = 51. Gray triangles = male speakers; R 2 = .001, n.s. (p = .807); n = 43. Jitter added.

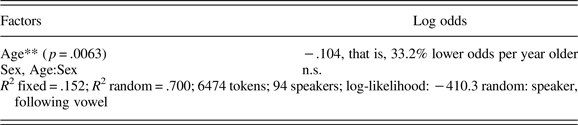
We use a logistic regression on individual tokens of stops and affricates to model the factors that contribute to devoicing. As before, we run the regression without children so that SES can be included in the model. In the best-fit model, no factors are significant predictors of devoicing (age, sex, SES, and their interactions). Next we run a regression with the children included using age and sex as factors. As Table 8 shows, the results are significant for age: the odds of devoicing stops and affricates increase 33.2% per year older. Note: The model tests 94 speakers rather than 98 speakers because 4 speakers did not have enough usable data for this variable.
Devoicing of stops/affricates, including children: Logistic regression results (best-fit model)

**p < .01.
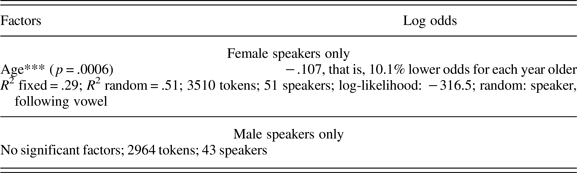
Finally, because we observed a possible sex contrast in Figure 11, we ran logistic regressions on female speakers alone and male speakers alone (Table 9). Among female speakers, younger speakers are significantly more likely to use devoiced stops and affricates. For male speakers, we find no significant factors.
Devoicing of stops/affricates: Gendered logistic regression results (best-fit model), including children

***p < .001.
Conclusion for devoicing of stops and affricates:Much like the delateralization variable, the devoicing of stops and affricates is being led by younger women, and SES is not significant.
Consonant onset of simplification
Finally, we examine the simplification of onsets. Our word list has 22 words that contain complex onsets in conservative Ganluo Ersu, including prenasalized clusters, clusters with a schwa-like segment, and clusters with approximants. Examples are given in (2). The simplified forms are closer to Mandarin phonology, which does not have these complex onsets.
(2) [mbò] ~ [bò] ‘horse’
[mpʰó] ~ [pʰó] ‘steal’
[ʃə́t̪s̪wá] ~ [ʃə́t̪s̪á] ‘be new’
[ə̥t̪ó] ~ [t̪ó] ‘jump’
[əmέ] ~ [mέ] ‘soldier’
[kwá] ~ [ká] ‘take off’
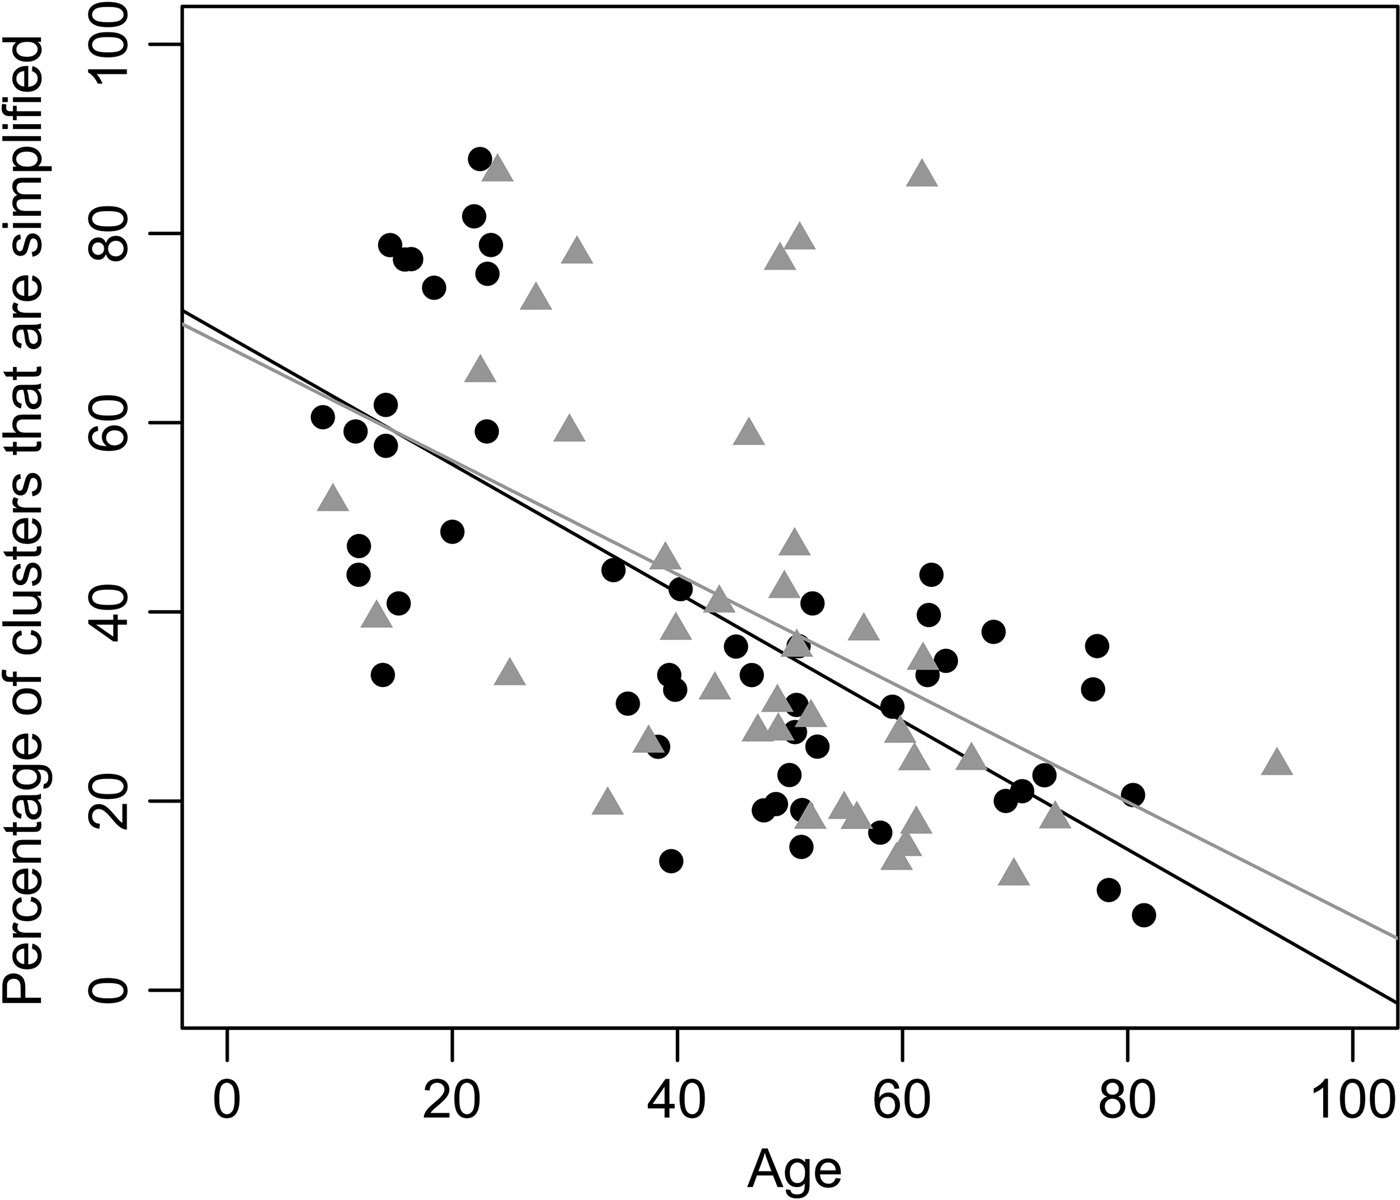
For each speaker, we calculate the percentage of simplified onsets by taking the number of simplified onsets divided by the number of total words that contain complex onsets in conservative Ganluo Ersu (Chirkova et al., Reference Chirkova, Wang, Chen, Amelot and Antolík2015). Figure 12 plots this percentage versus speaker age, showing a steady increase of cluster simplification for younger speakers of both sexes. Tables 10 and 11 provide the results of multiple regression with and without children. We find that age is significant but no other factors are significant.
Percentage of simplified onsets as a function of speaker age, including children. Black dots = female speakers; −.68% per year; R 2 = .514; p < .0001; n = 52. Gray triangles = male speakers; −.60% per year; R 2 = .215; p = .0029; n = 39. Jitter added.

Onset simplification, not including children: Multiple regression results (best-fit model)

***p < .001.
Onset simplification, including children: Multiple regression results (best-fit model)

***p < .001.
In summary, we find that younger speakers are more likely to simplify consonant onsets, reducing them in the direction of Mandarin phonology. We do not find socioeconomic or sex effects in this variable.
Overall summary
Comparing the different types of variables (loss of retroflexes, delateralization of fricatives, devoicing of stops/affricates, onset simplification), we can summarize the results as follows. First, younger speakers are leading the changes in every case. Moreover, for delateralization of fricatives and devoicing of stops/affricates, younger women are the leaders. This is consistent with the Labovian principle that women lead changes from above (Labov, Reference Labov2001:261–293). We also find that higher education and higher levels on Dehe Wang's occupational scale emerge as significant factors in the loss of retroflexes; specifically, the use of retroflexes decreases with each step higher on our Combined Index SES scale. In our retroflex analysis, there are interactions among sex, SES, and age. Women's use of retroflexes is best predicted by SES (speakers with lower SES use more retroflexes), while men's retroflexes are best predicted by age (older speakers use more retroflexes). Sociologically, our results suggest that Ganluo Ersu women have undergone a more dramatic change in SES than men have during China's changes in recent decades. We suggest that this gendered difference in socioeconomic change underlies the gendered contrast. Across ages, higher SES women are more likely to avoid retroflexes than lower SES women are. Similar to Labov (Reference Labov2001:261–293), Trudgill (Reference Trudgill1972, Reference Trudgill1974) and other classic works, Ganluo Ersu women are leading a change from above. Moreover, in Ganluo, social status is an especially salient factor for women since they have experienced the greatest change in this regard. These core findings are further interpreted next.
DISCUSSION
In this study we documented and analyzed patterns of consonant variation among 97 speakers of Ganluo Ersu. Focusing on four distinct variables (loss of retroflexes, delateralization of the lateral voiceless fricative, devoicing of stops/affricates, and simplification of consonant onsets), we found evidence of change in progress in all cases. In each case, younger speakers are shifting their pronunciation away from the more conservative Ganluo Ersu of their elders. For each variable, we noted that the sound changes are in the direction of Southwestern Mandarin. Integrating these observations with evidence from earlier work on Ersu and Southwestern Mandarin, we interpreted these Ganluo Ersu changes to be a case of Mandarin-induced phonological convergence. Moreover, we found that these changes are occurring in a socially stratified way.
Overall, the results reflect the transition from an earlier setting of multilingualism with relatively equal prestige among languages (Ersu-Nuosu-Mandarin) to one with an unequal relationship between the indigenous minority language (Ersu) and the dominant, majority language (Mandarin). In the modern era, rural minorities all over China associate Mandarin with economic gain, power, prestige, and upward mobility (Tsung, Reference Tsung2012; Van den Berg & Xu, Reference Van den Berg and Xu2010; Xu, Reference Xu, Van den Berg and Xu2010; Zhou, Reference Zhou2012). Language choice, interrelated in complex ways with occupation and education, plays an important part in the process of change in Ersu. In particular, our field observations and ethnographic interviews suggest that greater exposure and assimilation to Mandarin Chinese is manifested through higher education and higher status occupations. As with other cases of language shift, we find that Mandarin is progressing through domains of use (recall Table 3).
These dramatic changes naturally do not go unnoticed by the Ersu community. In our interviews, the vast majority of speakers find that Ersu has low prestige and is under growing pressure from the neighboring languages. They also note a decrease in the range of contexts in which Ersu is used and express concern about the future of the language. Examples (3) to (5) have been translated into English:
(3) Older people speak best. . . . The generation of grandchildren does not speak too well. They study, so they don't speak Ersu very well. They only speak Ersu at home, while outside they only speak Mandarin.—77-year-old woman, illiterate, farmer
(4) Good Ersu is spoken by people around the age of 50–60. Their language is the best. . . . Young people nowadays mostly study away from their home villages where they mostly speak Mandarin.—46-year-old man with elementary school education
(5) Older people speak more standard Ersu; the younger the speaker, the less standard the language they speak.—40-year-old woman, university graduate, teacher
Younger Ersu speakers are most affected by Mandarin pronunciations, leading the changes toward Mandarin phonology in every variable. This is consistent with findings on children's ethnic socialization (e.g., Phinney & Rotheram, Reference Phinney and Rotheram1987). When children enter the domains of schooling and national culture, they tend to rapidly reject the use of their community (indigenous) language. This is largely the result of a sensitivity of school-age children and adolescents to the valorization of the dominant majority language (e.g., Anderson, Reference Anderson and Cope2012:8; Heller, Reference Heller, Phinney and Rotheram1987).
Interestingly, the observed variation (the four variables examined in our study) carries its weight of social meaning in terms of a prestige contrast with Mandarin, while retaining a different social meaning within Ersu itself. That is, Mandarin-influenced Ersu pronunciations are associated with dominant Chinese culture and the prestige of upward mobility, but there is still a sense that conservative forms of Ersu are “better.” This creates a contrast between locals’ appreciation of who “speaks better” and the communal change in progress toward more Chinese-influenced forms. Recalling the interview questions listed in the Methods, we find that the vast majority of speakers agree that (a) the Ersu language as spoken by older people is the most “pleasing to the ear,” (b) middle-aged people speak less well, (c) young people yet less well, and (d) the Ersu as spoken by children is the least “correct.”
This study has examined the following question: “In what ways are Labovian principles relevant to endangered minority languages?” We considered our Ganluo Ersu field data in comparison to classic sociolinguistic patterns (e.g., Labov, Reference Labov1966, [1972] Reference Labov1991, Reference Labov2001), including social stratification, age, sex, prestige, and gendered changes in progress. In variables where sex has a significant role, it is the young women who are leading the change toward a more prestigious—more Mandarin-like—pronunciation. This is consistent with Labov's principles on gendered differences (e.g., Reference Labov1990:213–214, Reference Labov2001:261–293). We also find an interesting interaction between sex and SES in the loss of retroflexes. Retroflexes are decreasing with each step higher on the SES Combined Index. Further, when we divide our dataset into men and women and test for SES effects on the two separate groups, we see that SES is significant for women but not men. Ganluo Ersu women with higher social status are avoiding the use of retroflexes, thus positioning themselves more closely with the pronunciation of Southwestern Mandarin, which does not have these retroflexes. This is consistent with the classic sociolinguistic principle that women tend to use more standard forms than men do (e.g., Trudgill, Reference Trudgill1974) and to lead change to a more prestigious language in situations of language shift (e.g., Gal, Reference Gal1979). By contrast, the Ganluo Ersu men's retroflexes are predicted by age alone; younger men use fewer retroflexes, and social status is not a predictor for men's retroflexes. This is also consistent with prior observations that men often have greater loyalty to the conservative language norms of the community (e.g., Chambers & Trudgill, Reference Chambers and Trudgill1980; Lippi-Green, Reference Lippi-Green1989; Romaine, Reference Romaine, Holmes and Meyerhoff2003). As a result, simple age is the strongest factor for the men's retroflexes. Ganluo Ersu women's greater preference for prestige forms therefore matches the Labovian prediction for change from above (Reference Labov1990:213–214, Reference Labov2001:261–293).
Moreover, the greater influence of SES on Ganluo women can also be understood in terms of gendered sociological changes in China. As China has undergone major socioeconomic changes in recent generations, women's lives have been altered more dramatically than men's. Prior to Deng Xiaoping's era of sociopolitical reform, women had far lower educational levels and occupational opportunities than men did, so the changes have been more dramatic for women. Gendered sociolinguistic patterns emerging from such differentiated socioeconomic circumstances have been reported in major languages, such as German and Hungarian (Gal, Reference Gal1979), Brazilian Portugese (Bortoni-Ricardo, Reference Bortoni-Ricardo1985), German dialects (Lippi-Green, Reference Lippi-Green1989), and English (Cheshire, Kerswill, Fox, & Torgerson, Reference Cheshire, Kerswill, Fox and Torgersen2011; Milroy, Reference Milroy1980). As for smaller indigenous languages, Brunelle (Reference Brunelle2009) reported on a phonological variation in Eastern Cham of Vietnam that is sociolinguistically gendered for similar reasons.
This Ganluo Ersu study is the first variationist account of change in progress in a Tibetan-Burman language of Sichuan Province. Our interpretation of the results may benefit from comparison to a related study: Jamsu Reynolds's (Reference Jamsu Reynolds2012) work on Amdo Tibetan of Qinghai Province. Focusing on Amdo nasal variation in contact with Mandarin Chinese, Reynolds found that age, sex, and Tibetan written literacy are significant factors. Although that study does not address socioeconomic stratification in terms of occupation, the unequal relationship between Amdo Tibetan and Mandarin offers some similarities with our Ersu study. Like Ersu, Reynolds found sound changes in the direction of Mandarin-influenced pronunciations. Unlike Ersu, written Tibetan is actively used in the Amdo community of Reynolds's study. Reynolds found that literacy in written standard Tibetan is an important factor counteracting the contact-induced change in Amdo Tibetan. Illiterate speakers are leveling their nasal pronunciation in the direction of Mandarin (a nasal merger), but speakers with more education tend to resist the contact-induced shift toward Mandarin. For Ganluo Ersu, the lack of a written language facilitates the spread of convergent changes. In the Ganluo community, the only written language in use is Mandarin.
CONCLUSION
The small rural Ersu Tibetan community of Ganluo, Sichuan, is a long way from New York City: geographically, linguistically, and culturally. At first glance, a researcher might suppose that the classic Labovian principles formulated in Western, urban, industrialized environments would not be relevant in any way. However, we find that as Ganluo undergoes ever-increasing contact with a locally prestigious language and culture (Chinese), Labov's classic principles are relevant as the ongoing phonological convergence manifests itself in a socially stratified way. This suggests a generalizable, testable principle relevant to minority languages undergoing contact with dominant majority languages. We call this the principle of contact-induced sociolinguistic stratification: When a minority language undergoes linguistic convergence toward a majority language due to intense social and linguistic contact with the majority community, this convergence is manifested in a socially stratified way that is consistent with many of the predictions of classic sociolinguistic principles. Naturally, we expect the details to play out differently due to different localized cultural circumstances. But our Ersu study suggests that some of the broad outlines of the Labovian principles are evident in these intensive contact settings.
Maybe Ganluo Ersu is not so far away after all.
APPENDIX
Word list