

INTRODUCTION
The prevalence of dementia is increasing rapidly in Korea (Korea Ministry of Health and Welfare, 2007) and around the world as populations are aging globally. Therefore, the need for effective methods to evaluate and diagnose dementia has never been greater. The Clock Drawing Test (CDT) has been recognized as one of the most efficient and sensitive screening tools for detecting the dementias, especially dementia of the Alzheimer’s type (DAT). It is a simple test that is easy to administer, yet it taps various cognitive functions that deteriorate in dementia, especially in the DAT (Freedman, Leach, Kaplan, Delis, Shulman, & Winocur, Reference Freedman, Leach, Kaplan, Delis, Shulman and Winocur1994; Shulman, Reference Shulman2000).
To draw a clock upon verbal command, an individual must first have adequate auditory language skills to comprehend the instructions. Semantic and visuospatial representations of a clock and their retrieval mechanism are also crucial for successful clock drawing. To translate these mental representations into a drawing, one should be able to coordinate his/her visuospatial attention system with graphomotor skills (Freedman et al., Reference Freedman, Leach, Kaplan, Delis, Shulman and Winocur1994; Mendez, Ala, & Underwood, Reference Mendez, Ala and Underwood1992; Shulman, Reference Shulman2000). Executive functions and visual perception are also required for the planning and monitoring of the output. Furthermore, in the “10 past 11” version of the CDT, inhibitory control is required to suppress the perceptual pull toward the number 10 drawn on the clock to correctly position the long hand. These diverse skills are differentially organized in the cortical and subcortical, anterior and posterior, and left and right cerebral hemispheres. Each component can be selectively impaired, resulting in a qualitatively distinct drawing. It is this sampling of multiple neuropsychological functions that makes the clock drawing test such a sensitive screening tool for dementia.
Originally developed as a test for attention in hemineglect patients (Critchley, Reference Critchley1953; Luria, Reference Luria1980), the CDT has gained more popularity as a dementia screening tool in recent decades (see Pinto & Peters, Reference Pinto and Peters2009, for a review). With an easy and simple administration procedure, it has been well accepted by both clinicians and patients. Numerous studies have found excellent to moderate level of sensitivity and specificity in detecting dementia using diverse administration and scoring procedures (see Shulman, Reference Shulman2000, for a review; Death, Douglas, & Kennedy, Reference Death, Douglas and Kennedy1993; Lam et al., Reference Lam, Chiu, Ng, Chan, Chan and Li1998; Shulman, Shedletsky, & Silver, Reference Shulman, Shedletsky and Silver1986; Todd, Dammers, Adams, Todd, & Morrison, Reference Todd, Dammers, Adams, Todd and Morrison1995; Tuokko, Hadjistavropoulos, Miller, & Beattie, Reference Tuokko, Hadjistavropoulos, Miller and Beattie1992; Watson, Alfken, & Birge, Reference Watson, Alfken and Birge1993; Wolf-Klein, Silverstone, Levy, & Brod, Reference Wolf-Klein, Silverstone, Levy and Brod1989).
Despite its popularity, not many studies have examined the effects of education on clock drawing performance; moreover, few have developed education-specific norms for the CDT. Initially, the CDT was assumed to be relatively free of cultural and educational bias (Shulman et al., Reference Shulman, Shedletsky and Silver1986). Some studies have found the CDT scores to be independent of the educational level (Ratcliff, Dodge, Birzescu, & Ganguli, Reference Ratcliff, Dodge, Birzescu and Ganguli2003; Yamamoto et al., Reference Yamamoto, Mogi, Umegaki, Suzuki, Ando and Shimokata2004), whereas several studies have detected a correlation between them. In the United States and Europe, a few studies have recently reported that education and age had significant effects on the CDT performance in cognitively normal older people (Hubbard et al., Reference Hubbard, Santini, Blankevoort, Volkers, Barrup and Byerly2008; Von Gunten, Ostos-Wiechetek, Brull, Vaudaux-Pisquem, Cattin, & Duc, Reference Von Gunten, Ostos-Wiechetek, Brull, Vaudaux-Pisquem, Cattin and Duc2008). However, education was no longer significant after adjustment of the general cognitive performance in an U.S. study (Hubbard et al., Reference Hubbard, Santini, Blankevoort, Volkers, Barrup and Byerly2008). Von Gunten and colleagues (Reference Von Gunten, Ostos-Wiechetek, Brull, Vaudaux-Pisquem, Cattin and Duc2008) found that the oldest and least-educated group performed prominently worse than other groups and education have little influence on CDT performance except in this group. Thus, education effect was less important or more limited in these elderly populations with more than middle-school education. Education affected clock drawing ability strongly in non-demented older people in Asia and South America (Leung, Lui, & Lam, Reference Leung, Lui and Lam2005; Lin et al., Reference Lin, Wang, Chen, Chiu, Kuo and Chuang2003; Nitrini et al., Reference Nitrini, Caramelli, Herrera, Porto, Charchat-Fichman and Carthery2004), many of whom had received minimal education. Literacy also proved to be an important variable influencing the CDT performance (Nitrini et al., Reference Nitrini, Caramelli, Herrera, Porto, Charchat-Fichman and Carthery2004). This is consistent with the findings that show stronger effects of education in neuropsychological measures in populations with wider variation in educational attainment, which can also affect the efficacy of a neuropsychological test (Chey, Na, Park, Park, & Lee, Reference Chey, Na, Park, Park and Lee1999; Rosselli & Ardila, Reference Rosselli and Ardila2003; Sahadevan, Lim, Tan, & Chan, Reference Sahadevan, Lim, Tan and Chan2002).
In this study, we investigated the effects of education and literacy on CDT performance. We examined how these factors affect the quantitative scores, and established education- and literacy-based norms and provided 5 percentile cutoff scores for each subgroup. We then analyzed the CDT errors qualitatively and provided base rates of errors in normal older adults according to each education level. We further compared the CDT errors of normal low-educated elderly individuals with those of early DAT patients. Lastly, we investigated the clinical validity of the CDT by using cutoff scores based on education and literacy.
METHODS
Participants
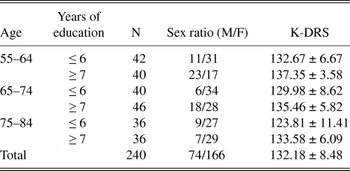
Two hundred forty elderly volunteers (age mean = 69.13; SD = 8.11; education mean = 7.48, SD = 5.06) were recruited from local community facilities, such as community centers, work places, senior citizen pavilions, and churches (Table 1). They were sampled from three age groups: 55–64, 65–74, and 75–84 years old. Each age group consisted of similar numbers of participants from two education levels: ≤ 6 years and ≥ 7 years. A previous study found that elderly Koreans who had received more than primary education performed significantly better in most neuropsychological functions than those who had received 6 years or less education (Chey et al., Reference Chey, Na, Park, Park and Lee1999).
Demographic characteristics and K-DRS Total score (Mean ± SD) of the normal elderly participants

Note
K-DRS = Korean version of the Dementia Rating Scale.
The volunteers were not demented and considered normal based on the following criteria: (1) free from cognitive disorders leading to functional impairments in everyday life; (2) live independently without difficulty; (3) absence of memory disorders; (4) absence of psychiatric and neurological illness; and, (5) absence of physical conditions that are known to compromise cognitive capacity (such as hypertension or diabetes) that could not be controlled by medication, thyroid disease, and loss of consciousness for more than 1 hr. Comprehensive neuropsychological evaluation was conducted to include people who would be representative of neurologically intact elderly Koreans. Initially, a brief neuropsychological interview was administered to the volunteers to confirm that they did not meet the Health Screening Exclusion Criteria (Christensen, Multhaup, Nordstroal, & Voss, Reference Christensen, Multhaup, Nordstroal and Voss1991). Older persons who could not perform the test due to severe vision or hearing problems were also excluded. General cognitive performance was evaluated with the Korean version of the Dementia Rating Scale (K-DRS; Chey, Reference Chey1998), and participants with scores lower than the cutoff scores were identified for further evaluation. Lastly, to ascertain a participant’s significant cognitive or behavioral changes in the past 2 years, the Semi-Structured Interview (SSI; Sano et al., Reference Sano, Devanand, Richards, Miller, Marder and Bell1995; Lee, Reference Lee2001) was administered to an individual informant who either had lived with or met the participant at least three times a week. To establish norms that are representative of the normal elderly population, we included participants who scored below the cutoff scores of the K-DRS norms (Chey, Reference Chey1998), if there was no corresponding functional decline identified during the SSI.
For the clinical validation study, 28 patients with mild dementia of the Alzheimer’s type (DAT) participated in the study (Table 5). Diagnosis of DAT was confirmed by a team of clinicians, including a neuropsychologist, a neurologist and a neuroradiologist, using the probable DAT criteria developed by the National Institute of Neurological and Communication Disorders and Strokes and Alzheimer’s Disease and Related Disorders Association (NINCDS-ADRDA; McKhann, Drachman, Folstein, Katzman, Price, & Stadlan, Reference McKhann, Drachman, Folstein, Katzman, Price and Stadlan1984). Laboratory tests (e.g., brain magnetic resonance imaging [MRI], urinalysis, blood test, chest X-ray) were performed to rule out etiologies of dementias other than Alzheimer’s disease. The Global Deterioration Scale (GDS; Reisberg, Ferris, De Leon, & Crook, Reference Reisberg, Ferris, De Leon and Crook1982) was used to assess the stage of illness. Eleven of the 28 patients (39.3%) had a GDS score of 4, whereas 17 patients had a GDS score of 5 (60.7%). Twenty-eight volunteers from the normal sample were age- and education-matched with the DAT cases as control subjects.
Informed consent was obtained from all participants before testing. A small honorarium was given to the participants upon completion of the task. And all data were collected in compliance with the Helsinki Declaration.
Instruments
The Clock Drawing Test
The Clock Drawing Test (CDT) consisted of three successive conditions presented in a fixed order: the Free-draw condition, the Pre-drawn circle condition, and the Clock-setting condition. In the Free-draw condition, participants were presented with an A4-size blank sheet and were given the following instruction: “I would like you to draw a clock face and put in the numbers.” After completion of the clock face, they were asked to set the time to 10 after 11. In the Pre-drawn circle condition, participants were given a sheet of A4-size paper with a pre-drawn contour of a clock; this contour was a 10-cm-diameter circle. In the Clock-setting condition, a toy clock was given, and the participants were instructed to “Set the time using the hands of the toy clock.” These procedures represent systematic efforts to parse or isolate the major factors involved in clock-drawing impairments (Freedman et al., Reference Freedman, Leach, Kaplan, Delis, Shulman and Winocur1994), that is, the successive conditions were meant to test the limits of the patients (Milberg, Hebben, & Kaplan, Reference Milberg, Hebben, Kaplan, Grant and Adams1996) who could not draw the correct clock in the first condition. Because the time to be set was the same in all conditions, a perfect score in the free-draw condition allowed the testee to skip the subsequent conditions and obtain the full scores for these conditions.
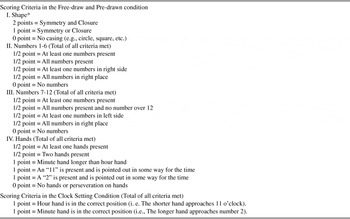
A modified version of the Clock Scoring System (CSS) by Todd, Dammers, Adams, Todd, and Morrison (Reference Todd, Dammers, Adams, Todd and Morrison1995) was used for quantitative analysis (Detailed criteria for the modified CSS are listed in Appendix 1). Qualitative error analyses of the CDT were performed using the criteria developed by Rouleau, Salmon, Butters, Kennedy, and McGuire (Reference Rouleau, Salmon, Butters, Kennedy and McGuire1992). The CSS has several advantages over other quantitative scoring systems in that it uses well-defined objective criteria, provides specific information concerning all aspects of clock drawing, and requires little subjectivity of the scorer (Todd et al., Reference Todd, Dammers, Adams, Todd and Morrison1995). Todd and colleagues (Reference Todd, Dammers, Adams, Todd and Morrison1995) found that the CSS discriminated dementia patients from the comparison subjects, even after controlling age and education. In addition, the inter-rater reliability of the CSS is quite high (range .82 to .98). We further elaborated the scoring criteria for clock hands to enhance inter-rater reliability. The CDT Total score is the sum of all scores from each of the three conditions and ranged from 0 to 20 (Appendix 2). The qualitative scoring system by Rouleau et al. (Reference Rouleau, Salmon, Butters, Kennedy and McGuire1992) defines and confirms the presence of conceptual, perseverative, stimulus-bound, and spatial arrangement errors. Its inter-rater reliability was quite good (Kappa coefficients range .63 to 1.0) in the Taiwan elderly sample (Chiu, Li, Lin, Chiu, & Liu, Reference Chiu, Li, Lin, Chiu and Liu2008).
The Korean-dementia rating scale
The Korean-Dementia Rating Scale (K-DRS; Chey, Reference Chey1998) is a translated and adapted version of the Dementia Rating Scale (Mattis, Reference Mattis1988). It is comprised of five subscales: Attention, Initiation and Perseveration, Construction, Conceptualization, and Memory. The total score of the K-DRS measures the general cognitive functioning of an elderly participant. Reliability and validity of the K-DRS has been reported (Chey et al., Reference Chey, Na, Park, Park and Lee1999). Test–retest reliability within a 2-week interval was quite high (r = .96), and the inter-rater reliability was also high (r = .99). The K-DRS Total score discriminated DAT patients from normal controls who were matched in age and education. It also correlated highly with the Mini-Mental State Examination-Korean (MMSE-K; Kwon & Park, Reference Kwon and Park1989), a Korean version of the MMSE.
The Literacy Questionnaire & the literacy evaluation form
The Literacy Questionnaire (Moon & Chey, Reference Moon and Chey2004) is a semi-structured interview that obtains information regarding the ability to read and write Hangul, the Korean letter system, in various domains, such as, reading transportation signs, labels for shopping, religious books, and newspaper/books, and also taking notes, and writing diaries/articles. The Literacy Evaluation Form (Moon & Chey, Reference Moon and Chey2004) provides specific criteria for literacy or illiteracy based on the testee’s responses during the Literacy Questionnaire interview. According to these criteria, people who barely read or write but cannot use Hangul in everyday life, as well as those who cannot read or write at all, are classified as functional illiterates.
The Semi-Structured Interview
The Semi-Structured Interview (SSI; Sano et al., Reference Sano, Devanand, Richards, Miller, Marder and Bell1995) purports to identify significant functional decline and change in seven cognitive and behavioral domains which are frequently compromised in dementia: memory, performance, language, disorientation, personality, depression, and behavioral disturbances. Additionally, we included the domain of psychotic symptoms (Lee, Reference Lee2001), which is rarely observed in mild stage of dementia but frequently observed in the moderate to severe stages. The SSI was used to identify functional deterioration in low cognitive performers and to diagnose dementia patients. Poor cognitive functioning in illiterates or older adults with low educational attainment could reflect stable low intelligence rather than dementia (Chey, Na, Tae, Ryoo, & Hong, Reference Chey, Na, Tae, Ryoo and Hong2006), and the SSI was used to differentiate significant functional decline from stable low intelligence.
Procedure
Neuropsychological interviews and neuropsychological tests were administered immediately after the health screening procedures in the normal elderly participants. Hearing difficulty or vision problems were determined at the beginning of the brief neuropsychological interview. Those who had significant difficulty hearing our instructions or seeing the stimuli with available aids, that is, glasses and/or hearing aids, were excluded from the study. The Literacy Questionnaire and the SSI were included in the neuropsychological interview. The neuropsychological test battery included the K-DRS (Chey, Reference Chey1998), the Elderly Memory disorder Scale (Chey, Reference Chey2007), and the CDT. The DAT patients underwent general physical and neurological examinations as well as a brain MRI, which was followed 4 weeks later by a neuropsychological evaluation.
Statistical Analysis
The descriptive statistics of the quantitative data were analyzed in two steps. The effects of demographic factors on the CDT Total score were first analyzed, followed by calculation of normative data specified by the significant demographic factors that were identified. Hierarchical multiple regression was used to examine the effects of demographic factors on the clock drawing performance. Predictors were entered in the regression model in the following order: years of education, literacy status, age, and gender. Based on the results of the hierarchical multiple regression analysis, analysis of variance (ANOVA) and post hoc tests were administered to determine the most appropriate groups for the norms. The means and standard deviations as well as the 5 percentile cutoff scores of the CDT Total score were calculated for each normative group. Additionally, the base rates for the CDT errors in normal elderly group were calculated. The group differences in cognitive performance between DAT patients and non-demented comparison group were analyzed with either the t test or the χ2 test.
RESULTS
Effects of Education, Literacy, Age, and Gender on the Clock Drawing Test Performance in a Normal Elderly Sample
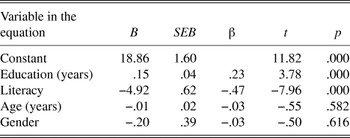
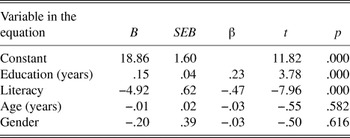
In a sample of 240 normal elderly persons, hierarchical multiple regression analysis with the CDT Total score as the predicted variable identified significant education (p < .001) and literacy (p < .001) effects, but no effects of age or gender (Table 2). Education accounted for 21.8% of the variance [education R2 change = .218; F(1,238) = 66.33; p < .001], whereas literacy further accounted for 16.8% of the variance [literacy R2 change = .168; F(1,238) = 64.81; p < .001].
Multiple regression analysis on the CDT Total score by education, literacy, age and gender (enter method)
Note
The predictors were entered into the model in this order: education, literacy, age, and gender. B = regression coefficient; SEB = standard error of regression coefficient; β = standardized regression coefficient.
Literacy- and Education-Based Norms for the CDT
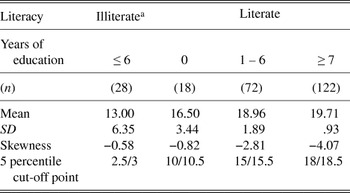
According to the results of the multiple regression, we subdivided two education groups (years of formal education ≤ 6 and ≥ 7) into four subgroups (years of formal education 0, 1–6, 7–12, and ≥ 13) to explore optimal normative groups. A two-way ANOVA [Years of formal education (0, 1–6, 7–12, ≥ 13) × Literacy (illiterate, literate)] on the CDT Total score was performed to confirm the grouping based on the results of the regression. ANOVA confirmed the significant main effects of literacy [F(1,234) = 27.17; p < .001] and education [F(3,234) = 9.64; p < .001]. The interaction effect was not significant [F(1,234) = .054; p = .82]. Therefore, the norms for the CDT Total score were specified by literacy and education. We further administered post hoc tests to examine group differences among the four education groups to determine the most appropriate education groups for the norms. First, the post hoc Tukey HSD tests demonstrated significant difference between the uneducated group and all of the educated groups (ps < .001). Furthermore, the test showed significant difference between the primary (1–6 years) and the secondary (7–12 years) education groups (mean difference = −1.04; SE = .41; p = .05). However, no difference was detected between the secondary and the higher (≥ 13 years) education groups (mean difference = .18; SE = .53; p > .98). When we performed the post hoc tests in the literate group only, the results were much the same. Based on these results, the literate elderly groups were classified into three education groups. No education effect was found in the illiterate participants [F(1,26) = .79; p = .38], because most of them had no experience of formal education (82%). Therefore, four separate norms specified by literacy and education were developed. The descriptive statistics as well as the 5 percentile cutoff scores of the CDT Total scores for each group are presented in Table 3. It is of note that, on average, illiterate elderly people obtained very low scores on the CDT, not unlike the performance of the dementia patients. Moreover, large performance variance was observed in the illiterate elderly sample.
Descriptive statistics of the CDT Total scores and 5 percentile cutoff points specified by education and literacy

a According to the definition of functional illiteracy, five individuals were considered as illiterate even though they reported several years of schooling experience.
Error Analysis
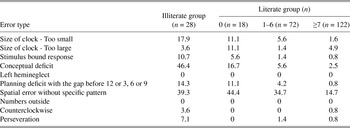
The base rates of the CDT errors observed in each normative group are demonstrated in Table 4. The most common error observed in the normal elderly people was the spatial deficit without any specific pattern (Rouleau et al., Reference Rouleau, Salmon, Butters, Kennedy and McGuire1992). This error was observed frequently in all the education groups. Conceptual errors, however, were observed frequently in the uneducated group, whereas rarely in the educated groups [χ2(1) = 41.70, p < .001].
The base rates (%) of the CDT errors in Free-Draw Condition by years of formal education and literacy status
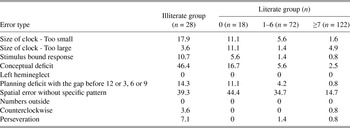
Note
CDT = Clock Drawing Test.
Validity of the CDT as a Screening Tool for Dementia
To examine the validity of the CDT as a measure of cognitive function in this population, we performed a Pearson correlation analysis between the CDT Total score and the K-DRS Total score, a validated measure of general cognitive ability (Chey, Reference Chey1998). The scores were significantly correlated (r = .62; p < .001).
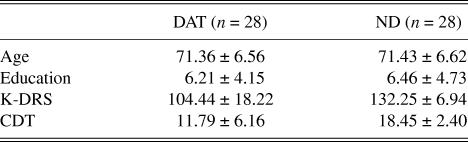
To investigate the clinical validity of the CDT, we compared the CDT performances of mild DAT patients with those of non-demented older adults. The DAT patients performed significantly worse than the non-demented matched controls (ND) in the CDT Total score [t(27) = 5.83; p < .001] as well as the K-DRS Total score [t(26) = 6.98; p < .001]. The means and standard deviations of the CDT Total score for the two groups are illustrated in Table 5. The five percentile cutoff scores for detecting dementia with the CDT had a sensitivity of 56% and a specificity of 89% for the DAT diagnosis. More specifically, the mid to high education subgroup (≥ 7 years; DAT = 10 cases; ND = 12 cases) illustrated a sensitivity of 60% and a specificity of 92%, while the low education subgroup (≤ 6 years; DAT = 18 cases; ND = 16 cases) showed 53% and 88%, respectively.
Age, education, K-DRS Total score and CDT Total score (mean ± SD) of the DAT and the non-demented elderly groups

K-DRS = Korean version of the Dementia Rating Scale; CDT = Clock Drawing Test; ND = non-demented matched controls.
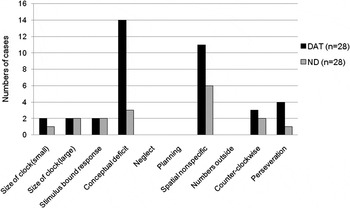
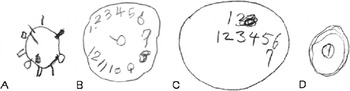
Frequencies of errors on the CDT performance in the non-demented comparison group and DAT group are presented in Figure 1. We performed χ2 tests of dependence between the groups (DAT-ND) and occurrence in only two error types (e.g., the conceptual errors and the nonspecific spatial errors), because half of the cells’ expected frequency was less than 5 in the other error types. A χ2 test of dependence between groups (DAT-ND) and conceptual errors (present-absent) was highly significant [χ2(1) = 10.22; p < .005], whereas that between groups (DAT-ND) and nonspecific spatial errors (present-absent) was not significant [χ2(1) = 2.11, p = .15]. Conceptual errors were observed most frequently in the DAT patients as in the normal older adults who were illiterate (DAT group 50.0%, illiterate group 46.4%, see also Figure 2).
Distribution of error types in the dementia of the Alzheimer’s type (DAT) and non-demented participants (ND) in the Free-Draw Condition.

Examples of conceptual errors observed most frequently in the illiterate individuals with no education and in the dementia of the Alzheimer’s type (DAT) patients. (A) Non-demented participant, female, 82 years old, uneducated, illiterate; (B) Non-demented participant, female, 69 years old, uneducated, illiterate; (C) DAT patient, female, 70 years old, education = 6 years, literate; (D) DAT patient, female, 57 years old, uneducated, illiterate.

DISCUSSION
Literacy and education of an individual significantly influenced the CDT performance in a non-demented elderly Korean population with variable educational attainment. Older people with lower education had lower CDT scores and wider range of performance. The effects were most dramatic in the illiterate individuals. It was noteworthy that illiterate and/or uneducated older persons made errors similar to those of the DAT patients, more specifically, the conceptual errors. This is the first study, to our knowledge, to examine the effects of literacy on the CDT performance systematically and qualitatively.
We found that errors committed by uneducated people, especially illiterate individuals, resembled those of the DAT patients (Kitabayashi, Ueda, Narumoto, Nakamura, Kita, & Fukui, Reference Kitabayashi, Ueda, Narumoto, Nakamura, Kita and Fukui2001; Lessig, Scanlan, Nazemi, & Borson, Reference Lessig, Scanlan, Nazemi and Borson2008; Rouleau et al., Reference Rouleau, Salmon, Butters, Kennedy and McGuire1992; Rouleau, Salmon, & Butters, Reference Rouleau, Salmon and Butters1996). Conceptual deficits observed in the DAT patients have been interpreted as stemming from the loss of semantic association evoked by the word clock and the graphic representation of a clock (Rouleau et al., Reference Rouleau, Salmon, Butters, Kennedy and McGuire1992). However, this interpretation assumes that everyone had developed the semantic and visuospatial representations of a clock and the constructional ability to translate these mental representations into a drawing before cognitive decline in dementia. Contrary to this assumption, some older persons might fail to develop these abilities. We found that misrepresentation of the clock itself was mostly observed in the uneducated participants from both the normative groups and the DAT group. The conceptual errors made by an uneducated normal individual are likely to be due to poor development of the representation of a clock or time on a clock face that are based on numeracy and abstract thinking. Even though semantic association or representation may be intact, the necessary constructional skills might be poorly developed in uneducated people as well (Moon & Chey, Reference Moon and Chey2004; Manly et al., Reference Manly, Jacobs, Sano, Bell, Merchant and Small1999).
The significant effects of education on the CDT performance found in our study are in contrast to its recognition as a test relatively independent of the effects of education (Shulman, Reference Shulman2000). This, however, appears to be mainly due to the difference in the range of education of the study populations. When we examined the education effects confined to a subpopulation of elderly people with 7 and longer years of education in our study, we also found insignificant education effects [7–12 years and >12 years; F(1,116) = 3.17; p = 0.08], while the age effects increased to significance [55–64, 65–74 and more than 74 years old; F(2,116) = 4.49; p < .05], a finding very similar to those observed in previous studies in the developed countries (Freedman et al., Reference Freedman, Leach, Kaplan, Delis, Shulman and Winocur1994; Yamamoto et al., Reference Yamamoto, Mogi, Umegaki, Suzuki, Ando and Shimokata2004). In an elderly Chinese sample with mean education less than ours and expected literacy quite low, the CDT performance correlated significantly with years of education (Leung et al., Reference Leung, Lui and Lam2005). Marcopulos, McLain, and Giuliano (Reference Marcopulos, McLain and Giuliano1997) also demonstrated that education was associated with the CDT performance in a sample of rural elderly Americans with limited education. Furthermore, the sensitivity and the specificity improved as the years of education increased. These findings suggest that the CDT may be a more valid tool for screening dementia in older people with more than primary education. This is consistent with Ainslie and Murden (Reference Ainslie and Murden1993) who examined the effects of education on the specificity and the sensitivity of several CDT scoring systems. They found that low education decreased the specificity of some scoring systems, and concluded that clinicians have to use the CDT with caution when evaluating individuals with low education. More recent study (Leung et al., Reference Leung, Lui and Lam2005) has provided different cutoff scores by educational level to discriminate early DAT patients (Clinical Dementia Rating = 1) from age-matched normal controls, finding that sensitivity was lowest in the low education group (years or education < 2). This could be partly due to the fact that despite no formal schooling some individuals attain high level of cognitive functions through informal education and self-discipline, especially in developing countries where economic hardship precluded formal education within disadvantaged populations. This possibility might cause large variance of cognitive performance, which could result in low sensitivity in this group of older people.
In this study, the sensitivity of the CDT for dementia screening was lower than those reported in previous studies (see Shulman, Reference Shulman2000, for a review; Death et al., Reference Death, Douglas and Kennedy1993; Leung et al., Reference Leung, Lui and Lam2005; Shulman et al., Reference Shulman, Shedletsky and Silver1986; Todd et al., Reference Todd, Dammers, Adams, Todd and Morrison1995; Tuokko et al., Reference Tuokko, Hadjistavropoulos, Miller and Beattie1992; Watson et al., Reference Watson, Alfken and Birge1993; Wolf-Klein et al., Reference Wolf-Klein, Silverstone, Levy and Brod1989). This difference could be due to the methodological difference determining cutoff scores between our study and other studies. We determined the cutoff scores at a specific point, that is, 5 percentile score, on the distribution of normative data for each education group. This method could warrant consistently high specificity irrespective of clinical groups, although the sensitivity might vary according to the concerned clinical group. On the other hand, most of the previous studies investigating the utility of the CDT as a dementia screening tool determined the optimal cutoff scores according to the contrasting-group method (Koffler, Reference Koffler1980). Because the cutoff score is set at the score that best separates the dementia group from the normal control group in these studies (Death et al., Reference Death, Douglas and Kennedy1993; Leung et al., Reference Leung, Lui and Lam2005; Shulman et al., Reference Shulman, Shedletsky and Silver1986; Todd et al., Reference Todd, Dammers, Adams, Todd and Morrison1995; Tuokko et al., Reference Tuokko, Hadjistavropoulos, Miller and Beattie1992; Watson et al., Reference Watson, Alfken and Birge1993; Wolf-Klein et al., Reference Wolf-Klein, Silverstone, Levy and Brod1989), the cutoff scores vary depending on the specific clinical group upon which the analysis was based. Consequently, both the sensitivity and the specificity also vary. Although dementia is a progressive disease, and the severity of symptoms differs according to the disease stage, few studies to date have used cutoff scores incorporating dementia progress.
Despite the fact that the CDT may be an attractive instrument for detecting dementia in the elderly people with more than primary education, it may not be the best tool for elderly individuals without education, especially those who are illiterate. Our findings suggest that clinicians must use caution in using the CDT in populations with low educational attainment. The findings of our study, however, need replication in other elderly populations with low education or who are illiterate. In addition, future studies need to consider larger patient groups with a wide range of educational levels to obtain more conclusive evidence.
In conclusion, this study found that the CDT performance is influenced not only by dementia but literacy status and educational attainment. Conceptual errors frequently observed in the DAT patients were also observed in the non-demented elderly individuals with scarce education, especially those who were illiterate. In addition, we provide normative data for the Korean population specified by education and literacy.
ACKNOWLEDGMENTS
This research was supported by Basic Science Research Program through the National Research Foundation of Korea (NRF) funded by the Ministry of Education, Science and Technology (No. 2010-0008922). The authors have no financial or other relationships that could be interpreted as a conflict of interest with regard to this article.
APPENDIX 1
Modified Version of the Clock Scoring System

Note
* Only in the Free Draw Condition.
APPENDIX 2
Calculation of the CDT Total Score
Total Score ( /20 points) = Free-draw ( /10 points) + Pre-drawn ( /8 points) + Clock setting ( /2 points)