INTRODUCTION
The Department of Health (DH) has recently provided capital funding for a national programme of investment for the use of Virtual Environments for Radiotherapy Training (VERT). Two systems are currently being used—a hospital-based seminar version (Seminar VERT™) employing front projected stereoscopic images, whereas a number of education providers are utilising a purpose built fully immersive system that involves the use of a stereoscopic immersive 3D image back projected onto a large screen within a bespoke viewing space or auditorium. In addition the university-based system (Immersive VERT™) involves the use of a head-tracking system which can change the image perspective according to head position relative to the viewing space. Both systems require the use of stereoscopic viewing goggles in order to present a truly 3D viewed image.
Preliminary evaluation of this innovative training tool is underway to explore the relative educational worth of this system within radiotherapy training programmes. Virtual reality (VR) and other computer-based simulation techniques have been adopted in a variety of medical fields as diverse as surgery, interventional radiology and critical care nursing.1–3 The adoption of these technologies takes place against a background of notional gains within education such as improved patient safety (with concomitant removal of clinical risk), a greater focus on acquisition of clinical skill (rather than just individual knowledge), and the potential to facilitate recruitment and retention.Reference Gaba4 VR systems themselves such as VERT have the potential to realise a significant number of educational benefits within radiotherapy training programmes, and early studies have suggested improvements in understanding and confidence with technical radiotherapy skills.Reference Bridge, Appleyard and Ward5
Initial training sessions of the use of this system using the fully immersive system have indicated that some VERT users may experience symptoms mimicking motion sickness (MS). These may include various individual symptoms such as nausea, disorientation or eye strain.Reference Johnson6 A distinction is made however with the use of simulators which do not employ true motion, and a distinct class of MS known as simulator sickness (SS) is recognised which parallels the symptoms of true MS with the patient remaining stationary.Reference La Viola7 In the case of SS, the user is immersed into a virtual environment which necessarily includes the inclusion of a wide field of view (FOV). This coupled with a moving image can induce an illusory sense of self movement due to the phenomenon of vection (a phenomenon familiar to many train travellers who interpret the movement of a train on an adjacent track moving in the backwards direction as their own movement in the forward direction). Vection-induced simulator sickness symptoms are analogous to those exhibited during true MS with the noticeable difference that they are not associated with true motion or accelerative forces, do not result in emesis (unlike MS), and can be damped down by the user closing their eyes. A number of physiological theories have been presented to explain why and how simulator sickness arises,Reference Warwick-Evans, Symons, Fitch and Burrows8 although the most convincing of this is the so-called sensory-conflict theory that suggests that simulator sickness arises due to the apparent conflicting signals received by the vestibular and visual apparatus. Dissonance between these two inputs may trigger a sense of motion with an associated onset of SS which is usually polysymptomatic.
The prevalence and severity of these symptoms may also be affected by a number of important factors including pre-existing illness, age, gender, image flicker, length of immersion or misalignment of projected images.Reference La Viola7
Simulator sickness is a recognised phenomenon existing in the use of VR systems used in military simulator training (noticeably in flight simulators), although it is recognisable in the use of viewing systems which employ a wide FOV such as IMAX™ theatres.Reference Johnson6 Its prevalence during the use of medical simulators is however unreported in the available literature.
Presence, which can be defined as the extent to which the participants’ senses are engaged by the virtual world, is another important factor in the use of virtual environments. The effectiveness of the system is thought to be linked to the sense of presenceReference Jerome and Witmer9 as it allows the user to have a more meaningful, richer experience within the medium. It is hypothesised that the sense of presence is affected by a number of factorsReference Jerome and Witmer9–Reference Witmer and Singer11 that include:
• the quality of the interface,
• pictorial realism,
• distraction,
• task,
• sensory fidelity,
• subject involvement,
• immersion,
• cognitive style,
Presence is thought to be inversely related to simulator sickness,Reference Jerome and Witmer9 the subjects who have a greater involvement and immersion in the artificial 3D world having a tendency to experience less simulator sickness. The more sickness symptoms subjects experience the more distracted and less presence they will feel. However the relationship between presence and simulator sickness has not been reported in all studies.Reference Seay, Krum, Hodges and Ribarsky12
METHOD
Participants and procedures
Participants came from Birmingham City University and City University, London; both of which use a stereoscopic immersive 3D image back projected VERT system. Apart from the lecturers, all subjects were first time users of the system. Data collection consisted of a questionnaire in two parts. The first part of the questionnaire was completed by all the participants just prior to using the Virtual Environment Radiotherapy Training (VERT) system to assess factors that might affect simulator sickness and included questions on illness, current medication, sleep patterns and susceptibility to travel sickness.
The participants then engaged in the VERT sessions setting up a variety of simulated set-ups including both photon (100% of subjects) and electron beams (67% of subjects). This was done as group work, during which subjects both actively engaged with the system and observed other subjects.
Post-VERT immersion subjects were given the second part of the questionnaire which consisted of questions about the session, the simulator sickness questionnaire (SSQ) and immersion using the igroup presence questionnaire.
Measures
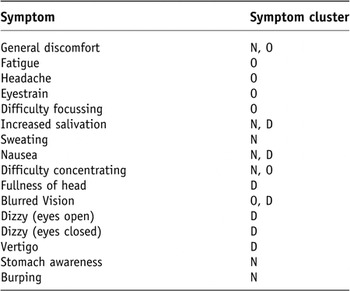
The SSQ developed by Kennedy et al.Reference Kennedy and Lane13 is a widely used tool that was originally developed to provide an index of symptom severity. Simulator sickness is an acknowledged polysymptomatic syndrome consisting of a number of symptoms occurring concurrently. To assess these during the implementation of the SSQ, participants self score symptom variables on a 4-point scale from 0 (absent), 1 (slight), 2 (moderate) and 3 (severe). The SSQ contains 16 individual variables which are also clustered within one or more aggregated groupings, namely nausea (N), occulomotor problems (O) and disorientation (D), (Table 1). The definitive list of 16 symptoms originates from the comprehensive work of Kennedy and co-workers who through an iterative process attempted to differentiate those symptoms observed only where true MS is observed as opposed to simulator sickness symptomatology. Using the questionnaire returns, symptom scores can be used to calculate a total symptom score via the use of a dedicated conversion formula.
Definitive list of SS symptoms with symptom cluster allocation

The presence questionnaire was developed by the igroup.Reference Schubert, Friedmann and Regenbrecht14 The questionnaire identifies three presence factors, spatial presence—the relationship between the virtual environment and the subjects body; involvement—attention devoted to the virtual environment; and realness—the subjective experience of realism within the virtual environment. An additional item assesses the general feeling of “being there”. According to Constantin and GregoroviciReference Constantin and Grigorovici15 two factors affect the sense of being there, the first being the quality of the virtual environment, the second the individual’s subjective experience.
RESULTS
A total of 84 subjects were originally included in the study; however, individuals who are not in their usual state of fitness (e.g. suffering from illness or hangover) tend to have an increased susceptibility to simulator sickness.Reference Kennedy and Lane13 Therefore, the authors advise that these individuals should not be included in the sample. This reduced the sample size to 75 subjects; 50 student radiographers, 15 teaching staff all of whom are qualified radiographers and 10 post-graduate oncology nursing students. The average age of the sample was 28.3, standard deviation 11.8.
The projection method (3D or 2D stereoscopic) utilised by each group/respondent depended on the material being covered. The majority of the subjects, 43 (57%), predominantly worked within a 2D environment, 18 (24%) stated that they used both methods equally during their session, and 14 (19%) predominantly worked in a stereoscopic 3D environment.
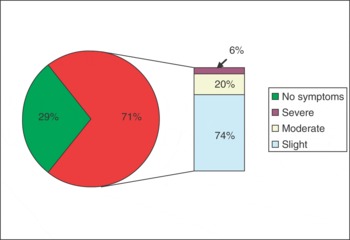
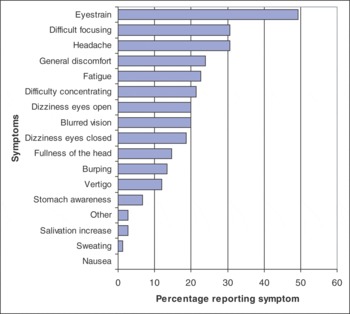
Of the 75 subjects, 22 (29%) experienced no side effects during the use of the VERT system. The remaining 53 subjects mainly reported “slight” symptoms when using the system (Figure 1). The individual symptoms and their degree of being reported are shown in Figure 2. The two most common symptoms reported are both related to visual issues.
Frequency of severity of reported symptoms.

Frequency of symptoms reported.

The data generated by the SSQ questionnaire were not normally distributed, as a result non-parametric tests were undertaken on the data set.
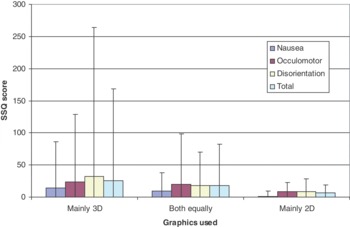
A Kruskal–Wallis test was used to assess the effect of the type of visualisation on SSQ scores. Data were grouped according to the visualisation use, predominantly 3D, both equally, and mainly 2D use. Results (Table 2) indicated that a difference exists in the SSQ domain of nausea and the total severity. The Dunn’s post hoc test revealed significant differences only occurred between the 2D users and 3D users (p < 0·05). The general trend (Rs = 0.25–0.31) was that side effects were greater the more 3D visualisation was used (Figure 3).
Kruskal–Wallis Visualisation
Severity of SSQ subscales depending on use. Bars represent mean value, whiskers the range.

Subsequent SSQ analyses excluded subjects exposed predominantly to the 2D system in order to control for this difference.
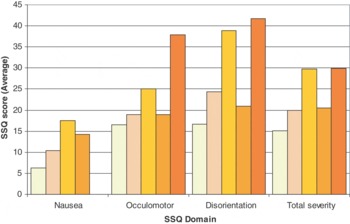
Using Spearman’s correlation, a weak positive correlation was observed between self reported levels of travel sickness and both disorientation and the nausea experienced during VERT, Rs = 0·28 and 0·27, p = 0·04, although this result must be treated with some caution. Figure 4 shows how for each domain the scores increase, but then for the higher levels of travel sickness the reported SSQ scores decrease; however, the two higher travel sickness groups contained only two and one subject respectively.
Effect of usual reported levels of travel sickness on the score for each SSQ domain. Bolder colour = higher reported level of travel sickness.

Finally, an analysis was conducted on the time subjects used the VERT system. The minimum recorded time of use for the system was 10 minutes, the maximum 120 minutes, with a mean time spent using the system of 67.9 minutes. No significant relationship between the time on VERT and SSQ symptoms was found.
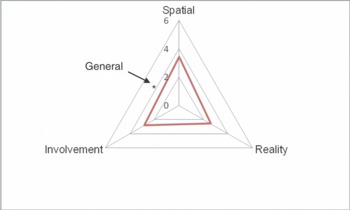
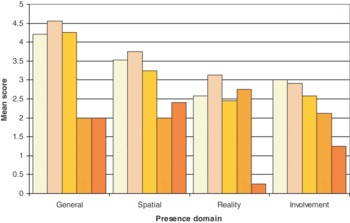
No significant relationship was seen between any of the SSQ subscale scores and presence sub scales scores, p = 0.23–0.98. Figure 5 shows that subjects felt that the sense of presence was highest for spatial awareness (3.4), whereas reality and involvement scored 2.6 and 2.8, respectively. Results also showed that the subject’s degree of travel sickness had a negative effect on their involvement as measured by the presence questionnaire, Rs = –0.3 p = 0.014 (Figure 6).
Presence levels experienced within VERT.

Effect of usual reported levels of travel sickness on presence. Bolder colour = higher reported level of travel sickness.

DISCUSSION
The increased use of virtual environments for the purpose of clinical skills training is a suggested strategy to increase clinical training capacity while reducing pressure on service departments.16 Despite the rapid implementation of these technologies, there is only a minimal evidence base that addresses either the practicalities of their use or their educational worth. The latter will hopefully be informed as part of a nationwide investigation centred on the use of VERT within undergraduate curricula across all HEIs employing the system.
In this work, we have attempted to address the immediate experience of VERT users in an effort to establish the extent and prevalence of simulator sickness. Although this was a small preliminary study, initial assessment suggests that the majority of users experience only slight symptoms, which do not appear to be a limiting factor to the use of the system. Unsurprisingly the measured symptom severity is more marked when using 3D images rather then 2D images. This might be explained by the increased prevalence of sensory conflict, particularly due to the increased perception of presence and more accurate simulation of the real world that is experienced using a 3D projection. The use of 2D did not lead to a complete preclusion of SS symptoms, as would be expected as even where using 2D projection vection effects are still extant due to the use of the wide FOV imagery. However there is a statistically significant diminishment of symptoms. A solution therefore to educators meeting students for whom SS symptoms become uncomfortable might be to switch to the use of 2D projection. While reducing the notional immersion within a real (i.e. multidimensional) world, the student still benefits from the added value of hands on skills simulation that VERT provides.
Within the data a weak positive correlation is identified in those participants who self reported a pre-existing disposition to travel sickness and who subsequently declared symptoms of nausea during the use of 3D VERT. The data collection tool used here (the SSQ) is a validated tool whose design excludes classical signs of MS including gastrointestinal distress and emesis.Reference Johnson6 As such a distinction is made here that these are two distinct phenomena. In either case (SS and MS) the sensory-conflict theory purports to explain these symptoms and it is appropriate to assume that many individuals who have previously experienced MS will be susceptible to mild simulator sickness. An increased predisposition to travel sickness also decreased the users involvement with the VERT system. This may raise issues in the use of the system for certain users who experience moderate-to-high levels of travel sickness, especially if expertise in using radiotherapy equipment is to be gained through regular use of VERT. Further work is required to assess this predisposition, but educators may wish to declare this increased susceptibility to side effects to users before they are inducted into the use of the VERT system.
The lack of significant correlation between simulator sickness and presence does not support the negative relationship seen in a number of studiesReference Jerome and Witmer9,Reference Witmer and Singer11 who rationalised that being sick would act as a distraction and so detract from the feeling of presence. The findings of this study are, however, supported by one other study who found no relationship between the two variables.Reference Seay, Krum, Hodges and Ribarsky12
The study found no relationship between the time subjects used the VERT system and any domain of the SSQ questionnaire despite this being purported to being one of the two main factors along with repeated exposure in determining the incidence of cybersickness.Reference Kennedy, Stanney and Dunlap17 However, the study recorded the total time of the session, which would include time not directly using system, such as tutorial work, questioning or observation of other users using the system which may or may not have been done in 3D.
CONCLUSIONS AND RECOMMENDATIONS
Simulator sickness was generally of a low level and did not affect the use of the VERT system; however, it must be recognised that the study was relatively small and predominantly looked at first time users of the system. Further studies are needed looking at larger sample sizes and including data on repeated use of the system to assess the phenomena of adaptation or acclimatisation among VERT users.
Findings indicate that subjects with an existing travel sickness may exhibit more simulator sickness, and have less involvement with the VERT system which may affect their learning. Further research on this area is needed that includes a larger proportion of subjects with a high susceptibility to travel sickness.