1. Introduction
The accessibility farmers have to high-quality seed of suitable varieties is crucial to achieving productive and resilient cropping systems. Well-functioning seed supply systems provide farmers with a fundamental basis for successful crop production, a vital determinant of their wellbeing. In commercialized agricultural systems, seed markets play a critical role in providing farmers with quality seed of desirable varieties in a timely fashion. In developing countries, particularly in poorer and marginal areas of these countries, formal seed markets are often weak or non-existent, although non-certified seed is frequently traded in local agricultural markets (Lipper et al., Reference Lipper, Anderson and Dalton2009). In such transactions, there is little distinction between seed and grain (or product) and a consequent lack of information about the genetic content, adaptation and quality of the seed, which reduces farmers' capacity to access the seed they need.
In these contexts, accessibility to seed, as well as information about crops and varieties, is often obtained through non-market channels (such as government agencies, international donors and NGOs) and informal networks (such as those based on kinship ties, which involve some form of association with other households). Besides own saved seed, these supply channels are often the most common seed source for farmers in developing countries. While these channels can complement formal markets when they exist, in some cases they become the key mechanism through which farmers obtain seed, especially in situations of high production risk, extreme poverty, and where seed and crop losses are recurrent. The role of social capital in facilitating access to seed then becomes of paramount importance. It can mitigate the effects of market failures and significantly increase the performance of farms by facilitating access to information and reducing the costs of contracting and coordination (Johnson et al., Reference Johnson, Suarez and Lundy2002).
The type of social capital households are endowed with influences the manner in which it is used (Nagarajan and Smale, Reference Nagarajan, Smale and Smale2006; Lipper et al., Reference Lipper, Anderson and Dalton2009; Cavatassi et al., Reference Cavatassi, Lipper and Narloch2011). In the social capitalFootnote 1 literature, formal organizations and informal networks are referred to as linking and bonding social capital respectively (World Bank, 2000). Linking social capital consists of vertical ties between distinct social and economic classes and involves intercommunity links. In contrast, bonding social capital refers to the strong horizontal ties connecting family members, neighbours and business associates within communities. These latter connections tend to be more homogeneous with a similar economic and social background, which can be beneficial in facilitating information flows and cooperative behaviour, but can also be limiting due to a reduced range of exchanges of information, technologies and goods.
Seed systems studies often cite the importance of bonding social capital on seed exchanges, highlighting the strength of ties (Almekinders et al., Reference Almekinders, Louwaars and de Bruijn1994; Badstue, Reference Badstue2004; McGuire, Reference McGuire2005). However, given the close geographic proximity of such ties, less seed diversity may be available. On the other hand, linking social capital, whose vertical structure requires connections outside the community, might provide greater seed choices. Although these ties may be weaker, the greater number of seed options available may lead to higher levels of on-farm diversity, as farmers can select and plant the materials needed to meet heterogeneous production and consumption conditions. According to some theorists, the process of economic development involves individuals moving from forms of bonding to linking social capital as they proceed from ‘getting by’ to ‘getting ahead’ (Foster et al., Reference Foster, Meinhard and Berger2003).
The manner in which farmers obtain seed and the type of seed and information acquired has implications not only for production and, thus, wellbeing but also for the level of on-farm crop genetic diversity maintained in situ, be it interspecific (diversity of crops) or infraspecific (diversity of varieties). The literature on crop diversification, both at crop and at variety level, indicates that seed supply factors influence the amount of diversity maintained on-farm, as do demand factors. Crop and varietal diversification can be a form of insurance against crop failures, when formal insurance mechanisms are non-existent and ex post coping strategies limited (Asfaw and Lipper, Reference Asfaw and Lipper2012). Crop and varietal diversification is also associated with a diminished occurrence of pest and disease invasion, contributing to stability of yields (Sullivan, Reference Sullivan2003; Guy et al., Reference Guy, Spann and Brooks2005). Moreover, maintaining crop and variety diversity is a strategy adopted by farmers to exploit the highly heterogeneous agro-ecological conditions, as well as to efficiently utilize other factors of production such as labour and animal power and avoid bottlenecks, particularly when off-farm opportunities are available (Bellon and Taylor, Reference Bellon and Taylor1993; Worede et al., Reference Worede, Tesfaye, Regassa and Brush2000). Finally, crop diversification is an important initial step in the transition from subsistence to commercial agriculture as farm households diversify from producing solely food crops to a wider range of commercial crops and before they reach a stage of specialization (Pingali and Rosegrant, Reference Pingali and Rosegrant1995).
In this paper, the main question we address is how the household endowment of social capital affects two key farm outcomes: on-farm crop diversity and household wellbeing.Footnote 2 The motivation for analyzing the role of social capital simultaneously on diversity and wellbeing rests on concerns that the two are mutually exclusive. While increasing on-farm crop diversity is being highlighted as an important strategy for adaptation to climate change, as well as for the conservation of genetic resources, higher levels of on-farm crop diversity have generally been found to be negatively correlated with indicators of household wealth (Fisher and Christopher, Reference Fisher and Christopher2007), with some exceptions where specific market values are associated with diversity (Smale et al., Reference Smale, Lipper and Kandoori2005; Lipper et al., Reference Lipper, Anderson and Dalton2009). If this is the case, promoting diversity may limit farmer wellbeing while, alternatively, promoting farmer wellbeing may limit diversity. Our objective is to then see how social capital, and by implication the expansion or changes in social capital, influence both diversity and farmer wellbeing.
The analysis presented in the paper uses a unique data set from the Hararghe region of Ethiopia, an area rich in crop genetic diversity and with high rates of poverty. The data set contains detailed information about infraspecific diversity for two main crops grown in the area: sorghum and wheat. Sorghum is indigenous to the area, with rich local diversity, cultivated primarily for subsistence needs and critical for food security. In contrast, wheat is a more recently introduced crop to the area and is mainly grown for marketing and income generation. Data from a ‘shock’ year (when farmers experienced a major drought and widespread crop failure) provide us with an opportunity to explore the role of social capital and seed system participation under stress. Among the ‘linking’ seed system channels, special attention is given to the seed intervention carried out by the Hararghe Catholic Secretariat (HCS), which consisted of seed selection, multiplication and distribution for both landrace and improved varieties of a range of crops.
The remainder of the paper is organized as follows. In section 2, we consider how agricultural household decision-making determines on-farm diversity and wellbeing as well as the role of social capital in this process. Section 3 presents background information on the study site, the method of data collection and a description of the data. Section 4 presents the empirical approach used to analyze the data, while section 5 provides results of the analysis. Finally, section 6 concludes the paper.
2. Crop diversity, wellbeing and social capital: the agricultural household model
To understand the influence of social capital on diversity, we begin by considering the behaviour of agricultural households with respect to crop and varietal choice. A common approach to understanding the decisions of agricultural households is to employ an agricultural household model where households are both consumers and producers of agricultural goods and face market constraints (Singh et al., Reference Singh, Squire and Straus1986). In the case of on-farm diversity, this approach has been formally used by Van Dusen (Reference Van Dusen2000) and Van Dusen and Taylor (Reference Van Dusen and Taylor2005) and conceptually by a number of other authors (see Smale et al., Reference Smale, Lipper and Kandoori2005). In this paper, we follow a similar approach, developing a model that helps understand the factors that influence household decision making, leading to a certain level of diversity. Among these factors, we give special emphasis to the role of social capital.
The model presented below differs from the Van Dusen and Taylor (Reference Van Dusen and Taylor2005) model in one key way. In their model, agricultural households choose, among other things, output directly, and the household maximization problem yields a set of optimal production levels. Assuming that the household does not value diversity itself, it is this optimal set of production levels that determines the diversity outcome. Since these optimal production levels depend on prices, production constraints and other factors, diversity also depends on these factors. The approach taken in this paper is similar, except that output is considered a function of the resources allocated to production, particularly land and labour resources. As will be seen, specifying the model in this way allows for examining the trade-offs between using household resources, particularly labour, for agricultural and non-agricultural uses and investment in social capital.
The model described in detail below focuses on crops and thus refers to interspecific diversity, but is also adaptable to the issue of infraspecific diversity. Interspecific diversity is a function of the crops a household chooses to produce, and therefore of the access to seed planted to produce those crops. In this regard, a clarification of the relationship between crops and seed is necessary. On-farm biodiversity is related to the crops a household chooses to produce, and therefore to the seed planted to produce those crops. In the context studied, as in many developing countries, the grain produced for consumption and sale does often overlap with the grain used for seedFootnote 3 (Sperling and Cooper, Reference Sperling and Cooper2003; Thijssen et al., Reference Thijssen, Bishaw, Beshir and de Boef2008). Most of the seed used for planting is sourced from informal channels or is farmers' saved seed from own output. For simplicity, the model concentrates on crop production and the allocation of resources when markets for particular crops do or do not function. For our purposes, this can be considered equivalent to the seed market not functioning. Either situation will have a similar effect on on-farm diversity.
Proceeding to the model, consider an agricultural household that maximizes utility of consumption of crops, X i for  $i=1\comma \; \ldots\comma \; \bar{X}$, and a non-agricultural consumption good, C. Household utility depends on the preferences and other factors, z h, that are determined by cultural factors, socioeconomic conditions and other household characteristics. The household is endowed with family labour,
 $\bar{L}$, and land,
 $\bar{A}$. Households are assumed to be unable to rent land in or out and, hence, land is a fixed factor of production. Similarly, households are assumed to be unable to hire in workers and are therefore constrained by their labour endowment. The household produces crops, Q i, for
 $i=1\comma \; \ldots\comma \; \bar{X}$, using a combination of labour, L i, and land, A i, subject to production constraints, particularly agro-ecological characteristics, z p. The ability to obtain crops for consumption and produce crops depends on characteristics of the market, z m, which include such factors as the transaction costs in purchasing and selling crops. Under certain circumstances, transaction costs may be sufficiently high as to make a particular crop inaccessible. The household can also allocate labour, L y, to a non-agricultural productive activity to earn outside income, Y, the returns of which depend on conditions in the non-agricultural market, z y.
The effect of social capital is incorporated into the model through the benefits of social ties in accessing and obtaining information, crops and seed. Presumably, such access and information requires some sort of investment in social capital on the part of the household both in time and other costs. For our purposes, we assume that the only cost is in the time devoted to developing and maintaining such ties, L s. This time input increases the household's social capital which provides crop for consumption, S, and depends on local conditions that influence access to social capital, z s.
The household can therefore obtain agricultural products or seed through: (a) production, (b) market channels if the market functions adequately, and (c) non-market channels. For simplicity, we assume two extreme cases of market functioning for agricultural seed and products: one in which the market functions perfectly and the other in which there is no market for the good such that X i = M, N where M is the marketable crop and N is the non-market crop. This assumption simplifies matters by allowing us to consider only two commodities and to consider the extreme of zero transaction costs in the market and transaction costs that are so high as to make the market non-functional. Of course, the expectation is that transaction costs are between these two extremes and in the analysis below the characteristics of the market, z m, will be used to control for the range of possibilities.
The household then produces the consumption commodity M in the amount Q M using a combination of labour, L M, and land, A M, and commodity N in the amount Q N using a combination of labour, L N, and land, A N, both subject to production constraints, z p. The household can buy or sell Q M if production levels do not match the desired consumption M. For commodity N, the household can obtain more than Q N through the use of its social capital S. The agricultural household model can be therefore expressed as follows:
 $$\matrix{\mathop{Max}\limits_{M\comma N\comma C\comma L_{i}\comma A_{j}} \quad &U\lpar M\comma \; N\comma \; C\semicolon \; z^{h}\rpar}$$
 $$\matrix{\hbox{subject to\colon } \quad &Y+p_{M} \lpar Q_{M} -M\rpar = p_{C} C}$$
 $$N = Q_{N} +S$$
 $$Q_{M} = Q_{M} \lpar L_{M} \comma \; A_{M}\semicolon \; z^{p}\rpar$$
 $$Q_{N} = Q_{N} \lpar L_{N} \comma \; A_{N}\semicolon \; z^{p}\rpar$$
 $$S = S\lpar L_{S}\semicolon \; z^{s}\rpar$$
 $$Y = Y\lpar L_{Y}\semicolon \; z^{y}\rpar$$
 $$\bar{L} = L_{M} +L_{N} +L_{S} +L_{Y}$$
 $$\bar{A} = A_{M} +A_{N}$$
where p C is the price of the consumption good and p M is the price of the market crop.
Given the objective function to maximize and our constraints, first-order conditions can be derived for the optimal labour, land and consumption levels of the three goods. Since our aim is to understand crop diversity, we are particularly interested in the optimal level of land and labour allocated to production, which are defined as follows:
 $$L_j = L_{j}^{\ast} \lpar \bar{L}\comma \; \bar{A}\comma \; p_{M}\comma \; p_{C}\comma \; z^{h}\comma \; z^{p}\comma \; z^{y}\comma \; z^{s}\rpar \hbox{ for} j = M\comma \; N\comma \; Y\comma \; S$$
 $$A_{j} = A_{j}^{\ast} \lpar \bar{L}\comma \; \bar{A}\comma \; p_{M}\comma \; p_{C}\comma \; z^{h}\comma \; z^{p}\comma \; z^{y}\comma \; z^{s}\rpar \hbox{ for} j = M\comma \; N$$
The optimal level of land and labour are then a function of initial land and labour endowments, prices, household characteristics, production conditions, characteristics of the non-agricultural economy and factors that indicate social capital.
Returning to the more general formulation of the model, the optimal levels of labour and land determine the optimal quantities produced of each crop as follows:
 $$\eqalign{Q_{i} &= Q_{i}^{\ast} \lpar L_{i}^{\ast} \lpar \bar{L}\comma \; \bar{A}\comma \; p_{1}\comma \; \ldots\comma \; p_{\bar{X}}\comma \; p_{C}\comma \; z^{h}\comma \; z^{p}\comma \; z^{m}\comma \; z^{y}\comma \; z^{s}\rpar \comma \; \cr &\quad A_{i}^{\ast} \lpar \bar{L}\comma \; \bar{A}\comma \; p_{1} \comma \; \ldots\comma \; p_{\bar{X}}\comma \; p_{C} \comma \; z^{h}\comma \; z^{p}\comma \; z^{m}\comma \; z^{y}\comma \; z^{s}\rpar \rpar }$$
or
 $$Q_{i} = Q_{i}^{\ast} \lpar \bar{L}\comma \; \bar{A}\comma \; p_{1}\comma \; \ldots\comma \; p_{\bar{X}}\comma \; p_{C}\comma \; z^{h}\comma \; z^{p}\comma \; z^{m}\comma \; z^{y}\comma \; z^{s}\rpar \hbox{for} i = 1 \ldots \bar{X}.$$
Following Van Dusen and Taylor (Reference Van Dusen and Taylor2005), we assume that households do not value diversity in itself and that the diversity outcome is the result of household behaviour with respect to the choices of resources allocated to different crops. Diversity, D, can be expressed as a derived demand as follows:
 $$\eqalign{D &= D\lpar Q_{1}^{\ast} \lpar \bar{L}\comma \; \bar{A}\comma \; p_{1}\comma \; \ldots\comma \; p_{\bar{X}}\comma \; p_{C}\comma \; z^{h}\comma \; z^{p}\comma \; z^{m}\comma \; z^{y}\comma \; z^{s}\rpar \comma \; \ldots\comma \; \cr &\quad Q_{\bar{X}}^{\ast} \lpar \bar{L}\comma \; \bar{A}\comma \; p_{1}\comma \; \ldots\comma \; p_{\bar{X}}\comma \; p_{C}\comma \; z^{h}\comma \; z^{p}\comma \; z^{m}\comma \; z^{y}\comma \; z^{s}\rpar \rpar }$$
or
 $$D = D^{\ast} \lpar \bar{L}\comma \; \bar{A}\comma \; p_{1}\comma \; \ldots\comma \; p_{\bar{X}}\comma \; p_{C}\comma \; z^{h}\comma \; z^{p}\comma \; z^{m}\comma \; z^{y}\comma \; z^{s}\rpar.$$
The results indicate that diversity is a function of the initial endowments of labour and land, prices, household characteristics, production constraints, characteristics of the non-agricultural economy and conditions that influence social capital formation. This relationship is similar to the model presented by Van Dusen and Taylor (Reference Van Dusen and Taylor2005) except that it adds the characteristics of the non-agricultural economy, the importance of social capital, and explicitly includes initial endowments.
Generally, diversity is measured by indices based on data on the number of crops planted and the area planted of each crop (Magurran, Reference Magurran1988; Meng et al., Reference Meng, Smale, Bellon, Grimanelli and Smale1998; Baumgärtner, Reference Baumgärtner2002). The analysis above assumes that the household decision can then be viewed as one where within a given community or region there are  $\bar{X}$ crops available but the household allocation of land to any one of those crops depends on a set of factors affecting access as noted in equation (13). This allocation results in a given level of on-farm interspecific diversity. For on-farm infraspecific diversity, an analogous equation can be used with diversity measures based on the number and area of varieties.
The model can easily be extended to distinguish between linking (vertical ties) or bonding (horizontal ties) social capital, with households choosing to allocate labour to neither, one or the other, or both, based on the marginal value of allocating labour to developing each type of social capital. Such an allocation would depend on the value to the household of obtaining access to additional output from creating these ties.
Finally, we are also interested in understanding the role of social capital in improving farmers' wellbeing. Given the context, wellbeing is measured through production indicators as well as indicators of food security and of farm level resilience to agricultural production shocks. Utilizing the output function (12), the model highlights the role social capital can play in production. We thus test the hypotheses that linking and bonding forms of social capital have an influence on farm-level inter and infraspecific diversity as well as on measures of agricultural production. Lastly, we also test the probability of adopting a certain coping behaviour in response to production shocks, B, as a function of the same factors that influence diversity and production as expressed in the following reduced form:
 $$B = B^{\ast} \lpar \bar{L}\comma \; \bar{A}\comma \; p_{1}\comma \; \ldots p_{x}\comma \; p_{c}\comma \; z^{h}\comma \; z^{p}\comma \; z^{m}\comma \; z^{y}\comma \; z^{s}\rpar.$$
3. The Ethiopian context
The data used in this paper were collected as part of a study to examine the relationship between seed systems and crop utilization patterns in the eastern part of Ethiopia. Ethiopia is one of the poorest countries in the world, with high rates of food insecurity and where many people depend on small-scale, low-productivity agriculture (Shiferaw and Holden, Reference Shiferaw and Holden1999; Thijssen et al., Reference Thijssen, Bishaw, Beshir and de Boef2008; FAO, 2010). The study site is located in the Hararghe zone, an area that has been a repeated recipient of both food and seed emergency relief supplies because of chronic food deficits and problems of seed insecurity. Drought is a major problem hindering agricultural productivity in the area. In the period examined, the 2002/2003 production season, a major drought affected the food security of over 10 million people (Bramel et al., Reference Bramel, Nagado, Haugen, Adugna, Dejene, Bekele, Traedal, Sperling, Remington, Haugen and Nagoda2004).
The area is considered a primary centre of crop diversity for sorghum and most varieties planted in the region are landraces, although formal sector breeding has been undertaken for almost 25 years (McGuire, Reference McGuire, Almekinders and de Boef2000). In addition to sorghum, farmers in Hararghe also produce maize, wheat, haricot bean and khat, besides vegetables and other crops. There have been numerous interventions in the seed system by the government and NGOs. An interesting intervention among the latter is the one carried out by HCS, a local NGO which has been active in the Hararghe region since the early 1990s with a range of interventions, including seed selection, multiplication and distribution for both landrace and improved varieties of wheat, sorghum and haricot bean. The Ethiopian government is undertaking a strategy of improving agricultural productivity primarily through agricultural intensification, involving an increased use of inputs, including seed of improved crop varieties (McGuire, Reference McGuire2005; Byerlee et al., Reference Byerlee, Spielman, Alemu and Gautam2007; Thijssen et al., Reference Thijssen, Bishaw, Beshir and de Boef2008; Cavatassi et al., Reference Cavatassi, Lipper and Narloch2011). Considerable resources have been dedicated to the development and dissemination of modern varieties (MV); however, their widespread adoption is restricted by limited seed industry development, barriers to seed marketing and poorly targeted crop breeding policies (Ahmed et al., Reference Ahmed, Sanders and Nell2000; Mulatu, Reference Mulatu2000; McGuire, Reference McGuire2005; Byerlee et al., Reference Byerlee, Spielman, Alemu and Gautam2007). Difficulties with seed quality, high prices and timely delivery have also been identified as a problem for farmers using the seed supplied by the formal sector (Lipper et al., Reference Lipper, Cavatassi, Winters and Smale2006; Byerlee et al., Reference Byerlee, Spielman, Alemu and Gautam2007; Thijssen et al., Reference Thijssen, Bishaw, Beshir and de Boef2008). Access to credit and poor rural infrastructure are other constraints farmers face in obtaining quality seed (Mulatu, Reference Mulatu2005). These problems are mostly related to obtaining formal sector certified seed of improved varieties, which for some of the main crops is estimated to cover less than 5 per cent of the total area cultivated (Thijssen et al., Reference Thijssen, Bishaw, Beshir and de Boef2008). Farm saved seed is, indeed, the main seed source for most Ethiopian farmers (McGuire, Reference McGuire2005; Mulatu, Reference Mulatu2005; Lipper et al., Reference Lipper, Cavatassi, Winters and Smale2006; Thijssen et al., Reference Thijssen, Bishaw, Beshir and de Boef2008). Studies of seed systems in the Hararghe area indicate that the informal seed sector is, by far, the primary source of seed supply (Storck et al., Reference Storck, Emana, Adenew, Borowiecki and Hawariat1991; Mulatu, Reference Mulatu2000; McGuire, Reference McGuire2005; Thijssen et al., Reference Thijssen, Bishaw, Beshir and de Boef2008) and off-farm seed sources turn out to be critical for a high percentage of farmers both within and among communities (McGuire, Reference McGuire2005; Thijssen et al., Reference Thijssen, Bishaw, Beshir and de Boef2008). Off-farm sources of seed range from gift giving and exchanges via social networks, to sales of non-certified seed in local agricultural markets, government and NGO seed distribution programs and some private sector seed suppliers. Social interaction is important even in market exchanges, which require some level of trust between buyer and seller and in some cases involve patron–client relationships (McGuire, Reference McGuire2005).
3.1. Sample selection and data collection
The study focused broadly on seed systems in the Hararghe region and the sample was designed to minimize sources of variation not related to seed systems. This meant including in the sample only peasant associations (PAs) within the mid and highland areas, which had similar agro-ecological zones and fairly uniform cropping patterns. The sample was also designed to allow for an evaluation of the effects of the HCS intervention in order to get an unbiased estimate of the impact of this important form of linking social capital. The principle governing the selection of the sample was to include PAs that participated in HCS as well as non-participant PAs that were as similar as possible to the HCS project areas and households. In the three woredas (districts) sampled within the mid and highland areas, a total of 30 PAs were selected for inclusion in the sample: 15 PAs in which the HCS project had been implemented and 15 similar PAs in which HCS did not distribute seed.
To select the observations to be included in the sample, households were divided into three groups: (1) households that participated in the HCS seed program (HCS); (2) households that did not participate, but lived within communities where the program was implemented (non-HCS I), and (2) households that did not participate and lived in communities where no program was implemented (non-HCS II). Approximately 24 households from each of the 15 HCS PAs were randomly selected from a list of names of HCS participants for inclusion in the sample. The remainder of the total sample was equally divided between the two types of non-participant groups. Non-participants in both the project and non-project areas were selected for the sample with the assistance of the PA committees that were asked to identify farmers within the community that fit the criteria but who had not (yet) participated in the HCS project. Since the demand for project participation was greater than HCS could meet, there were ample numbers of households on the waiting list for HCS participation. This list was used as the non-HCS I sample frame. Similarly, for households in non-HCS communities (non-HCS II), households within these areas were selected for inclusion in the PA sample frame through a process of consultation with PA committees.
A number of different survey instruments were used to collect data on household and community characteristics, crop production and the cropping systems, but this paper is based primarily on the household and community data. Of the 720 households in the sample, data for 699 were sufficiently complete for this analysis.Footnote 4 The scope of the survey is the cropping season 2002/2003. The household survey was implemented in two rounds in order to ensure sufficient detail on agricultural production. The first round was conducted towards the end of the Meher (main crop) planting season in August 2002. The second round was done after the harvest of the Meher crop in early 2003. In each of the 30 PAs surveyed, data on community characteristics were gathered through the use of a community-level survey instrument administered to key informants, usually PA leaders.
3.2. Descriptive statistics
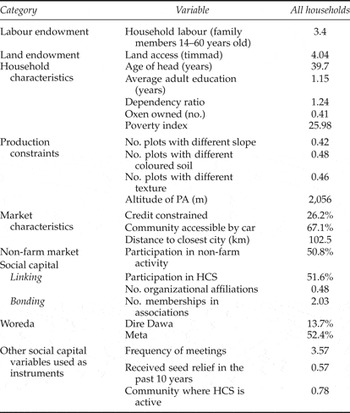
Table 1 presents summary statistics of the variables included in the analysis. Households have a high labour vs. land ratio with on average 3.4 units of household labour (over 14 years old and below 60) and access to 4 timmad (0.5 ha) of land. Household heads are relatively young (just below 40) and have limited education levels (1.1 years). The dependency ratio, measured as the number of children divided by the number of adults, is 1.24 on average, suggesting that for each adult there is over one child to feed. On average, households own 0.4 oxen, a key measure of wealth, but nearly two-thirds of households own none. A poverty index was calculated on the basis of Filmer and Pritchett's (2001) methodology using principal component analysis,Footnote 5 based on assets and ownerships. The index is standardized within a range between 0 (for the poorest) and 100 (for the richest) and tested for robustness. Lower index values indicate higher poverty levels. Its mean value of 25.98 indicates that households in the area are on average rather poor.
Household characteristics

Notes: Number of households = 699.
Source: Authors' calculation using FNPP-Ethiopia data set.
To measure the variability of production conditions, which is likely to lead to a higher diversity, we use the number of plots with different slopes, soil colours and soil texture. Two out of every five households have differing slopes (0.42), differing soil colours (0.48) and differing soil texture (0.46), suggesting many households face agro-ecological variability. Plots also vary in altitude, ranging from 1,100 m to 2,650 m, with the average reported as 2,056 m.
Most households are found to be credit constrained (26.2 per cent), a factor which is likely to influence their production decisions. Car access and distance to market are used as indicators of market access, with those with limited car access and farther from cities facing greater market imperfections and transaction costs. Approximately one-third of households live in communities that are not accessible by car. Most households are quite far from cities with an average distance to the nearest city of 103 km. Around half of households have at least one member who participates in off-farm employment activities.
The key variables of interest are the measures of social capital. By the design of the survey around half of the households participate in HCS. Slightly less than 50 per cent of households participate in some other organization, including other NGOs, national and internationally based groups and the private sector. Of these other organizations approximately 90 per cent focus on agriculture and 75 per cent have a principal focus on seed provision. Thus participation in these organizations is likely to increase access to a diverse range of crop genetic resources. These two types of affiliations – HCS and other organizations – are proxies for the household's vertical ties or linking social capital.
Second, households on average belong to two locally based associations with nearly 30 per cent belonging to three or more associations. This is used as a measure of horizontal or bonding social capital. The associations that households participate in include: PAs (77 per cent), self-help (idir) groups (77 per cent), women's groups (17 per cent), farmers' groups (14 per cent) and other types of groups (18 per cent), all focusing somehow on agriculture. PAs are responsible for the implementation of government decrees in the rural areas and household heads are considered members. PAs are empowered by the government to form service cooperatives that are combinations of two or more PAs for the provision of basic economic services, such as production inputs, credit, consumer goods and marketing services. Self-help or idir groups are long-term informal associations established among neighbours to raise funds for use during emergencies and can be characterized as traditional financial associations that are bottom-up and widely practised among Ethiopians (Bekerie, Reference Bekerie2004).
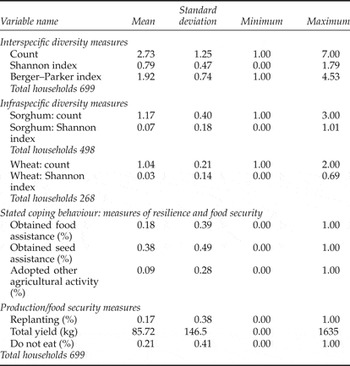
Four sets of dependent variables are utilized in the analysis: (i) interspecific diversity, (ii) infraspecific diversity, (iii) production measures, and (iv) coping behaviours/food security measures. Three indices adapted from the ecological literature are used to measure interspecific diversity. The richness index is a count of the total number of crops that the household reports planting over the season of interest. The Shannon index expresses proportional abundance or evenness, accounting for the land shares allocated to each crop as well as the number of crops (Magurran, Reference Magurran1988; Baumgärtner, Reference Baumgärtner2002). The Berger–Parker index of inverse dominance reflects the most widely grown crop on each plot by each household (Magurran, Reference Magurran1988; Baumgärtner, Reference Baumgärtner2002). In table 2, the mean values of the three indices are summarized.
Diversity and production measures

Source: Authors' calculation using FNPP-Ethiopia data.
The count data indicate that households planted on average 2.73 crops during the period of study with a range from one to seven. Seventeen per cent of households produced only one crop, and the majority (74 per cent) produced two to four crops. The Shannon and Berger–Parker indices are based on area planted and therefore left-censored when the household produces only one crop. The Shannon index by definition is censored at 0, and the Berger–Parker index at 1.
For infraspecific diversity, the focus is on wheat and sorghum. The count and Shannon index are calculated using the number and area planted to particular varieties. As seen in table 2, farmers plant between one and three sorghum varieties with most planting only one. Infraspecific diversity is even more limited for wheat with most households producing only one variety.Footnote 6
To investigate farmer wellbeing, we developed a set of measures related to coping capacity, productivity and food security. Since the year the data were collected was characterized by a major production shock in the form of drought, and given the importance of food security in the area, we focus on measures that refer to this aspect of wellbeing and that indicate household resilience to shocks through certain coping behaviours. Three main indicators were developed to measure this. The range of short-term coping responses measured include: (i) receiving food, (ii) seed assistance from friends, neighbours or organizations, or (iii) adopting agricultural strategies that include intercropping, replanting or changing planting time. As can be seen in table 2, households report adopting these three coping strategies 18, 38 and 9 per cent of the time, respectively.
Beyond the ‘stated’ coping mechanism, it is possible to ‘observe’ if households were able to replant in the wake of crop failure. Therefore, we use, as an additional indicator, replanting in case of crop failure, which was adopted in 17 per cent of cases. This measure indicates an interesting type of coping mechanism, being directly linked to seed access, availability and utilization. We also develop a measure of gross yield per timmad for sorghum and wheat as a crude approximation of household food production. On average nearly 86 kg per timmad are produced. Finally, a measure of whether anyone in the household reduced the number of meals they ate, a measure of food insecurity, is found to have been the case in 21 per cent of households.
4. Empirical approach to analyzing diversity
To evaluate the role of social capital in determining on-farm diversity, we estimate equation (13). Diversity is defined using the three measures described earlier: a count of the number of crops planted, the Shannon index and the Berger–Parker index. Since the count variable is the number of crops planted and takes a non-negative integer value, a Poisson regression model is appropriate. A censored regression model, like the tobit model, is appropriate for the Shannon and Berger–Parker indices. In each case, the resultsFootnote 7 were similar to those obtained using an ordinary least squares (OLS) estimation. The OLS results are thus for ease of comparison to the instrumental variable approach noted below. Following the literature on agricultural diversity, diversity is specified as a linear function of the factors identified in equation (13).
To assess the influence of social capital on production outcomes we estimate equation (12), whereas to analyze coping behaviour and other measures of wellbeing that affect production we run a probit model by estimating equation (14), given that each of the variables considered is a dummy variable taking the value of one or zero. Marginal effects are reported in all cases for ease of interpretation.
Although efforts were made to create a sample with a proper control and treatment group that allows for the analysis of HCS participation and its effects on diversity and production, there is still the possibility that the coefficient on HCS will suffer from program placement bias. Two steps are taken to avoid this bias. First, the estimates include a number of observable factors that, aside from influencing diversity and production, may influence participation. Including these factors potentially limits bias in the HCS coefficient.
Second, an instrumental variable approach is used. The instruments used are uncorrelated with the dependent variables but influence participation in HCS, and thus overcome potential bias caused by correlation between participation and the error term. In particular, frequency of PA meetings, whether the community received emergency relief in the last 10 years and whether the community was a HCS community are used. The first two variables are taken from the community survey and reflect communities that are well organized and have previous experience in receiving outside assistance. The third community variable reflects the ‘intent-to-treat’ households in the community and is a common instrument used in impact evaluation when all households in the treated communities were offered the option to enter the program (Galasso et al., Reference Galasso, Ravallion and Salvia2001; Ravallion, Reference Ravallion2005; Oosterbeek et al., Reference Oosterbeek, Ponce and Schady2008). As we control for location-specific effects, which might have a direct effect on outcomes, this should be a good predictor of participation.Footnote 8
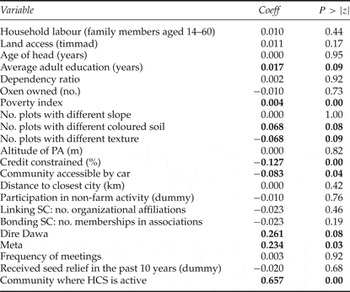
The eligibility criteria, together with the two other variables, are shown to be valid instruments in our case. They are highly significant in the first stage and the instrumented variable is significant in the second stage. We also check the null hypothesis that the instruments are weak, rejecting it as the F-statistics for excluded instruments is higher than 10. Lastly, the endogeneity test supports the null hypothesis that participation in HCS can be treated as exogenous. The results of the first-stage regression on HCS participation are presented in the appendix. Note that, while a standard IV approach is used for the diversity equation, an IV probit is used for the variables indicating wellbeing.
5. Results
5.1. Results on interspecific diversity
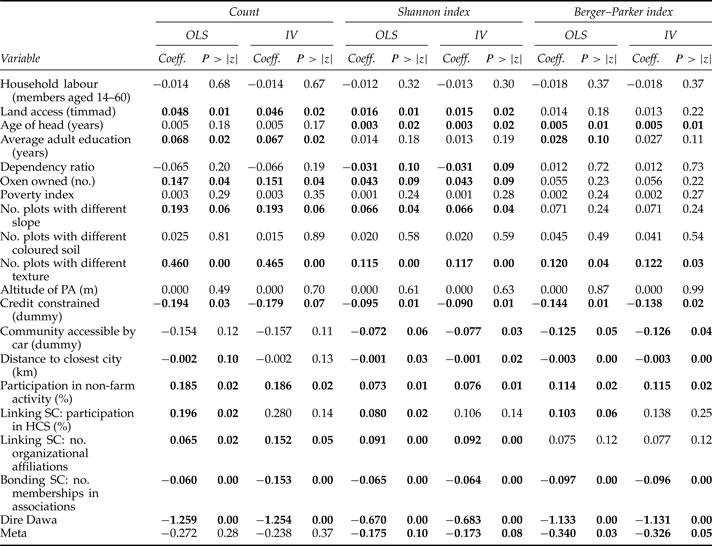
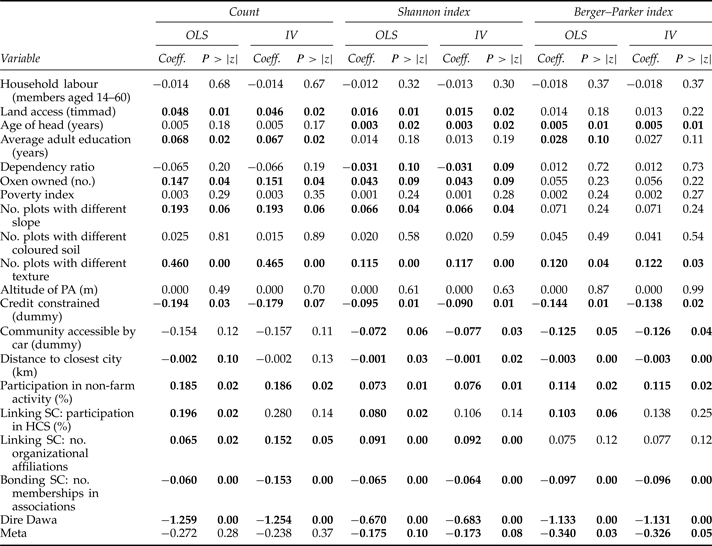
Table 3 presents the results for the analysis of on-farm crop diversity. The covariates included in the regressions represent the variable determinants of diversity in equation (13) with the exception of the price variables. Prices were excluded since many of the farmers in this study do not sell or buy in the market and results from a parallel market survey indicated very little price variation across woredas.
Factors influencing interspecific crop diversity
Notes: In all cases, constants were included in regressions but are not reported. In all cases, robust standard errors were calculated. Bold indicates significance with at least 90% confidence. Number of households = 699.
Source: Authors' calculation using FNPP-Ethiopia data set.
We proceed by examining each of the variables included in the regressions and discussing how they influence diversity as measured by each of these indicators, starting with the social capital variables. Given that results for the variables other than HCS participation tend not to vary substantially across the basic regression and the instrumental variable model, the results of each specification are not individually discussed except in the case of HCS.
As can be seen in table 3, the social capital variables (z s) that measure both linking and bonding social capital are significant in nearly all regressions across all specifications. As expected, the HCS variable is positive for all the measures of diversity except for the IV approach, although the coefficient remains positive and magnitude increases. This provides some evidence that the program both increases the number of crops and leads to a more even share of area to each crop and certainly does not lead to a deterioration of crop diversity, which is often a concern with outside interventions that bring in new cropping options.
Along with HCS, affiliation with other organizations also has a significant and positive effect on all measures of diversity. The results strongly suggest that linking social capital enhances crop diversity in the context of very poor agricultural producers. In contrast, the number of associations the household is affiliated with, a measure of bonding social capital, is negative and strongly significant for all measures, suggesting that bonding social capital limits crop diversity in these contexts. The results reported in table 3 for other determinants of diversity are very much along the lines of results from previous household analyses of diversity (e.g. Smale et al., Reference Smale, Lipper and Kandoori2005). The results indicate a significant and positive relationship between sizes of landholding and both the count and the Shannon index, indicating that land access is a constraint to diversification. For the Berger–Parker index, the results are positive but insignificant, suggesting that farmers are using additional land to plant more crops but that the principal crop they produce still tends to dominate the production area.
The labour endowment is expected to be negatively related to diversity. A household with fewer labour resources will be less able to spread labour over competing crop activities. The results do indicate a negative relationship between a household's labour endowment and diversity but in no cases is this relationship statistically significant.
The next set of variables control for household characteristics (z h). The age of the household head indicates both the experience of the household in agriculture as well as the life cycle stage of the household. While positive in all cases, the age of the household head does not appear to significantly influence the number of crops produced but does affect the area of production as indicated by the significant results for both the Shannon and Berger–Parker indices. Older household heads appear to plant a more equal share of land to each crop, whereas more educated households tend to plant more crops. A higher dependency ratio is negatively associated with evenness or diversification. This may be because households with more dependants specialize in subsistence crops. Owners of oxen tend to plant a greater number of crops which may be because they have a greater capacity to access seed for these crops as well as draft power to cultivate different crops. The results indicate that wealthier farmers tend to plant a greater number of crops which may be because they have a greater capacity to obtain seed for these crops as well as draft power to cultivate different crops.
Measures of the production conditions (z p) of the farm are indicated by agroecological variables. The expectation is that greater variability in agroecology leads to greater diversity as confirmed by the results of variability of slope and soil texture.
Characteristics of the market (z m) and conditions in the non-agricultural market (z y) are the next set of variables to consider. When markets for credit are limited, one would expect this to limit the ability of households to access seed of certain crops, as the results confirm. Accessibility by car and distance to the nearest city are both attempts to measure transaction costs with inaccessible and more distant communities facing higher transaction costs both for input as well as for output. On the input side, higher transaction costs may limit the ability of households to access seed, thereby limiting diversity. The results of the analysis indicate a negative relationship between accessibility and distance to market and diversity suggesting our sample farmers' decisions are, indeed, mainly driven by input conditions. Lastly, with regard to participation in non-farm activities the results suggest that the motivations of households of such participation are driven by liquidity constraints which enhance diversity by allowing households to purchase inputs and seed.
Unsurprisingly, location matters. The levels of diversity in Dire Dawa Woreda are significantly lower than for the base category Chiro, which may be related to the remoteness and lower levels of commercialization in the latter. There is also significantly less wheat production in Dire Dawa, compared with other sample woredas, raising concern that this may bias the results. Therefore, the model was re-run with only the two woredas of Chiro and Meta, yielding essentially the same results. An additional test was also conducted for location-specific effects by re-running regressions with PA-level fixed effects. Again, the results remained fundamentally the same.
Overall the results indicate that responding to agro-ecological heterogeneity and market constraints may be more important drivers of crop diversification than risk management. We would expect to find a negative relationship between crop diversification and other means of risk coping if indeed they are substitutes. Other risk-coping mechanisms are diversification into non-farm income-generating activities, which is also found to have a consistently positive relationship with all three measures of crop diversity.
5.2. Results on infraspecific diversity
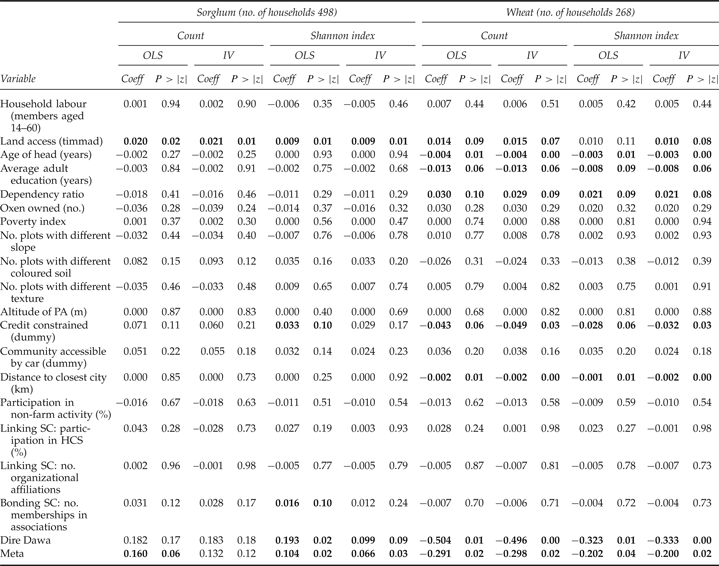
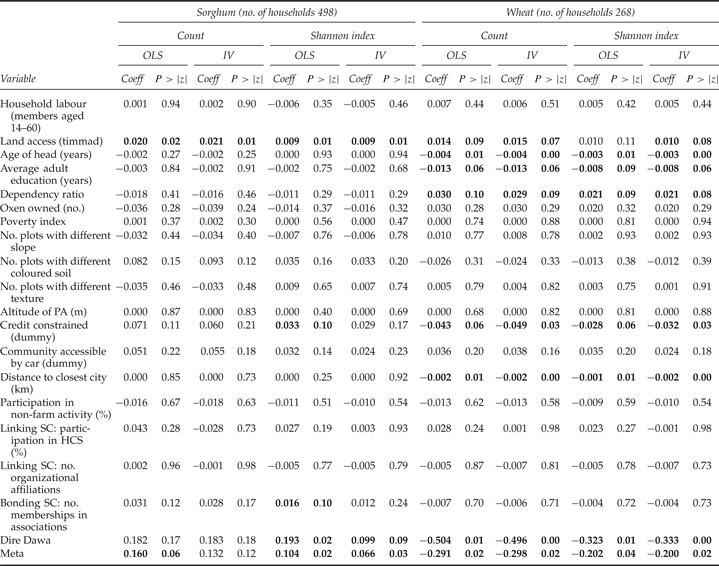
Table 4 presents the results of the analysis of the infraspecific diversity for sorghum and wheat. Since the analyses are run for both crops, we have limited the dependent variable to only two measures of diversity: the richness (count) and evenness (Shannon) measure. As noted in the summary statistics there is limited variation in on-farm infraspecific diversity for either crop – but particularly in the case of wheat. The concern, given the area is a centre of diversity for these crops, is that outside interventions would lead to deterioration in this diversity. The results on the social capital variables do not bear this out. Neither HCS affiliation nor links to other outside organizations (linking social capital) appear to have a positive or negative influence on infraspecific diversity. Membership in associations is generally positively linked to infraspecific diversity but tends not to be significant for wheat and positively significant for the evenness of sorghum.
Factors influencing infraspecific crop diversity
Notes: In all cases, constants were included in regressions but are not reported. In all cases, robust standard errors were calculated. Bold indicates significance with at least 90% confidence.
Source: Authors' calculation using FNPP-Ethiopia data set.
The finding on bonding social capital and infraspecific sorghum diversity on-farm may indicate the importance of localized social networks in accessing seed of the main food security crop grown in the region, which is indigenous to the area and characterized by long-term established networks of social exchange for a wide array of varieties available. On the contrary, there is very little diversity of wheat varieties in the area and its distribution is not common through traditional networks of gifts and seed exchange. Wheat seed is instead acquired through markets and more formal channels as is also confirmed by the negative and significant result of credit constraints for wheat which does not seem to affect sorghum diversity.
Among the other variables included in the analysis, few appear to consistently matter with the notable exception of land area. The more land a household has, the greater number of wheat and sorghum varieties planted and the more evenly they are planted. Lastly, more experienced and educated households as well as those less remote (i.e., those based in Dire Dawa and Meta) and more easily accessible tend to be more specialized in wheat varieties given the negative and significant sign on infraspecific wheat diversity.
5.3. Results on wellbeing
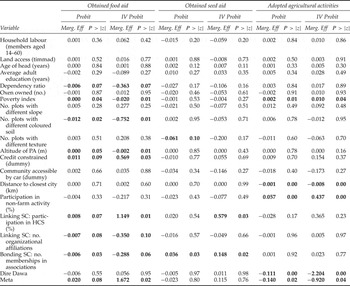
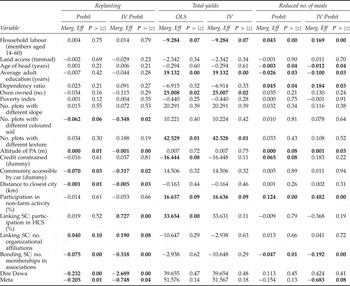
Table 5 presents the results on the measures for resilience to shocks through ‘stated’ coping behaviours whereas table 6 reports results of ‘observed’ production/food security measures. We mainly discuss social capital and a few other significant variables.
Stated coping behaviour: measures affecting food security/resilience

Notes: In all cases, constants were included in regressions but are not reported. In all cases, robust standard errors were calculated. Bold indicates significance with at least 90% confidence. Number of households = 699.
Source: Authors' calculation using FNPP-Ethiopia data set.
Factors affecting production and food security

Notes: In all cases, constants were included in regressions but are not reported. In all cases, robust standard errors were calculated. Bold indicates significance with at least 90% confidence. Number of households = 699.
Source: Authors' calculation using FNPP-Ethiopia data set.
HCS participation is significant and positively linked to coping through food aid. Both forms of social capital are significant and negatively related to coping with food aid, which is a somewhat surprising result, although perhaps dependent on the targeting procedures of food aid distribution campaigns, whereas being poorer, credit constrained and located at higher altitudes (where production is more difficult) leads to more utilization of food aid. Linking social capital is found to be significant and positively related to coping with seed aid, which is not surprising since several of the organizations engage in seed aid. Lastly, neither linking nor bonding social capital is found to be significant in the household's adoption of agricultural coping practices, which is instead used by poorer and more remote (i.e., distant from cities) households.
Looking at table 6, participation in HCS and other external organizations is found to be significant and positively related to replanting in the wake of a crop failure, suggesting that outside connections play a key role in addressing and responding to crop failure. On the other hand, being associated with other farmers is linked to being less likely to replant. HCS participation appears to be linked to higher total yields although this is only near conventional measures of significance using the IV approach. It suggests HCS is associated with obtaining slightly higher production levels of key foods, possibly owing to good quality seed. Finally, HCS participation and the affiliation with associations are negatively related to having to reduce food intake, although only the variable on associations is significant.
6. Conclusions
In poor developing countries, and particularly in marginal areas of these countries, seed markets and other seed supply channels often exhibit various dimensions and degrees of failure, which impact farmers' access and use of crop genetic resources on-farm. In this study, we assess the role of social capital in overcoming these failures. We examine the impact of two forms of social capital – linking and bonding – on various measures of on-farm crop diversity. The role of both forms of social capital on production, food security and resilience to shocks is also explored.
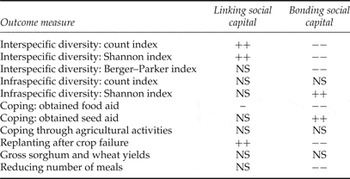
Table 7 summarizes the results of the estimations of social capital effects on farm-level outcomes. The results indicate that in the case of eastern Ethiopia, social capital is important in determining the seed supply sources farmers access and thus their on-farm use of crop genetic resources as well as household wellbeing, suggesting this may well be the case for other similar contexts. In particular, two overall results are immediately apparent: social capital is important in determining several of these outcomes and the effects of linking vs. bonding social capital are frequently opposite. Linking social capital is associated with higher levels of crop diversification and the likelihood a farm household will replant after a crop failure. Participation in HCS (an indicator of linking social capital) was found to be positively related to higher crop yields, possibly because of the provision of high-quality seed. Bonding social capital is associated with higher levels of sorghum varietal diversity on-farm, as well as access to seed aid. Higher levels of bonding social capital are significantly negatively related to crop diversification and replanting, both of which may be considered important measures of, respectively, ex ante and ex post risk coping. Yet households with higher levels of bonding social capital are less likely to reduce the number of meals they eat, suggesting this form of social capital is effective in supporting food security.
Summary of results on social capital, on-farm crop diversity and measures of wellbeing

Notes: ++, positive and significant; −−, negative and significant; NS, not significant.
The findings indicate that social capital plays a critical role in the household's access to seed and, through this, it affects the household management of crop genetic resources. The impact of social capital on the household's utilization of crop genetic resources can occur through changes on either the demand or supply side: e.g., through effects on the household demand for crop diversity by improving information about market opportunities and/or in accessing seed of crops and varieties needed to diversify. It is not surprising that households with links to organizations that span community and national boundaries have better access to information and seed. It is perhaps more surprising that households with strong social links within a community are less likely to be diversified in terms of crops, and that the effect is quite strong and significant. The most plausible explanation is that the results are tied to the characteristics of the households which are associated with each type of social capital. The degree of access farmers have to linking social capital is likely to be restricted and factors such as wealth and education are important in acquiring this type of capital. The opposite appears to be true for bonding social capital which is widely accessible and built on principles of mutual aid and generosity. Our results indicate that liquidity constraints are a barrier to crop diversification and thus to poorer producers; this may be an effect expressed in the negative relationship between bonding social capital and interspecific diversification.
The results indicate that linking social capital need not lead to a reduction in interspecific diversity and may in fact enhance it. Furthermore, linking social capital is not found to have any significant effect on infraspecific diversity, especially in the case of sorghum. In contrast, higher levels of bonding social capital are negatively related to interspecific diversity and positively related to infraspecific diversity for sorghum.
These results have some interesting policy implications for strategies aimed at improving household food security, ex ante and ex post risk-coping measures and on-farm diversity. They suggest that greater attention to building social capital is warranted, but interventions targeting different forms of social capital are required, depending on the nature of the policy objective. Efforts aimed at improving farmers' ability to accumulate linking social capital are clearly an important part of a strategy to improve access to crop genetic resources for increasing agricultural productivity and returns. Focusing on bonding social capital is an important type of safety net measure with benefits for food security in the wake of major production shocks. Ideally, there is a role for both forms of social capital and thus policy interventions need to build both. However, the very strong finding of a negative and significant relationship between bonding social capital and crop diversification raises the concern that building this type of social capital could actually result in negative impacts on measures that could increase returns to agriculture. Focusing on facilitating people's ability to ‘get by’ could reduce their capacity to ‘get ahead’. This is an issue that merits further research, and suggests that focusing only on grassroots and local efforts to build social capital may have some unintended effects in terms of development strategies and these should be carefully evaluated before proceeding with this type of activity.
Appendix
Probit on HCS participation