I. INTRODUCTION
Fabrication of tailor-made products and complex-shaped artifacts using traditional methods, such as casting and powder metallurgy, generally is a time-consuming process in a multiple step route.Reference Attar, Bonisch, Calin, Zhang, Zhuravleva, Funk, Scudino, Yang and Eckert1 Before a tool is put into use, it requires tedious heat treatment procedures, like quenching and tempering, to meet the service demand. These operations are usually not only of low efficiency and high cost, but difficult to guarantee quality. Therefore, it is profoundly significant to find out an available manufacturing approach avoiding undesired follow up process but still obtaining outstanding mechanical properties.
In recent years, additive manufacturing (AM), as presently one of the fast-developing advanced manufacturing techniques in the 21st century, emerged and has demonstrated promising application perspective with the introduction of several advanced energy carriers, such as the laser beam, electronic beam, and plasma jet.Reference Sun, Zheng, Liu, Liu and Zhang2 Selective laser sintering (SLS) and selective laser melting (SLM) are currently regarded as the two most versatile AM processes.Reference Zhang, Fenineche, Liao and Coddet3 Due to the additive nature, three-dimensional (3D) parts with extremely complex shape can be built directly from powders. Laser beam is used to selectively consolidate prespread powders in a layer-by-layer method. The laser scanning is controlled by a computer and each processed layer corresponds to a two-dimensional (2D) cross-section of the mathematically sliced computer-aided design model of the part.Reference Ma, Gu, Dai, Chen, Chang, Yuan and Shen4 The rapid tooling using SLS, which is based on a semisolid consolidation mechanism, has been proved to be unsatisfied, due to the material limitation, considerably high porosity and severe balling phenomenon caused by the limited wettability of liquid.Reference Simchi, Petzoldt and Pohl5 In comparison, SLM has large flexibility in feedstock and extremely complex-shaped parts can be easily fabricated with a high densification level without postprocessing treatments.Reference Thijs, Verhaeghe, Craeghs, Van Humbeeck and Kruth6 More importantly, the extremely rapid melting/cooling stages during the SLM process offer a high ability in the development of novel phase constitution with refined microstructures, which has attracted significant interests in both industry and academia.Reference Simonelli, Tse and Tuck7,Reference Wen, Li, Wei, Chunze, Zhang and Shi8
Nevertheless, it is known that the main drawback in current SLM technology is of low build rate due to the usual usage of low laser power of 50–200 W and attendant low scan speed of 300–800 mm/s, which will severely limit its efficiency and capability of accomplishing the production tasks within the required time. An efficient method to increase the build rate is to use a higher scan speed under a high laser power. It is significant that the laser power and scan speed should be matched, to ensure enough liner energy density for melting the powders completely. More importantly, the microstructures of SLM parts under high-speed laser scan are markedly different compared to those under low-speed laser scan. According to previous study,Reference Liu, Zhang, Chua and Leong9 ferrite, austenite, and martensite could be observed existing in different zones in M2 high speed steel with a low scan speed of 250–750 mm/s, owing to the different solidification rate and cooling rate in different locations of a melt pool. Apparently, the temperature gradient and attendant cooling rate are higher in the zone contacting with the previously processed layer, hence inducing the martensitic transformation easily. Whereas, ferrite forms in the interior of melt pool, due to the lower cooling rate compared to the other positions of the melt pool.Reference Holzweissig, Taube, Brenne, Schaper and Niendorf10 In general, the lath-shaped martensite has high hardness, good plasticity and tenacity. Thus, the achievement of a complete transformation from supercooled austenite to lath-shaped martensite, by high-speed laser induction, is expected, which can not only eliminate the cost and time in quenching process but also obtain favorable mechanical property of SLM parts. To the best of authors' knowledge, there are little previous studies focusing on the maximum permitted transformation of martensite and quantitative detection of retained austenite directly obtained by SLM without heat treatment.
Therefore, in this study, a thorough investigation of phase transformation and microstructural evolution affected simultaneously by the thermal history within the melt pool and the content of alloy elements, such as Cr, Mo and Si, was conducted. The metallurgy process and rheological behavior of the melt were studied in detail, to reveal the main features of the trapped pores and their formation mechanism under high-speed laser scanning. Although SLM provides a high forming accuracy compared to conventional methods, improvements are still needed in precisely fabricating SLM-processed parts with few dimension errors to better meet the demands of precision manufacturing. A good surface quality is critical in many applications, because a better surface quality can avoid the formation of surface initiated cracking and, an excellent wear resistance is of great help for improving the working life of parts.Reference Jagle, Choi, Van Humbeeck and Raabe11 So, it is greatly meaningful to make an in-depth research about the geometric accuracy and wear performance of SLM-processed parts. These investigations provide a significant insight to the SLM process and contribute to the fabrication of high performance iron-based parts with a short production period, to meet some specific requirements of the rapid tooling, biomedical, and aerospace sectors.Reference Liu, Li, Zhang and Sercombe12
II. EXPERIMENTAL PROCEDURES
A. Powder material
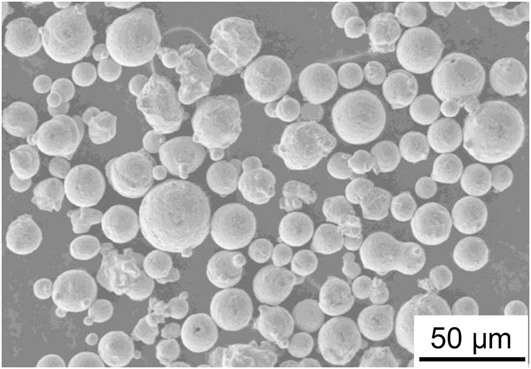
Gas-atomized 4Cr5MoSiV steel powder was used in this research; the chemical compositions are listed in Table I. The powder had a spherical shape (Fig. 1) and mean particle size of 21.6 μm.
Chemical compositions of as-used 4Cr5MoSiV steel powder.

Particle morphology of original powder.

B. SLM process
The SLM system, as shown in Fig. 2(a), was independently developed and consisted mainly of a YLR-500 ytterbium fiber laser with a power of ∼500 W and a spot size of 70 μm (IPG Laser GmbH, Burbach, Germany), an automatic powder layering device, an inert argon gas protection system, and a computer system for process control. When specimens were to be prepared, a stainless steel substrate was fixed on the building platform and leveled, with dimensions of 150 mm × 150 mm × 30 mm. The schematic of SLM process was shown in Fig. 2(b). Based on a series of preliminary experiments, the laser power (P) was optimized at 400 W. Meanwhile, the scan speeds (v) were set at 1200, 1600, 2000, and 2400 mm/s by the SLM control program, to change the processing conditions during one batch of experiments. Four different “laser energy per unit lengths” (LEPULs) of 333.3, 250.0, 200.0, and 166.7 J/m, which were defined byReference Gu, Hagedorn, Meiners, Meng, Batista, Wissenbach and Poprawe13:
 $${\rm{LEPUL}} = {P \over v}\quad ,$$
were used to assess the laser energy input to the powder layer being processed. To improve the dimensional accuracy and surface quality of SLM-processed parts, an orthogonal scanning pattern with optimal spot compensation was applied. Layer thickness and hatching spacing were set at 60 μm and 50 μm, respectively. The cubic specimens with dimensions of 10 mm × 10 mm × 4 mm were built in a layer-by-layer manner. The as-prepared parts showed a good surface finish without macroscopic balling phenomenon and dimensional distortion [Fig. 2(c)].
Independently developed SLM system: SLM-150 (a) and schematic of SLM apparatus (b); (c) SLM-processed parts.
C. Microstructural characterization
Phase identification was conducted by x-ray diffraction (XRD) using a D8 Advance x-ray diffractometer (Bruker AXS GmbH, Bruker Corporation, Karlsruhe, Germany) with Co Kα radiation at 40 kV and 40 mA, using a continuous scan mode. A scan at 2°/min was conducted over a wide range of 2θ = 20–80° to give a general overview of the diffraction peaks. Samples for metallographic examinations were cut, ground, and polished according to standard procedures and etched with a solution consisting of HNO3 (4 mL) and CH3CH2OH (96 mL) for 20 s. Microstructures were characterized using a PMG3 optical microscopy (OM; Olympus Corporation, Tokyo, Japan) and a S-4800 field emission SEM (FE-SEM; Hitachi Corp., Tokyo, Japan) at 3 kV.
D. Dimension accuracy and roughness measurement
The dimension accuracy of the SLM-processed parts under different processing parameters was tested. The error e was calculated using:
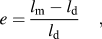 $$e = {{{l_{\rm{m}}} - {l_{\rm{d}}}} \over {{l_{\rm{d}}}}}\quad {\rm{,}}$$
where l m was the measured value and l d was the designing value. The JB-8c type contact stylus roughness meter (Mitutoyo Company, Kanagawa, Japan) was chosen to measure the top surface roughness and side roughness, of which measurement accuracy could be 0.4 μm. When measuring the R a, the measuring direction should be perpendicular to the scanning lines to get the maximal R a value. The sampling length was 0.8 mm, evaluation length was 4 mm, and measurement speed was 0.32 mm/s.
E. Mechanical properties tests
The Archimedes principle was used to measure the density (ρ) of the specimens. The Rockwell hardness (HRC) was measured using a HR-150A Rockwell hardness tester (Shenzhen TimeSun Electronics Co. Ltd., Shenzhen, China). The tribological property of specimens was estimated by the dry sliding wear tests conducted in a HT-500 ball-on-disk tribometer (Lanzhou ZhongKe KaiHua Sci. & Technol. Co., Ltd., Lanzhou, China) in air at room temperature. The counter material was GCr15 bearing steel ball with a diameter of 3 mm and a mean hardness of HRC60, using a test load of 3 N. The friction unit was rotated at a speed of 560 rpm for 15 min, with the rotation radius of 2 mm. The coefficient of friction (COF) of the specimens was recorded during wear tests. The wear volume (V) was determined gravimetrically using:
 $$V = {{{M_{{\rm{loss}}}}} \over \rho }\quad ,$$
where M loss was the weight loss of the specimens. The wear rate (ω) was calculated by:
 $$\omega = {V \over {WL}}\quad ,$$
where W was the contact load and L was the sliding distance.
III. RESULTS AND DISCUSSION
A. Metallurgical defect analysis
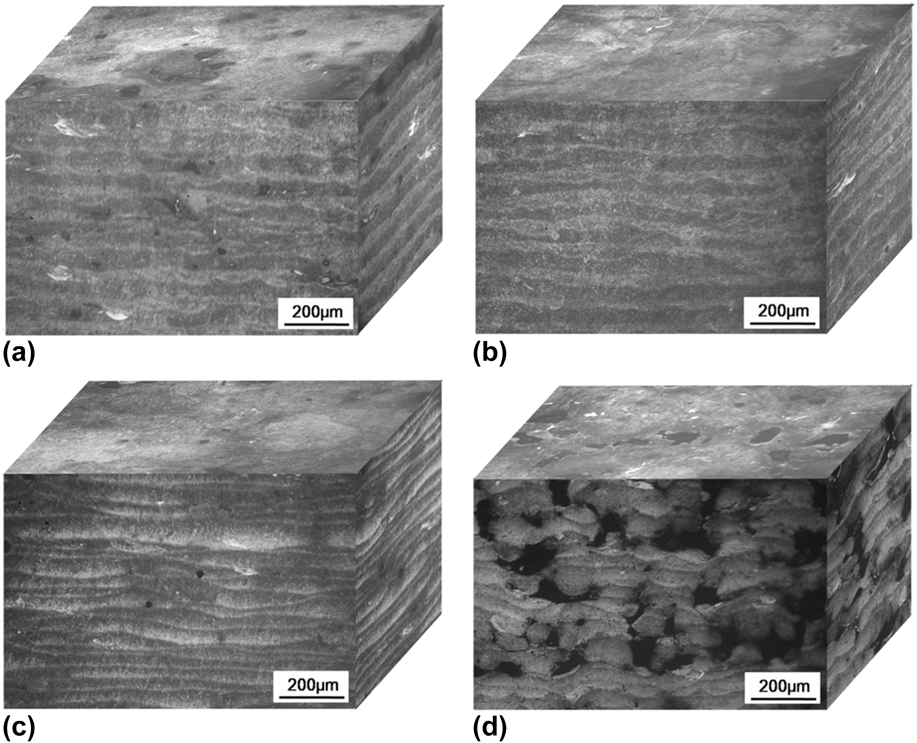
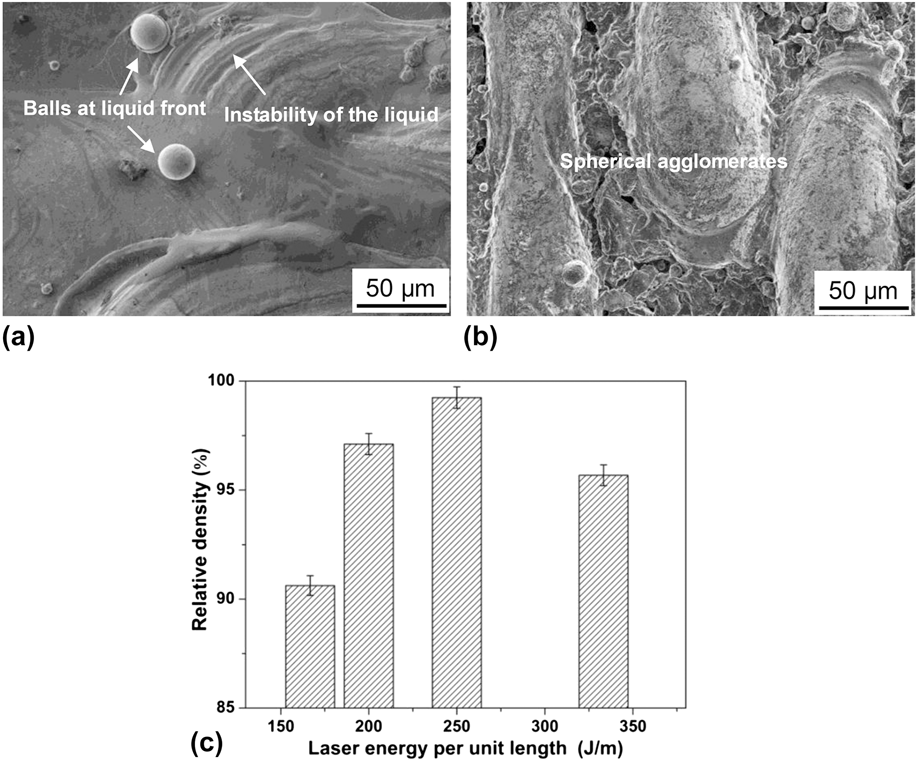
It is necessary to comprehensively analyze the metallurgical defect and corresponding densification behavior after SLM, because they are important factors affecting the performance of the SLM parts. The 3D-section microstructures using various processing parameters are given in Fig. 3. Figure 4 shows the surface morphology of SLM parts by FE-SEM and the relative density with different processing parameters. At a low scan speed v of 1200 mm/s and attendant high LEPUL of 333.3 J/m, some micropores were observed from the 3D-section and were of different sizes and shapes [Fig. 3(a)]. FE-SEM characterization showed that several metallic balls on a scale of ∼20 μm appeared on the top surface of part [Fig. 4(a)], which caused the formation of irregular-shaped pores on a scale of ∼10 to 40 μm within the SLM specimens and restricted the densification rate by 95.68% theoretical density (TD) [Fig. 4(c)]. As the v increased to 1600 mm/s, the 3D-section microstructures of SLM part became fully dense [Fig. 3(b)]. The melt pools were observed to be considerably continuous and stable. The pores on the SLM-processed surface and cross-sections were diminished and eliminated, which increased the densification level to 99.24% TD [Fig. 4(c)]. When the v further increased to 2000.0 mm/s, round and subround pores emerged on the 3D-section [Fig. 3(c)], reducing the densification rate to 97.11% TD [Fig. 4(c)]. As the v further increased to the highest value of 2400 mm/s, large irregular-shaped pores on a scale of ∼50 to 150 μm were clearly observed [Fig. 3(d)]. FE-SEM characterization showed that several discontinuous spherical agglomerates formed in this condition [Fig. 4(b)], and the attendant densification rate of SLM-processed specimens was about merely 90.62% TD [Fig. 4(c)].
OM images showing characteristic microstructures on 3D-section microstructures of SLM-processed parts at different processing parameters: (a) 333.3 J/m, 1200 mm/s; (b) 250.0 J/m, 1600 mm/s; (c) 200.0 J/m, 2000 mm/s; (d) 166.7 J/m, 2400 mm/s.
FE-SEM showing typical surface morphology of SLM-processed parts at: (a) 333.3 J/m, 1200 mm/s; (b) 166.7 J/m, 2400 mm/s. Variation of densification level of SLM-processed parts with the different LEPUL (c).
During the laser scanning process performed line by line, mobile melt pools form with a continuous liquid front. The amount of the liquid forming in the melt pool has a great influence on the densification level and the continuity of the resultant solidified microstructure by changing the rheological property of the melt pool.Reference Zhu, Lu and Fuh14 As the melt pool forms with full liquid, the dynamic viscosity μ of the melt can be evaluated byReference Gu, Hagedorn, Meiners, Wissenbach and Poprawe15:
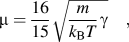 $$\mu = {{16} \over {15}}\sqrt {{m \over {{k_{\rm{B}}}T}}\gamma } \quad {\rm{,}}$$
where m is the atomic mass, k B is the Boltzmann constant, T is the temperature of the molten pool, and γ is the surface tension of the melt. Equation (5) reveals that the T has a considerable effect on the viscosity of the melt, thereby further influencing the wettability and liquid–solid rheological properties of the melt pool. Using a low v of 1200 mm/s can lead to a longer dwelling time of the laser beam on the surface of melt pool, thereby giving excessive energy to the pool and elevating operative T significantly. According to Eq. (5), a high T accordingly considerably decreases the dynamic viscosity μ within the pool. A long liquid lifetime and a low μ may increase melt instability and result in a higher level of overheating of the melt. Furthermore, there is a steep temperature gradient between the center and the boundary of the melt pool, hence generating the surface tension gradients and attendant Marangoni flow,Reference Simchi16 especially during high-energy laser scanning. Based on Arafune and Hirata's results,Reference Arafune and Hirata17 the dimensionless Marangoni number (M a) can be used to estimate the intensity of Marangoni flow:
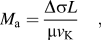 $${M_{\rm{a}}} = {{{\rm{\Delta }}\sigma L} \over {\mu {v_{\rm{K}}}}}\quad {\rm{,}}$$
where Δσ is the surface tension difference of Marangoni flow, L is the length of the free surface, μ is the dynamic viscosity, and v K is the kinematic viscosity. The formation of such intensive streams caused by a considerable decrease in μ within the pool is inclined to elevate the magnitude of the thermocapillary force and instability of the melt.Reference Simchi and Pohl18 Therefore, to lower the surface energy of melt, liquid droplets are inclined to splash from the liquid front, hence causing several small-sized metallic balls forming on the SLM-processed surface. Balling severely obstructs the even deposition of the fresh powder on the previously processed layer, thereby causing interlayer pores and a limited densification response of 95.68% TD. When using an enhanced v of 1600 mm/s, with attendant LEPUL of 250 J/m, the coherent interlayer bonding become visible without any residual pores, due to the appropriate dynamic viscosity and wettability; uniformly distributed layers can be observed showing a homogeneous microstructure of SLM-processed parts, hence obtaining the near full dense (99.24% TD) part after SLM. With the v increasing to 2000 mm/s, although the relative density is in a high level of 97.11% TD, it still can not meet the standard of near-full density (>98% TD). In this situation, insufficient densification behavior is mainly ascribed to the gas entrapment and resultant formation of round and subround pores [Fig. 5(a)]. Generally, liquid has relatively higher solubility of gas compared with solid. As the laser beam moves in scanning direction, the solid–liquid interface consists of the melting front and the solidification front. The melt can be enriched with gas by the interaction of the melt pool and the atmosphere surrounding it. For instance, during production, storage or handling of the powder, moisture is deposited on the powder particle surface and the melt can get hydrogen by the interaction of the melting front and the powder particles.Reference Louvis, Fox and Sutcliffe19 During solidification, the solubility of gas lowers with the temperature T decreasing. If the local solubility limit of the melt is reached, pore nucleation and growth are initiated [Fig. 5(b)]. Then, the growth will not stop until the pore is captured by the solidification front.Reference Atwood, Sridhar, Zhang and Lee20 The time t M between melting and solidification is calculated by means of the following equationReference Weingarten, Buchbinder, Pirch, Meiners, Wissenbach and Poprawe21:
 $${t_{\rm{M}}} = {{{l_{\rm{M}}}} \mathord{\left/ {\vphantom {{{l_{\rm{M}}}} v}} \right. \kern-\nulldelimiterspace} v}\quad {\rm{,}}$$
where l M is the length of the melt pool and v the scan speed. When using a high v of 2000 mm/s, the lower LEPUL results in a smaller length of melt pool and, according to Eq. (7), this time t M is unavailable for the pores to move up, driven by buoyancy forces, and escape, hence causing the formation of the round and subround pores. Using the highest v of 2400 mm/s leads to the lowest operative temperature T and increases the viscosity μ, which gives rise to the limited wettability of the melt and restricts the sufficient flow of the liquid, thus lowering the densification level of the SLM part. Generally, a high scan speed brings a significant disturbance and even interruption to the moving melt pool. To reach the equilibrium state, the instable melting track breaks up into several spherical agglomerates, which is termed as “balling” effect.Reference Li, Liu, Shi, Wang and Jiang22 Therefore, a conclusion can be drawn that the limited wetting characteristics and the melt instability caused by insufficient energy input are the critical factors in causing the large irregular-shaped pores, hence decreasing the densification level of SLM-processed parts to 90.62% TD.
The formation mechanism of gas pores: (a) OM image showing the trapped pores at v of 2000 mm/s; (b) the process of nucleation-growth of pore in the melt pool.
B. Phase identification and microstructural evolution
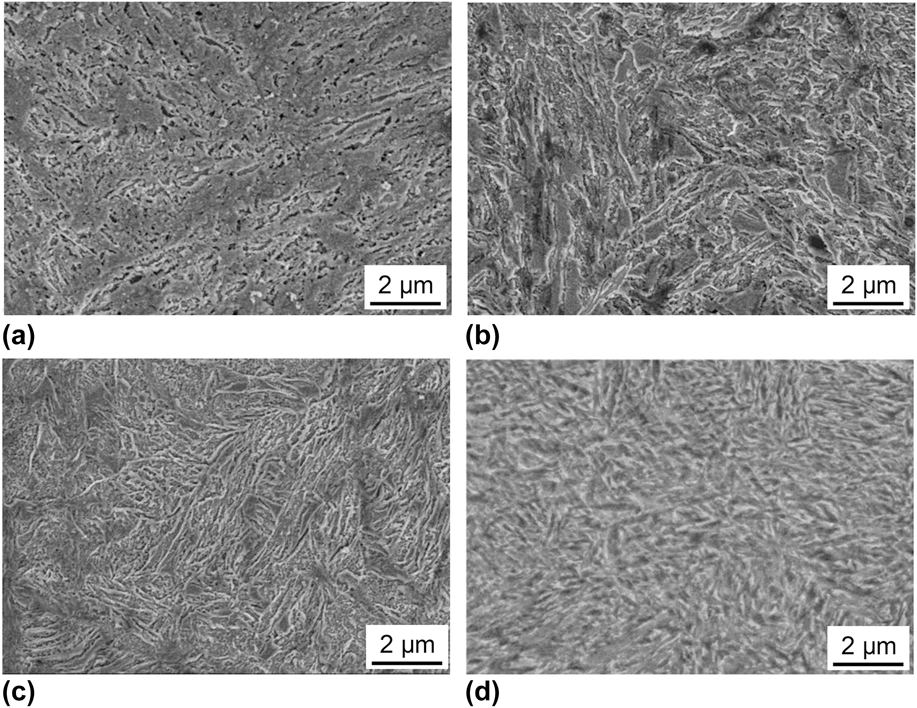
Figure 6 shows the FE-SEM images of typical microstructures of SLM-processed parts under various processing conditions. At all given parameters, refined martensitic structures were obviously observed. The FE-SEM characterization revealed that the martensite lath bundles had visibly random directions and was not associated with any preferred orientations, due to the complicated thermal history within the melt pool. In laser AM, the cooling rate of the molten pool can be determined by the following equationReference Yin and Felicelli23:
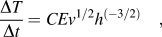 $${{{\rm{\Delta }}T} \over {{\rm{\Delta }}t}} = CE{v^{{1 \mathord{\left/ {\vphantom {1 2}} \right. \kern-\nulldelimiterspace} 2}}}{h^{\left( {{{ - 3} \mathord{\left/ {\vphantom {{ - 3} 2}} \right. \kern-\nulldelimiterspace} 2}} \right)}}\quad {\rm{,}}$$
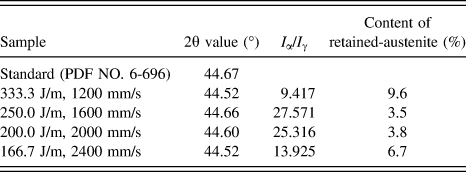
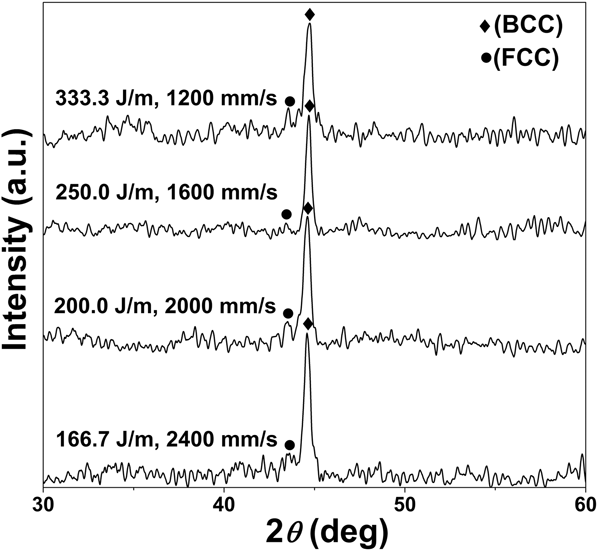
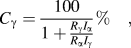
where C is a constant for the cooling rate of the molten pool that related to the powder material, E is the laser power density and h is the layer thickness. Equation (8) reveals that, when the laser power density is fixed, the cooling rate of the molten pool is proportional to the square root of scan speed. Thus, the fast-moving laser provides considerably large heating/cooling rates, which significantly accelerates the martensite transformation during the solidification process. It's worth mentioning that, alloy elements, such as Cr, Mo and Si, have the function of keeping the undercooling austenite stable and hence lower the critical cooling rate of martensite transformation.Reference Liu, Wang, Liu, Zhu and Zhao24 Thus, the effect of quenching tends to occur easily by conduction of heat through the substrate, favoring the prevailing martensitic transformation occurring in every part of the melt pool. However, it is possible that the martensitic microstructure retransforms to austenite during melting of an overlying powder layer, due to the constant heat flow from the molten regions to the building platform, and hence the austenite is not completely transformed to martensite. Then the effect of quenching will occur again as the temperature decreases below the martensite-start-temperature M s. Therefore, the martensite transformation and the retransformation from martensite to austenite are repeated during the SLM process, which may be beneficial to the reduction of retained austenite. The retained austenite can not only reduce the hardness and wear resistance, but also negatively impact the dimensional accuracy, due to the volume change during application. To determine the content of retained austenite, the XRD spectra of SLM-processed parts prepared using different scanning speeds within a 2θ range of 30–60° is given in Fig. 7. The strong diffraction peaks corresponding to α-Fe (PDF no. 6-696) and γ-Fe (PDF no. 33-0937) were detected at all given parameters, and the content of retained austenite C γ can be calculated byReference Zhou and Wu25:
 $${C_\gamma } = {{100} \over {1 + {{{R_\gamma }{I_\alpha }} \over {{R_\alpha }{I_\gamma }}}}}\%\quad ,$$
 $$R = {1 \over {{V_{\rm{c}}}}}\left[ {{{\left| F \right|}^2}p\left( {{{1 + {{\cos }^2}\,2\theta } \over {{{\sin }^2}\,\theta \,\cos \,\theta }}} \right)} \right]\left( {{e^{ - 2M}}} \right)\quad ,$$
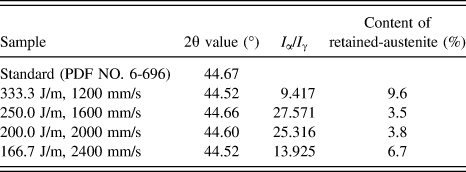
where I α is the diffraction intensity of α-Fe, I γ is the diffraction intensity of γ-Fe, V c is the unit cell volume, |F|2 is the structure factor, p is the multiplicity factor, θ is the diffraction angle, and e −2M is the temperature factor. The results are shown in Table II and the 2θ values are also given.
FE-SEM showing characteristic microstructures on cross-sections of SLM-processed parts at different processing parameters: (a) 333.3 J/m, 1200 mm/s; (b) 250.0 J/m, 1600 mm/s; (c) 200.0 J/m, 2000 mm/s; (d) 166.7 J/m, 2400 mm/s.
The 2θ values of identified peaks, the ratio of I α to I γ and the content of retained-austenite under various processing parameters.
XRD spectra of SLM-processed parts at different processing parameters, over a range of 2θ (30–60°).
From the results of Table II, the 2θ values of the α-Fe diffraction peaks in SLM-processed parts were generally smaller than the standard 2θ values (2θ = 44.67°). Essentially, martensite is the supersaturated solid solution of carbon in the α-Fe. Supersaturated C exists in α-Fe crystal lattice as solid solution atoms, thereby changing the lattice parameters of the α-Fe. According to Bragg's lawReference Song, Dong, Deng, Liao and Coddet26:
 $$2d\,\sin \,\theta = n\lambda \left( {n = 1,2,3, \ldots } \right)\quad ,$$
the observed decrease of 2θ at all given LEPUL indicates an enhancement in the lattice plane distance d, which is believed to be caused by the prevailing martensitic transformation. Normally, the occurrence of martensitic transformation is accompanied by microscopic volume expansion, which in turn creates stresses at grain boundaries.Reference Gu, Hagedorn, Meiners, Meng, Batista, Wissenbach and Poprawe13 Meanwhile, as the v increases, enhanced cooling rate may cause relatively large thermal stress. With the combination of these two kinds of stresses, the decrease of the lattice plane distance d and attendant increase of 2θ occur as the v is elevated from 1200 m/s to 1600 m/s. With a further increase in v from 1600 m/s to 2400 mm/s, a high laser scan speed can lead to an elevated kinetic undercooling degree ΔT k within the melt pool. The local growth velocity of solidification front v s can be calculated byReference Liu, Lan, Yang and Zhou27:
 $${v_{\rm{s}}} = v\,\cos \,\theta \quad ,$$
where θ is the angle between v s and laser scan speed v. In SLM process, the kinetic undercooling degree within the melt pool can be determined byReference Schwarz, Arnold, Aziz and Herlach28:
 $${\rm{\Delta }}{T_{\rm{k}}} = {{{v_{\rm{s}}}} \over \lambda }\quad ,$$
 $$\lambda = {{{\rm{\Delta }}{H_{\rm{f}}}{v_0}} \over {{k_{\rm{B}}}\mathop {{T_{\rm{L}}}}\nolimits^2 }}\quad ,$$
where λ is the interfacial kinetic coefficient, v 0 is the speed of sound (m/s), k B is the Boltzmann constant, and T L is the liquidus temperature (K). A large kinetic undercooling degree ΔT k is of great help to improve the nucleation rate and refine the microstructures of the SLM-processed parts. Thus the transformation stresses caused by martensitic transformation and the thermal stress caused by fast temperature variation can be borne by more grain boundaries, hence leading to the increase of the interplanar distance d and the attendant decrease of the 2θ.
From the results of the content of retained austenite given by Table II, it can be found that the transformation degree from supercooled austenite to martensite varies with different v and attendant LEPUL. At a low v of 1200 mm/s, according to a high LEPUL of 333.3 J/m, the possible higher amount of retained austenite in the microstructures may be attributed to the actually longer building durations in this condition as already demonstrated before. The tempering effect due to the repetitive heat flow to the previous processed layer is more distinct, hence resulting in the coarsening of microstructure significantly, as shown in Fig. 6(a). The content of retained austenite can be controlled below 4% as the v is settled at 1600 mm/s or 2000 mm/s, owing to the moderate transformation condition. A higher v of 2400 mm/s results in the increase of retained austenite and the formation of ultrafine needle-shaped martensite as shown in Fig. 6(d). Generally, needle-shaped martensite can have negative effects on the tenacity of parts. Thus using an overlarge v will cause severe brittleness and deteriorate the mechanical properties of the SLM parts. Moreover, even though the cooling rate of melt pool is elevated with the v increasing, the poor interlayer bonding and the large interlayer pores may decrease the contact area between melt pool and heat transfer substrate, hence restricting the successful martensitic transformation.
The content of retained austenite is also influenced by the M s, which depends on the alloying functions of Cr, Mo, and Si in the austenite phase. Generally, excessive alloying elements can significantly decrease the M s and increase the quantity of retained austenite.Reference Zhang, Wang, Li and Li29 In this study, the composition of the alloying elements was optimally designed. They can be reliable stabilizers ensuring the successful process of martensite transformation.
C. Geometric accuracy
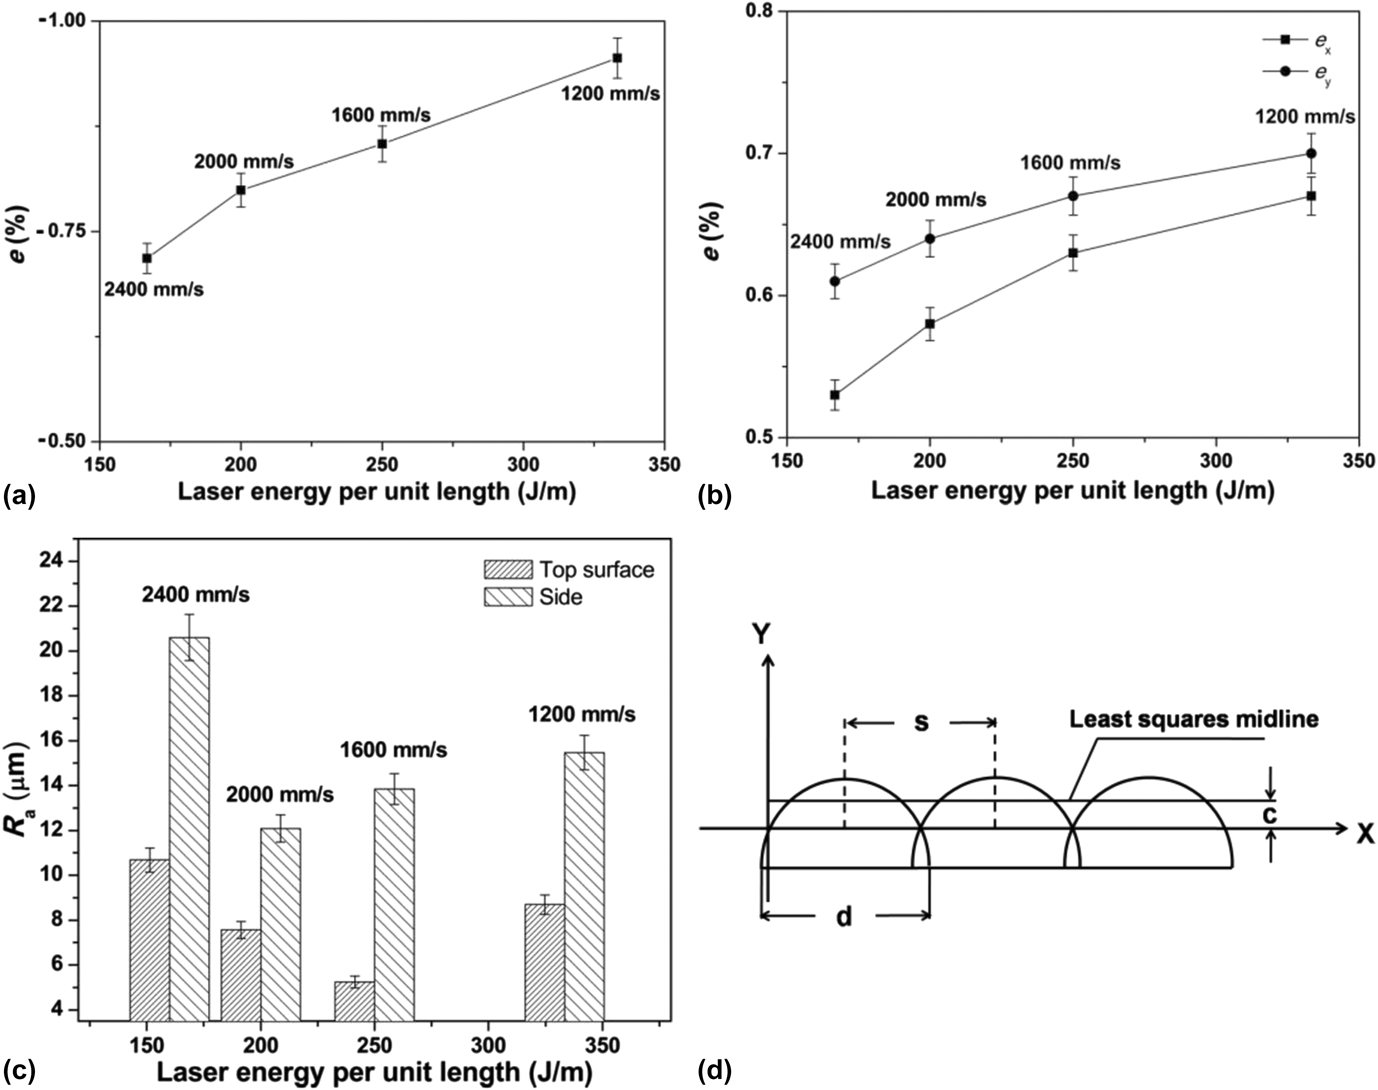
The dimension errors in building direction (z-axis) and horizontal direction (x-axis and y-axis) were measured, respectively, and Fig. 8 shows the measurement results, in which e x, e y, and e z are respective errors. Because of the densification effect caused by conversion of loose powder to dense liquid, a nominally even powder bed surface tends to become a curved surface or a recessed region. The shrinkage occurs rapidly once the powder material becomes fully molten.Reference Ma, Wang, Gao and Zeng30 As the part is fabricated layer upon layer following the same pattern, the power thickness shows a growth trend layer-by-layer and hence the thickness of last layer is generally much bigger than the designing thickness. Thus, the relatively large errors in building direction can be ascribed to the shrinkage of the last powder layer. According to previous investigation,Reference Wang, Yang, Su and Chen31 assume a layer thickness is set to h, steel powder density ρ1, and fabricated part density ρ2, the shrinkage of metal powder after melting and solidification approximately equals to h(1 − ρ1/ρ2), the nth layer thickness h n can be expressed as follows:
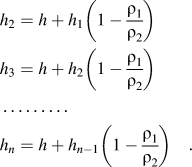 $$\eqalign{ & {h_2} = h + {h_1}\left( {1 - {{{\rho _1}} \over {{\rho _2}}}} \right) \cr & {h_3} = h + {h_2}\left( {1 - {{{\rho _1}} \over {{\rho _2}}}} \right) \cr & \ldots \ldots \ldots \cr & {h_n} = h + {h_{n - 1}}\left( {1 - {{{\rho _1}} \over {{\rho _2}}}} \right)\quad . \cr}$$
Dimension errors in different direction at various processing parameters: (a) in building direction; (b) in horizontal direction. Top R a and side R a using different processing parameters (c) and (d) the overlapping diagram of melt tracks.
The limit of h n when n reaches to infinity, which means many layers have been fabricated (normally more than ten layers):
 $$\mathop {\lim }\limits_{n \to \infty } {h_n} = \mathop {\lim }\limits_{n \to \infty } h{{1 - {{\left( {{{1 - {\rho _1}} \mathord{\left/ {\vphantom {{1 - {\rho _1}} {{\rho _2}}}} \right. \kern-\nulldelimiterspace} {{\rho _2}}}} \right)}^n}} \over {{{{\rho _1}} \mathord{\left/ {\vphantom {{{\rho _1}} {{\rho _2}}}} \right. \kern-\nulldelimiterspace} {{\rho _2}}}}} = h{{{\rho _2}} \over {{\rho _1}}}\quad .$$
Assume ρ1 = 4.4 g/cm3, ρ2 = 7.8 g/cm3, though calculating, the theoretical error in building direction is about 1.2%. By contrast, lower errors below 1.0% were obtained at all given processing parameters in this experiment. The volume expansion caused by martensite transformation during the solidification procedure is believed to be the major contributor. A revised equation on calculating the h n can be expressed as follows:
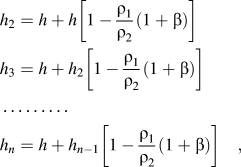 $$\eqalign{ & {h_2} = h + h\left[ {1 - {{{\rho _1}} \over {{\rho _2}}}\left( {1 + \beta } \right)} \right] \cr & {h_3} = h + {h_2}\left[ {1 - {{{\rho _1}} \over {{\rho _2}}}\left( {1 + \beta } \right)} \right] \cr & \ldots \ldots \ldots \cr & {h_n} = h + {h_{n - 1}}\left[ {1 - {{{\rho _1}} \over {{\rho _2}}}\left( {1 + \beta } \right)} \right]\quad , \cr}$$
where β is the coefficient of linear expansion of martensitic transformation in building direction. The limit of h n when n reaches to infinity:
 $$\mathop {\lim }\limits_{n \to \infty } {h_n} = \mathop {\lim }\limits_{n \to \infty } h{{1 - {{\left[ {1 - {{{\rho _1}} \over {{\rho _2}}}\left( {1 + \beta } \right)} \right]}^n}} \over {{{{\rho _1}} \over {{\rho _2}}}\left( {1 + \beta } \right)}} = h{{{\rho _2}} \over {{\rho _1}}}{1 \over {\left( {1 + \beta } \right)}}\quad .$$
Generally, complete martensitic transformation leads to a β of about 4% (Ref. Reference Liu, Wang, Liu, Zhu and Zhao24) and accordingly reduces the dimensional error in building direction.
The increase of errors in building direction with larger LEPUL shown in Fig. 8(a) can be explained by the variation of rheological behavior of the liquid. The shrinkage rate d(ΔL/L 0)/dt during SLM solidification can be evaluated byReference Zhu, Lu and Fuh14:
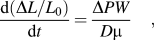 $${{{\rm{d}}\left( {{{{\rm{\Delta }}L} \mathord{\left/ {\vphantom {{{\rm{\Delta }}L} {{L_0}}}} \right. \kern-\nulldelimiterspace} {{L_0}}}} \right)} \over {{\rm{d}}t}} = {{{\rm{\Delta }}PW} \over {D\mu }}\quad ,$$
where ΔP is the capillary pressure, D the grain diameter, and W is the liquid thickness. Combining Eq. (5) with Eq. (19), it can be inferred that, when using an excessive LEUPL of 333.3 J/m, the relatively large error is mainly caused by the considerably low μ and less by the loss of powder material as already demonstrated before. As the LEUPL decreases to lower values (250, 200 J/m), the formation of more stable melting tracks with moderate rheological behavior reduces the error. As the smallest LEPUL of 166.7 J/m is used, even though the melting tracks are considerably instable, interestingly, the low density of SLM-processed part combined with a large μ can lead to the lowest error because of the smaller shrinkage degree of powder. Besides the shrinkage, there are other factors affecting the dimension accuracy in building direction, such as residual stresses, warping deformation.Reference Santos, Shiomi, Osakada and Laoui32 It is accordingly to conclude that suitably lowering the powder thickness is a reasonable method to improve the dimension accuracy in z-direction. Before SLM process, the laser scanning route was designed reasonably and an optimized spot compensation was given to offset the horizontal expansion of SLM parts, hence reducing the errors below 0.7% in horizontal direction [Fig. 8(b)].
The measured values of the top surface roughness (top R a) and side roughness (side R a) of SLM-processed parts are shown in Fig. 8(c). It could be found that the top R a and side R a varied with different scan speed v and attendant LEPUL; the side was generally rougher than the top surface. The melt pool surface contour above the substrate plate is approximately a circular curve due to surface tension forces exerting on the liquid surface, then each layer is successfully completed by a favoring lapping of adjacent melting tracks [Fig. 8(d)]. Consequently, the top surface roughness can be affected by a rippling effect caused by the instability of melt pool.Reference Alrbaey, Wimpenny, Tosi, Manning and Moroz33 According to previous study,Reference Wang, Yang, Yi and Su34R a refers to the arithmetic mean value of length from each point on the contour to the least squares midline in a sampling length. Thus, the position of the least squares midline must first be determined in which the value of  $\int_0^s {{{\left( {y - c} \right)}^2}{\rm{d}}x}$ is minimum. Then, the R a expression can be deduced by:
 $${R_{\rm{a}}} = {{\int_0^s {\left| {y - c} \right|{\rm{d}}x} } \over s} = {{{{\left( {{{{d^2}} \over {8h}} + {h \over 2}} \right)}^2}} \over {180s}}\left[ {90\,{{\cos }^{ - 1}}\left( {{{4sh} \over {{d^2} + 4{h^2}}}} \right) - \pi \,{{\sin }^{ - 1}}\left( {{{4sh} \over {{d^2} + 4{h^2}}}} \right)} \right] - {{\sqrt {{{\left( {{{{d^2}} \over {8h}} + {h \over 2}} \right)}^2} - {{{s^2}} \over 4}} } \over 4}\quad ,$$
where d is the width of melt track, s is the scan space. It can be seen that the top surface roughness are influenced simultaneously by the width of track d, scan space s, and the thickness of powder layer h. Therefore, when the s and h are fixed, the top R a is significantly affected by the width of melting track, which is mainly controlled by laser power and scan speed. Theoretically, there should be a critical LEPUL to make the R a minimum. In this experiment, the critical LEPUL was 250 J/m and the lowest top R a of 5.25 μm was obtained. In addition, the undesirable phenomena such as liquid droplets splashing, balling effect, and the discontinuity of melting tracks can also exert an effect on the top R a. From Fig. 8(c), it is found that there are two different critical values of LEPUL leading to the minimization of the side R a and the top R a, respectively. This is because, compared with the top R a, more factors affect the side R a and it is more complex to control. For example, during the SLM process, the side R a increases because of the adhesion phenomenon of the powder grains [Fig. 9(a)], which is generally aggravated with the energy input increasing. In addition, the scattering direction of balling is random and, metallic balls are likely to be scattered to either side of the melting track rather than settling on the top surface.Reference Mumtaz and Hopkinson35 So, the balling effect more dominantly influences the side R a of SLM-processed parts and, especially, the “periphery balling effect” [Fig. 9(a)] occurs when a 180° orientation change of scanning direction is conducted, which severely deteriorates the surface quality and significantly increases the side R a. In this experiment, the spot compensation L 2 was smaller than the radius of balling L 1 [Fig. 9(b)]. Thus, projecting balling at the edge of part could be clearly visible. Moreover, the tendency of “periphery balling effect” is likely to increase with the enhancement of temperature gradient between the unmelted powder and the melt pool,Reference Gu and Shen36 which could be the reason why the dimension errors in horizontal direction increase as the LEPUL gets larger.
(a) FE-SEM showing the “periphery balling effect” caused by 180° orientation change of scanning direction and the powder adhesion phenomenon at a LEPUL of 250.0 J/m; (b) schematic diagram showing the morphology of the edge of SLM-processed part using orthogonal scanning manner.
D. Hardness and wear performance
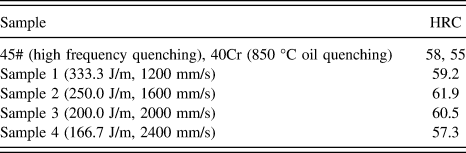
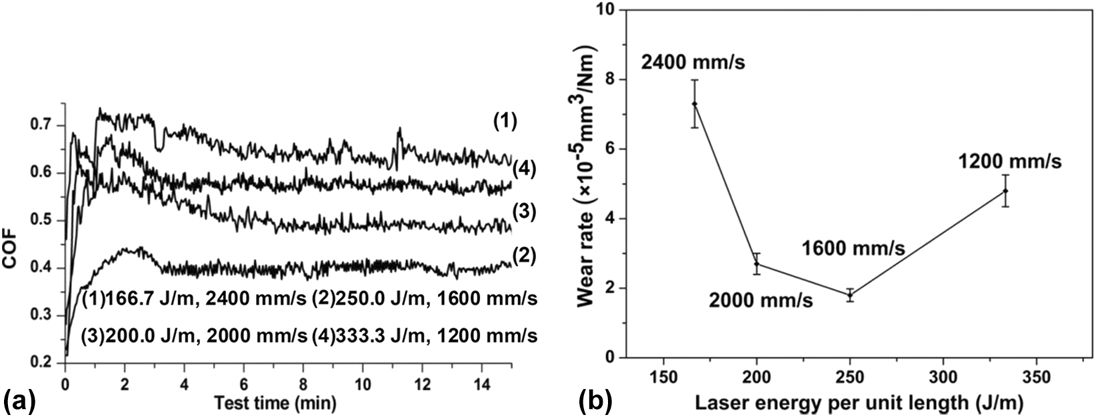
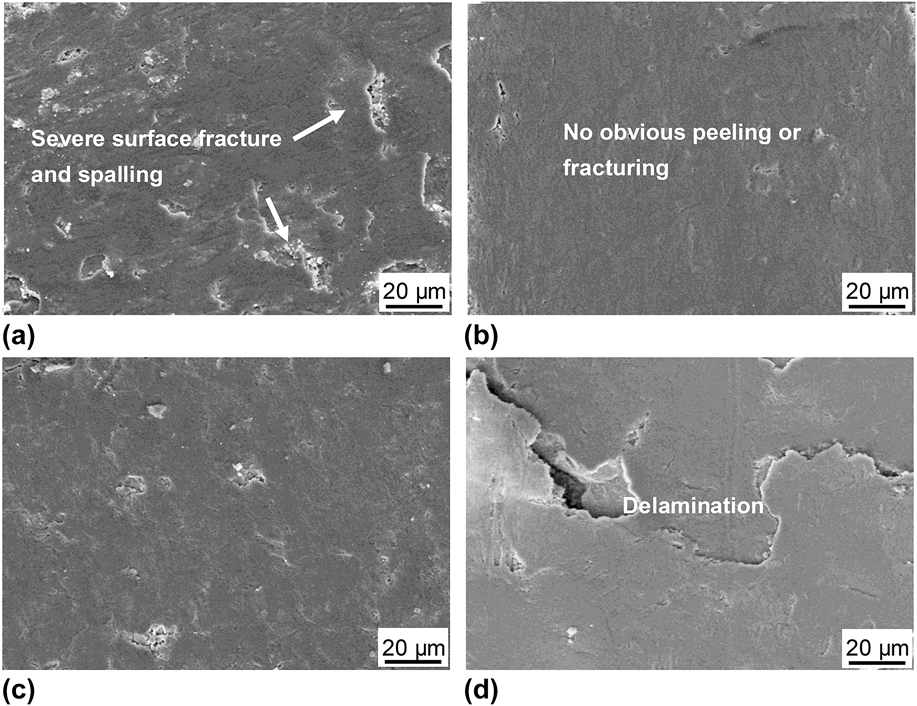
Table III depicts the Rockwell hardness measured on the cross-sections of SLM-processed parts and indicates a higher HRC compared with traditional hardened steel.Reference Murali, Chatterjee, Saha, Palai, Kumar, Roy, Mishra and Roy Choudhury37Figure 10 illustrates the effect of processing parameters on COFs and wear rates of SLM-processed parts. The width of worn tracks under various processing parameters is given in Fig. 11. From the results above, it can be concluded that the hardness and wear resistance show a high response to the densification level and the content of retained austenite. Poor densification rate is associated with premature failure which is always initiated in cracks and residual pores and the content of retained austenite is generally inversely proportional to the hardness and wear performance. Therefore, The part processed at 250 J/m with a high densification level and low content of retained austenite exhibited the optimal wear property with a smallest track width of 165 μm, a lowest mean friction coefficient of 0.40, and the attendant lowest wear rate of 1.8 × 10⁻⁵ mm3/N m. Detailed SEM studies of the corresponding morphologies of worn surfaces are characterized in Fig. 12 to reveal the microstructural features accounting for the wear properties. At a low v of 1200 mm/s and attendant high LEPUL of 333.3 J/m, the severe surface fracture and fragment of the flake layer could be observed, revealing the heavy brittle deformation and peeling of the surface during sliding [Fig. 12(a)]. As the v increased to 1600 J/m, the worn surface became significantly smooth and wear debris almost disappeared [Fig. 12(b)]. As the counterface ball continuously slid against the surface with hardly any defects, amounts of plastic deformation occurred, hence causing lots of dislocation movements within the crystal structure of the material. At the same time, due to the microstructure refinement caused by elevated kinetic undercooling and attendant solidification rate, more grain boundaries were available to promote the dislocation pile-up effect. So, the mechanical properties of the SLM-processed parts were considerably improved by self-strengthening mechanism, hence showing no peeling or fracturing of the sliding surface in the sliding-treated layer. Using a higher v of 2000 mm/s was inclined to aggravate the brittleness and result in the occurrence of the surface spalling [Fig. 12(c)], due to the reduction of densification level and as the LEPUL further decreased to 166.7 J/m, severe delamination phenomenon was observed on the worn surface [Fig. 12(d)]. The deep cracks are believed to be caused by the large residual stresses when a high v is used and, the spalling of tribolayer is always initiated in cracks and irregularly shaped micropores,Reference Sun, Moroz and Alrbaey38 hence signally lowering the wear performance of the SLM-processed part.
Hardness of SLM-processed parts using different processing parameters.
COF values (a) and wear rates (b) of SLM-processed parts with variation of processing parameters.
The width of worn tracks under various processing parameters: (a) 333.3 J/m, 1200 mm/s; (b) 250.0 J/m, 1600 mm/s; (c) 200.0 J/m, 2000 mm/s; (d) 166.7 J/m, 2400 mm/s.
FE-SEM images showing characteristic morphologies of worn surfaces of SLM-processed parts using various processing parameters: (a) 333.3 J/m, 1200 mm/s; (b) 250.0 J/m, 1600 mm/s; (c) 200.0 J/m, 2000 mm/s; (d) 166.7 J/m, 2400 mm/s.
IV. CONCLUSIONS
(1) The metallurgical defect and according densification level of SLM-parts were significantly influenced by the scan speed v and attendant LEPUL. Excessive laser energy input (1200 mm/s, 333.3 J/m) resulted in the interlayer micropores and restricted the densification level. A lower LEPUL of 200.0 J/m led to round and subround pores and, near full dense SLM parts still could not be obtained. Using the lowest LEPUL of 166.7 J/m was inclined to cause large irregularly shaped pores and decreased the densification rate. The highest densification rate (99.24% TD) was achieved when an optimal LEPUL of 250.0 J/m was settled properly.
(2) The large cooling rate induced by high-speed laser led to the martensitic transformation of the SLM parts. Alloying elements such as Cr, Mo, and Si ensured the successful process of martensite transformation. The content of retained austenite varied with different applied laser scan speeds and when the scan speed was settled at 1600 mm/s, only 3.5% retained austenite was obtained.
(3) The dimensional accuracy in building direction was reduced below 1.0% with the help of the volume expansion offsetting the shrinkage of powder materials due to the martensitic transformation. The errors in horizontal direction could be controlled below 0.7% by setting suitable spot compensation when an orthogonal scanning pattern was used. The side of SLM part was generally rougher than the top surface. Comprehensively considering the top-side roughness optimization, as the v settled at 1600 mm/s, the lowest top R a (5.25 μm) and reduced side R a (13.84 μm) were achieved.
(4) Both the insufficient densification and excessive retained austenite resulted in limited hardness and wear performance. The optimally prepared SLM parts had a high Rockwell hardness of 61.9 HRC, a small worn track width of 165 μm, a low mean friction coefficient of 0.40 and attendant lowest wear rate of 1.8 × 10⁻⁵ mm3/N m.
ACKNOWLEDGMENTS
The authors gratefully acknowledge the financial support from the National Natural Science Foundation of China (Nos. 51575267 and 51322509), the Top-Notch Young Talents Program of China, the Outstanding Youth Foundation of Jiangsu Province of China (No. BK20130035), the Program for New Century Excellent Talents in University (No. NCET-13 -0854), the Science and Technology Support Program (The Industrial Part), the Jiangsu Provincial Department of Science and Technology of China (No. BE2014009-2), the 333 Project (No. BRA2015368), the Aeronautical Science Foundation of China (No. 2015ZE52051), the Shanghai Aerospace Science and Technology Innovation Fund (No. SAST2015053), the Fundamental Research Funds for the Central Universities (Nos. NE2013103, NP2015206 and NZ2016108), and the Priority Academic Program Development of Jiangsu Higher Education Institutions.