1 Introduction
Support Vector Machines (SVM) is a supervised machine learning algorithm, which has achieved state-of-the-art performance on many learning tasks. In particular, SVM is a popular learning algorithm for Natural Language Processing (NLP) tasks such as POS (Part-of-speech) tagging (Nakagawa, Kudoh and Matsumoto Reference Nakagawa, Kudoh and Matsumoto2001; Gimenez and Marquez Reference Gimenez and Marquez2003), word sense disambiguation (Lee, Ng, and Chia Reference Lee, Ng and Chia2004), NP (noun phrase) chunking (Kudo and Matsumoto Reference Kudo and Matsumoto2000), information extraction (Isozaki and Kazawa Reference Isozaki and Kazawa2002; Li, Bontcheva and Cunningham Reference Li, Bontcheva, Cunningham, Niranjan, Winkler and Lawerence2005a), relation extraction (Zhou et al. Reference Zhou, Su, Zhang and Zhang2005), semantic role labelling (Hacioglu et al. Reference Hacioglu, Pradhan, Ward, Martin and Jurafsky2004), and dependency analysis (Kudoh and Matsumoto Reference Kudoh and Matsumoto2000; Yamada and Matsumoto Reference Yamada and Matsumoto2003). Almost all these applications adopt the same steps: first they transform the problem into a multi-class classification task; then convert the multi-class problem into several binary classification problems using e.g. one-vs-all or one-vs-another approach (the two approaches will be explained in detail in Section 2); then an SVM classifier is trained for each binary classification task; and finally, the classifiers' results are combined to obtain the solution to the original NLP problem.
Actually SVM has also been formulated as a multi-class classifier in various forms (see e.g. Crammer and Singer Reference Crammer and Singer2001), and obtained encouraging results for some applications including several NLP problems (see e.g. Tsochantaridis et al. Reference Tsochantaridis, Hofmann, Joachims and Altun2004), where multi-class SVM obtained better results than the binary model. However, although multi-class SVMs are a promising research area, their implementation is more complicated than the binary one. Moreover, (Hsu and Lin Reference Hsu and Lin2002) compared the binary SVM with one form of multi-class SVM presented in (Crammer and Singer Reference Crammer and Singer2001) on several standard machine learning data sets and their results showed no significant difference in performance between the two. (Rifkin and Klautu Reference Rifkin and Klautu2004) also compared the three schemes used for multi-class problems: converting to binary SVM classifications using one-vs- all or one- vs-another methods, complex error-correcting coding scheme and single multi-class machine scheme. They observed that when using an effective binary classifier such as SVM, a simple scheme like one-vs-all or one-vs-another is preferable to other, more complex approaches. Therefore, this paper only considers the binary SVM classifier.
When compared to other ML classification problems, NLP classification tasks have several unique characteristics which should be taken into consideration when applying machine learning algorithms. Perhaps the most important one is that NLP tasks tend to have imbalanced training data, in which positive examples are vastly outnumbered by negative ones. This is particularly true for smaller data sets where often there are thousands of negative training examples and only few positive ones. Another unique characteristic is that annotating text for training the algorithm is a time-consuming process, while at the same time unlabelled data is abundant.
Therefore, when SVMs are applied to NLP tasks, these particular aspects should be taken into account, in order to obtain a practical system with good performance. The novel contribution of this paper is in investigating two techniques for making SVM more suitable for language learning tasks. Firstly, we propose an SVM with uneven margins (SVMUM) model to deal with the problem of imbalanced training data. Secondly, SVM active learning is employed in order to alleviate the difficulty in obtaining labelled training data. The algorithms are presented and tested on several Information Extraction (IE) tasks, however we believe that they could also improve SVM performance on other NLP tasks.
In comparison to other methods which transform the training data (e.g. subsampling or oversampling, see Section 3), we adapt the learning algorithm itself to deal with the imbalanced data. As we will show in Section 6, this method is more effective. On the other hand, in comparison to other modified SVM algorithms, such as the multi-class SVM for imbalanced data and the transductive SVM for exploiting unlabelled data (see e.g. Collobert et al. Reference Collobert, Sinz, Weston and Bottou2006), our SVMUM and active learning approaches are simple and efficient, because our methods just need to solve the standard binary SVM and use some simple transformations, while both multi-class SVM and transductive SVM need to implement and solve some new and more complex optimisation problems. Hence our methods are both effective and efficient, as is necessary for real-world applications which may have hundreds of classes and millions of instances.
The rest of the paper is structured as follows. Section 2 discusses SVM learning for NLP tasks. Section 3 focuses on imbalanced data and the SVMUM algorithm. Section 4 presents the token based classification framework in which SVM classifiers are used to solve IE tasks, and compares the applicabilities of several different entity tagging schemes used within the framework. Section 5 discusses SVM active learning in the context of IE tasks. Section 6 evaluates the algorithms on three benchmark corpora for IE, with a particular emphasis on measuring the usefulness of active learning. In the end Section 7 summarizes our findings and presents some discussions.
2 SVM learning for NLP
SVM has been used widely in a variety of NLP problems. In most cases an NLP problem is represented as a multi-class classification problem, which is then decomposed into a number of binary classification tasks, with an SVM classifier trained for each of them. Simple methods, such as one-vs-all and one-vs-another methods, are commonly used for the multi-class to binary classification conversion and they have been shown as preferable to other complex error-correcting coding schemes or single multi-class SVMs (Rifkin and Klautu Reference Rifkin and Klautu2004). The one-vs-all method converts a n-class classification problem into n binary classifications – the i binary classification problem has the examples belonging to the class i as positive examples and the examples belonging to all other classes as negative examples. In contrast, the one-vs-another method converts a n-class classification problem into n(n−1)/2 binary classifications – given two classes i and j (1 ≤ i < j ≤ n), one binary classification has the example belonging to class i as positive examples and those examples of class j as negative examples.
SVM is an optimal classifier in the sense that, given training data, it learns a classification hyperplane in the feature space, which has the maximal distance (or margin) to all training examples (except a small number of outliers) (see e.g. Cristianini and Shawe-Taylor Reference Cristianini and Shawe-Taylor2000). We can regard the margin from the training examples to the classification hyperplane as a measure of tolerance of the classification model to discrepancies between the training and test data, i.e. the bigger the margin, the more tolerance the model is likely to have. Hence, intuitively, the large margin of the SVM solution makes the classification robust with respect to perturbations of the data points (Chapelle et al. Reference Chapelle, Weston, Bottou and Vapnik2000). There are also theoretical arguments for the maximal margin principle. One is based on the VC dimension and structural risk minimization principle – by maximizing the margin we minimize the VC dimension which leads to less structural risk and better generalisation (Vapnik Reference Vapnik1998). Actually there are also theoretical results specifying the bounds of generalisation capabilities for maximal margin learning algorithms such as SVM (see e.g. Shawe-Taylor and Cristianini Reference Shawe-Taylor and Cristianini1999; Cristianini and Shawe-Taylor Reference Cristianini and Shawe-Taylor2000), which also demonstrate the good generalisation capabilities of the SVM algorithm. Consequently, on classification tasks SVM tends to have better generalisation capabilities on unseen data than other distance- or similarity-based learning algorithms such as k-nearest neighbor (kNN) or decision trees.
Another SVM property is that it can explore different combinations of the given features using different types of kernel functions. It can be done by either using the common kernel functions (e.g. polynomial kernel or Gaussian kernel Cristianini and Shawe-Taylor Reference Cristianini and Shawe-Taylor2000) or by constructing a feature space explicitly exploring the features and the relations among them (Cumby and Roth Reference Cumby and Roth2003). In contrast, it would be difficult for many other learning algorithms to deal efficiently with a huge number of feature combinations.
Specifically in the case of NLP tasks, instances are typically represented by very high dimensional but sparse feature vectors, which may lead to positive and negative examples being distributed into two distinctly separate areas of the feature space. This is particularly helpful for SVM's search for a classification hyperplane and also for its generalisation capability. In fact, this is the main reason why SVMs can achieve very good results on a variety of NLP tasks. It also explains the fact that in many cases the linear kernel tends to obtain similar performance to more complicated kernels (note that the linear kernel is much more computationally efficient than other kernel functions). Such a high dimensional representation is achieved by forming the feature vector explicitly from text using a large number of linguistic features and in some cases by using the kernel functions or by explicitly exploring the combinations of features to map the feature vector into even higher dimensional space.
Furthermore, as SVM is an optimal margin classifier, the distance of an example to the SVM classification hyperplane indicates how important the example is, i.e. the examples close to the SVM hyperplane are crucial for improving the learnt SVM model. Consequently, SVM active learning is based on the distance of unlabelled examples to the SVM hyperplane (see Section 5 for detailed explanations).
3 Imbalanced training data and SVMUM
As already discussed in Section 1, NLP classification problems usually have imbalanced training data, which is particularly true for smaller data sets where often there are thousands of negative training examples and only few positive ones. On the other hand, due to the high annotation costs, small training corpora are used frequently in some applications such as mixed-initiative text annotation (Day et al. Reference Day, Aberdeen, Hirschman, Kozierok, Robinson and Vilain1997) and adaptive IE (Ciravegna et al. Reference Ciravegna, Dingli, Petrelli and Wilks2002).
Two approaches have been studied so far to deal with imbalanced data for IE tasks. The first one undersamples the majority class or oversamples the minority class in order to obtain a relatively balanced training data (Zhang and Mani Reference Zhang and Mani2003). However, undersampling can potentially remove certain important examples and oversampling can lead to overfitting and a larger training set. The second approach is to divide the problem into several subproblems in two layers, each of which has less imbalanced training set than the original one (Carreras, Màrquez, and Padr Reference Carreras, Màrquez and Padró2003; Sitter and Daelemans Reference Sitter and Daelemans2003). The output of the classifier in the first layer is used as the input to the classifiers in the second layer. As a result, this approach needs more classifiers than the original problem. Moreover, the classification errors in the first layer will affect the performance of the second one. (Gimenez and Marquez Reference Gimenez and Marquez2003) constructs training data from a dictionary extracted from the training corpus rather than training on the corpus itself. This eliminated many negative examples and is similar to the undersampling method (see e.g. Zhang and Mani Reference Zhang and Mani2003). Kudoh and Matsumoto (Reference Kudoh and Matsumoto2000) used pairwise classification which trains a classifier for each pair of classes. In pairwise classification the negative and positive examples are drawn respectively from only two classes, so the training data would be much less imbalanced than in the general multi-class case.
A different approach to handling the imbalanced data in IE is investigated here: namely, modifying the SVM learning algorithm for balanced classification to deal better with the imbalanced data.
In comparison to the other methods discussed above, our approach to dealing with imbalanced training data is simpler, as it modifies the learning algorithm itself and thus does not require special processing of the training data or pairwise classification.
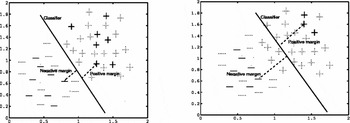
As discussed in Section 2, a binary SVM classifier corresponds to a hyperplane in feature space with maximal margin, which separates the positive and negative training examples. The margin can be regarded as a measure of the error-tolerance ability of the classifier, since a classifier is more likely to classify a test instance correctly if it has a larger margin. In general, if a training set is representative of the whole data set, a classifier with a larger margin with respect to the training set would have a better generalisation performance. However, if the training set is unrepresentative, then a maximal margin classifier (such as SVM) learnt from an unrepresentative training set may have poor generalisation performance, as illustrated in Figure 1. Unfortunately, many imbalanced classification problems, such as those arising in IE, have only a small number of positive training examples, resulting in an SVM classifier with poor generalisation capability. As a matter of fact, previous work has demonstrated that SVM classifiers trained on imbalanced training data have poor generalisation performance (see e.g. Lewis et al. Reference Lewis, Yang, Rose and Li2004; Li and Shawe-Taylor Reference Li and Shawe-Taylor2003).
An illustrative two-dimensional classification problem and two SVM classifiers. The two graphs illustrate two different kinds of training sets. The training set on the left is representative of the whole data set, whereas the positive examples in the training set on the right are not. In both figures a ‘+’ represents a positive example and a ‘−’ for a negative example. The solid line ‘+’ and ‘−’ are the training examples and those with dashed lines are the test ones.

Figure 1 shows a simple two-dimensional binary classification problem together with two kinds of training sets and the corresponding SVM classifiers. The training examples in the left part of Figure 1 are representative of the whole data set, and therefore the maximal margin classifier learned from the training set can classify correctly most of the unseen test data, meaning that the SVM classifier has a good generalisation capability. In contrast, the right graph illustrates a situation where the training set is not representative of the distribution of all positive examples due to the very small number of available training examples (only three). In this case, the SVM classifier with maximal margin would mistakenly classify many unseen positive examples as negative ones. In other words, the imbalanced training data containing few positive examples causes the class distribution changes between training and testing data, which leads to poor performance of the SVM model on the testing data.
However, as can be seen in Figure 1, if the classification hyperplane could be moved away from the positive training examples in the imbalanced data set, then the classifier would classify more unseen data correctly, i.e. it would have better generalisation performance. Therefore, if an SVM classifier has to be learnt from an imbalanced training set which has only a few positive examples, it may be beneficial to require the learning algorithm to set the margin with respect to the positive examples (the positive margin) to be somewhat larger than the margin with respect to the negative examples (the negative margin). In other words, in order to achieve better generalisation performance, one needs to distinguish the positive margin from the negative margin when training the SVM. Therefore, we introduced a margin parameter τ into the SVM optimisation problem to control the ratio of the positive margin over the negative margin (for details see Li and Shawe-Taylor Reference Li and Shawe-Taylor2003).
Formally, given a training set Z = ((x1, y 1),. . ., (xm, y m)), where xi is the n-dimensional input vector and y i (= +1 or −1) its label, SVMUM is obtained by solving the quadratic optimisation problem:
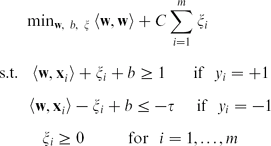
where a parameter τ was added to the constraints of the optimisation problem for the standard SVM formation. τ is the ratio of negative margin to the positive margin of the classifier. It is equal to 1 in the standard SVM, which treats positive and negative examples equally. However, as argued above, for imbalanced training data, a larger positive margin than negative one (namely τ < 1) would be beneficial for the generalisation capability of the SVM classifier.
When applying SVMUM to a problem, we first have to determine a value for the uneven margins parameter τ. If the problem has just a few positive training examples and many negative ones, then τ < 1 would be helpful. However, the optimal value of τ is not entirely dependent upon the number of positive examples in the training set – instead it is actually dependent upon the distribution of positive training examples among all positive examples. Like other parameters of learning algorithms, the value of τ can be determined empirically, for example, by n-fold cross-validation on the training set or using a hold-out development set. On the other hand, the experimental results presented in (Li et al. Reference Li, Bontcheva, Cunningham, Niranjan, Winkler and Lawerence2005a) show that the performance of SVMUM is not sensitive with respect to the value of the uneven margins parameter, probably because the SVM classifier was learned in a very high dimensional space where the positive training examples may possibly be far away from the negative ones. Therefore, a reasonable estimation of τ is able to help the SVMUM to achieve significantly better results than the standard SVM model (see Section 6).
As shown in (Li and Shawe-Taylor Reference Li and Shawe-Taylor2003), for the SVM model with bias term, the solution of SVMUM can be obtained from a related standard SVM via a transformation:

where {w1*, b 1*} is the SVM model for the standard SVM with cost factor C for some training data, and {w 2*, b2*} is the SVM model for the SVM with uneven margin τ and cost factor C τ = (1+τ)/(2*C) for the same training data (for details see Li and Shawe-Taylor Reference Li and Shawe-Taylor2003). The transformation is simple – basically it amounts to adding a τ-related term to the bias term b of the corresponding standard SVM model. Therefore, in order to achieve computational gains, the SVMUM problem is not solved directly. Instead, a corresponding standard SVM problem is solved first by using an existing SVM implementation, (e.g. a publicly available SVM packageFootnote 2), and then the solution of SVMUM is obtained through a transformation.
On the other hand, the transformation means that the SVMUM is the same as the standard SVM except for a shift of bias term or equivalently, a shift of SVM's output before thresholding. Note that in our experiments we use the same value for the uneven margin parameter for all computed SVM classifiers. Hence all classifier outputs have the same amount of shift with respect to the uneven margin parameter.
3.1 Other SVM methods for handling imbalanced data
Previous work has shown that SVM learning obtains poor results on imbalanced training data (see e.g. Lewis et al. Reference Lewis, Yang, Rose and Li2004) and several techniques have been proposed to alleviate this problem. The first one is presented in (Morik, Brockhausen and Joachims Reference Morik, Brockhausen and Joachims1999), which differentiates the cost factor (C) in the SVM's optimal problem between the positive training examples (as C +) and the negative ones (as C −) and compensates the smaller number of positive (or negative) examples by setting a higher cost value for them. This approach is implemented in the SVMlight package (Joachims Reference Joachims, Schölkopf, Burges and Smola1999a), where an optional parameter j(= C +/C −) is provided to control different weightings of training errors on positive examples to errors on negative examples. Consequently, we refer to this method as the cost weighting method.
Lewis et al. (Reference Lewis, Yang, Rose and Li2004) proposes another method for improving SVM performance on very imbalanced data, based on the observation that SVM learning often chooses a poor threshold (namely bias term) when the numbers of positive examples and negative examples are very different. Hence the paper suggests that, after training the SVM, the bias term b of the classifier should be replaced by a better one, which is obtained by a threshold selection strategy called Scut (Yang Reference Yang2001). The experiments in Lewis et al. (Reference Lewis, Yang, Rose and Li2004) and Li and Shawe-Taylor (Reference Li and Shawe-Taylor2003) show that Scut achieves better performance than the cost weighting method implemented in SVM light.
As discussed above, the SVMUM approach amounts to shifting the bias term b. Hence, in theory it is equivalent to Scut, when one regards the latter as a heuristic method for estimating the uneven margins parameter τ. On the other hand, the parameter τ (i.e. the ratio of the negative margin to the positive one) is easier to understand than the bias term. For instance, given a classification problem with only a few positive training examples but many negative ones, we know that a small value of the margin parameter (between 0 and 1) for negative training examples should be used in SVMUM, as we know that the margin for positive training examples is fixed as 1. However it is much harder to determine what is a suitable value of the SVM bias (as needed by Scut), because the SVM bias b can be any positive or negative real number. Therefore, while SVMUM is theoretically equivalent to ScutFootnote 3, in practice, SVMUM is better, because it is easier to find an (sub-)optimal value for the uneven margins parameter than for the bias term. This has also been backed by the experimental results where SVMUM outperforms Scut on some imbalanced data sets (see Li and Shawe-Taylor Reference Li and Shawe-Taylor2003).
In addition, it has been shown that SVM without the bias term is more useful than SVM with bias term on some problems like adaptive document filtering (see e.g. Cancedda et al. Reference Cancedda, Cesa-Bianchi, Conconi, Gentile, Goutte, Graepel, Li, Renders, Shawe-Taylor, Voorhees and Buckland2003). While one can introduce an uneven margins parameter into the SVM without bias term to make it handle imbalanced data better, it is not possible to use the Scut technique for the SVM without bias term, because the Scut method adjusts the bias term.
As discussed above, both SVMUM and Scut achieve better performance than the cost weighting method. This improvement can be explained in terms of the restrictions these different approaches put on the learning algorithms. Firstly, as illustrated above, when there are only a few positive training examples, they tend to be unrepresentative of all positive examples and therefore moving the SVM hyperplane away from the positive training examples would tend to improve the generalisation capability of the SVM model. One way to achieve this is by adjusting the uneven margins parameter (or equivalently the bias term). In contrast, in the case of the 1-norm soft margin formulation of the SVM which is used in most applications, the cost weighting method amounts to using a larger cost parameter C +, which is the upper bound of the dual form variable αi for one positive training example x i (for details see Cristianini and Shawe-Taylor Reference Cristianini and Shawe-Taylor2000). From the SVM margin's point of view, the cost weighting method tries to increase the margin of the positive training examples in an indirect fashion by increasing the upper bound of their dual form variables. So while increasing the value of αi would certainly increase the margin of the corresponding example x i, increasing the upper bound of αi would not necessarily result in a bigger value of αi, because αi is determined by solving the quadratic optimisation problem which has many other constraints besides the upper bound. In our opinion, this is the reason why the cost weighting method is not as effective as the uneven margins model and Scut when dealing with imbalanced training data.
4 SVM-based information extraction
IE analyses documents in order to extract useful snippets of information. The process takes texts (and sometimes speech) as input and produces fixed-format, unambiguous data as output. For example, events, entities or relations can be extracted automatically from text such as newswire articles or web pages. IE is useful in many applications, such as business intelligence, automatic annotations of web pages for Semantic web, and knowledge management.
A wide range of machine learning techniques have been used for IE and achieved state-of-the-art results, comparable to manually engineered IE systems. The learning approaches to IE can be classified broadly into two main categories: rule learning and statistical learning. The former methods induce a set of rules from training examples, e.g. SRV (Freitag Reference Freitag1998), RAPIER (Cali. Reference Califf1998), WHISK (Soderland Reference Soderland1999), BWI (Freitag and Kushmerick Reference Freitag and Kushmerick2000), and (LP)2 (Ciravegna Reference Ciravegna2001). Statistical systems learn a statistical models or classifiers, such as HMMs (Freigtag and McCallum Reference Freigtag and McCallum1999), Maximal Entropy (Chieu and Ng Reference Chieu and Ng2002a), SVM (Isozaki and Kazawa Reference Isozaki and Kazawa2002; Mayfield, McNamee and Piatko Reference Mayfield, McNamee and Piatko2003; Li et al. Reference Li, Bontcheva, Cunningham, Niranjan, Winkler and Lawerence2005a) and Perceptron (Carreras et al. Reference Carreras, Màrquez and Padró2003; Li, Bontcheva and Cunningham Reference Li, Bontcheva and Cunningham2005b).
IE systems also differ from each other in the NLP features that they use. These include simple features such as token string (namely the token itself) and capitalisation information, linguistic features such as part-of-speech, semantic information from gazetteer lists and genre-specific information such as document structure.
The SVM-based IE approach adopted in this work consists of three stages: linguistic pre-processing to obtain the feature vectors, training or applying classifiers and finally post-processing the results to tag the documents.
4.1 Linguistic pre-processing
The aim of the pre-processing is to form input vectors from documents. Each document is first processed using the open-source ANNIE system, which is a part of the GATE NLP toolsetFootnote 4 (Cunningham et al. Reference Cunningham, Maynard, Bontcheva and Tablan2002). This produces a number of linguistic features, including capitalisation information, token types (namely word, number, punctuation), lemma, part-of-speech (POS) tag, semantic classes from gazetteers and named entity types according to ANNIE's rule-based recogniser.
On the basis of this linguistic information, an input vector is constructed for each token, and a label that indicates whether or not the token is in one particular part of an entity (e.g. the beginning or last token of an entity) is associated with each vector. Since in IE the context of the token is usually as important as the token itself, the features in the input vector come not only from the target token, but also from the preceding and following ones. As the input vector incorporates information from the context surrounding the target token, features from the different tokens can be weighted differently, based on their position in the context. The weighting scheme we use is the reciprocal scheme, which weights the surrounding tokens reciprocally to the distance to the token in the centre of the context windowFootnote 5. In detail, it assigns weight 1 to the features from the target token and the immediate neighboring tokens and weight 1/(n+1) to the features of the tokens which are n tokens away from the target (central) token. This reflects the intuition that the nearer a neighboring token is, the more important it is for classifying the given token. Our experiments showed that such a weighting scheme obtained better results (by 0.5%–1% F-measure) than the commonly used equal weighting of features in four of the six experiments on three benchmarking data sets (Li et al. Reference Li, Bontcheva, Cunningham, Niranjan, Winkler and Lawerence2005a).
4.2 Token-based classification framework for IE
The key to this approach is to convert the recognition of entities into a token classification problem. For each token, we decide whether the token is at the start or end of an entity, and what type of entity is being started or ended. This multi-class classification problem is then solved by decomposing it into a number of binary classification tasks using the one-vs-all method.
In contrast, previous work has adopted different approaches to formulating the IE problem as a classification task. For example, some IE systems (see. e.g. Roth and Yih Reference Roth and Yih2001) were not based on tokens. Instead they treated a sequence of words as the entity target. Since it is not possible to know in advance the expected word length of each entity, one may have to test word sequences with increasing spans (up to a pre-defined maximum), which may result in much more instances than those considered by a token-based framework. To deal with this problem, the IE system described in (Roth and Yih Reference Roth and Yih2001) applied a two-stage architecture. The first stage employed some classifiers to filter out those fragements that were unlikely to be entities. A relatively small number of fragements in one document survived after the first stage. The second stage applied the multi-class classifier SNoW to determine whether or not a fragement that survived from the first stage was an entity and, if it was, the type of the entity. As pointed out in Section 3, the major concerns with the two-stage architecture are that it needs more classifiers than the original problem and the errors in the first stage will affect the performance of the second one. The named entity tagging system described in (Cumby and Roth Reference Cumby and Roth2003) avoided the problem of too many instances by making the assumption that only NP chunks can be training and testing instances for named entity recognition, which constrains the number of instances. However, this requires reliable NP chunk recognition to pre-process the input text first and assumes that each named entity is an NP chunk, which affects overall performance and may not be applicable to all IE tasks.
There are a number of other approaches for converting multi-word entities into a number of token-based binary classification problems. One type of tagging scheme assigns tag to every token in document. For example, the BIO tagging scheme assigns X-B to the beginning token of an entity belonging to type X, assigns X-I to the other tokens inside the entity, and assigns O to those tokens not belonging to any entities considered (see Tjong Kim Sang and Meulder Reference Tjong Kim Sang and Meulder2003). Another similar scheme is the BIOLU tagging scheme. The BIOLU scheme assigns X-U to the token of a single-token entity of type X; X-B and X-L respectively to the beginning and last tokens; X-I to inside tokens; and O to tokens not belonging to any entity. Isozaki and Kazawa (Reference Isozaki and Kazawa2002) adopted the BIOLU scheme. They trained four SVM classifiers for each entity type – besides the two SVMs for start and end(like ours), also one for middle tokens, and one for single token entities. They also trained an SVM classifier for non-entity tokens. Other tagging schemes assigns tags only to some tokens in the text. One such example is the BL scheme (which we use) which assigns X-B to the starting token of an entity of type X and X-L to the last token. Single-token entities get two tags: X-B and X-L. Yet another approach is to train an SVM classifier for every possible transition of tags (Mayfield et al. Reference Mayfield, McNamee and Piatko2003). Depending on the number of entities, this approach may result in a large number of classifiers.
Overall, in comparison, the BL scheme has the smallest number of tags than all other schemes, thus requiring fewer classifiers to be trained and consequently being computationally more efficient. Moreover, intuitively the boundary tokens are more characteristic than the middle tokens in an entity, because the boundary tokens not only represent part of the content of the entity, but they also act as delimiters, which in many cases makes them easier to recognise than the inside tokens. Therefore our conjecture was that overall the BL scheme would be more efficient and effective for IE tasks. Section 6 below presents our experimental comparison of the three tagging schemes, which justifies these conclusions.
On the other hand, since both the BIO scheme and BIOLU scheme have a tag for each token, it is possible to employ post-processing techniques such as the Viterbi search algorithm (Jelinek Reference Jelinek1997), in order to select the most suitable tag for each token, based on the confidence scores of the surrounding tags and the tag probabilities. IE approaches based on the BL scheme, however, cannot use the Viterbi algorithm to combine the B and L classifier results, because the Viterbi algorithm needs a tag for each token (a tag in our case corresponds to one hidden state in the Hidden Markov Model for applying the Viterbi algorithm) but many tokens (namely those tokens belonging to non-entity and also those tokens in the middle of an entity) do not have tags according to the BL scheme. Instead, we had to implement a different post-processing procedure, which is explained next.
4.3 Post-processing
As discussed above, after classification, the start and end tags of the entities are obtained and need to be combined into a single entity tag. Therefore some post-processing is needed to guarantee tag consistency and to try to improve the results by exploring other information. The currently implemented post-processing procedure has three stages. First, in order to guarantee the consistency of the recognition results, for each entity type, the document is scanned from left to right to remove beginning tags not immediately followed by an end tag and vice versa. The second stage filters out candidate entities from the output of the first stage, based on their length (see also Freitag and Kushmerick Reference Freitag and Kushmerick2000). In detail, a candidate entity tag is removed if the entity's length (i.e. the number of tokens) is not equal to a length encountered in the training set for this type of entity. The third stage compares all possible entity types for a sequence of tokens and chooses the type which has the highest confidence score among all of them. This confidence score is calculated as the multiplication of the confidence scoresFootnote 6 of the beginning and end tokens.
5 SVM active learning for IE
As discussed in the introduction, in addition to the problem with imbalanced training data, there is also the challenge of obtaining sufficient training data for IE, due to the complexity of the annotation task. One way to overcome this problem is to use active learning which minimises the number of labelled examples required to achieve a given level of performance. It is usually implemented as a module in the learning system, which selects an unlabelled example based on its properties and/or the current model. Then the system asks the user to label the selected example, adds it to the training set, and updates the model accordingly. Active learning is particularly useful in IE, where there is an abundance of unlabelled text, among which only the most informative instances need to be found and annotated. Another approach for exploiting unlabelled data is the transductive SVM (see Joachims Reference Joachims1999b; Collobert et al. Reference Collobert, Sinz, Weston and Bottou2006), however in this paper we focus on SVM active learning.
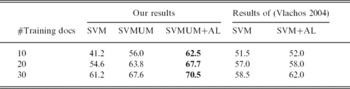
SVM active learning is an SVM-specific algorithm (Campbell, Cristianini, and Smola Reference Campbell, Cristianini and Smola2000; Schohn and Cohn Reference Schohn and Cohn2000), which uses the margin (or the distance) from the unlabelled example to the classification hyperplane as a measure of the example's importance for learning. This type of active learning has been applied successfully already for text classification (Tong and Koller Reference Tong and Koller2001), spoken language understanding (Tur, Schapire, and Hakkani-Tur Reference Tur, Schapire and Hakkani-Tur2003), noun phrase chunking (Ngai and Yarowsky Reference Ngai and Yarowsky2000), named entity recognition (Vlachos Reference Vlachos2004), statistical parsing (Hwa Reference Hwa2004) and Japanese word segmentation (Sassano Reference Sassano2002). These experiments have shown that SVM active learning clearly outperformed SVM with passive learning, however no attempt was made to tackle the problem of imbalanced training data at the same time. With respect to using SVM active learning for information extraction, relevant approaches are discussed in Section 6.4 below, however all but (Vlachos Reference Vlachos2004) involve non-SVM-based machine learning algorithms. In particular, (Vlachos Reference Vlachos2004) studied different approaches for selecting unlabelled examples based on the confidence score of the SVM classifier. The results were reported using the CoNLL-2003 shared task data, which enables a direct comparison to our approach. In a nutshell, Table 10 shows that combining active learning with SVMUM achieves better results.
Now let us explore in detail how active learning can be combined with the SVMUM model, in order to address simultaneously both the lack of sufficient training data and its imbalanced nature. The approach is based on the observation that the margin of the SVM classifier to one individual example can be used both for dealing with imbalanced data and for measuring how informative the example is for training – this forms the basis for our version of the SVM active learning algorithm. In addition, we address some specific issues arise specifically during the application of SVM active learning to IE tasks, unlike other applications such as image classification and text categorisation.
Given an SVM classifier (in primal form), namely a weight vector W = {w 1,. . ., w l}, a bias term b, and an example X = {x 1,. . .,x l}, the margin of the example X to the SVM classifier is defined as
The margin measures how close the example is to the SVM hyperplane and can be regarded as the SVM's confidence in classifying X correctly – the smaller the margin m(X, W), the lower the confidence. In other words, the smaller the margin, the more informative the example is for training the model. Therefore, the SVM active learning algorithm is based on the margin – it selects the example(s) with the smallest margin (lowest confidence).
In the context of IE, one general framework for applying SVM active learning is as follows:
1. Randomly choose n 0 documents and manually annotate them as the initial training set S 0. Train the SVM classifiers on S 0 for the IE task.
2. Apply the SVM classifiers to un-annotated documents, and select the n examples with the smallest margins from the un-annotated documents. Label them and add them to the training set.
. Use the extended training set to re-train the SVM classifiers.
4. Repeat steps 2 and 3 for a pre-defined number of loops or until the system obtains a pre-defined performance level.
When putting this algorithm in practice, one needs to consider several important questions. Firstly, one needs to determine the correct granularity for the examples selected for active learning (Step 2) – one token at a time, a token with its surrounding context, or one document at a time. Most previous work has used document-level granularity, with the exception of (Jones Reference Jones2005; Wu and Pottenger Reference Wu and Pottenger2005) who experimented with using sets of tokens. Therefore, this paper presents experimental results evaluating the three possibilities, in order to identify which one is the most suitable.
In addition, whereas token margins can be used directly in the token-based approaches, selecting documents as examples is based on the average confidence of all its tokens. In detail, if there are m classifiers for a given IE task and for each classifier C i we select m 0 tokens with the smallest margins  from a document d, then we compute the average confidence for the document d as the double sum
The document with the smallest average confidence would be selected by the active learning algorithm.
The second question is determining the optimal parameter settings for the active learning algorithm. Our experiments (Section 6) evaluate different values of the three parameters:
• n 0 (the number of initial documents for training);
• n (the number of examples selected in the active learning loop);
• m 0 (the number of tokens used per document for calculating its average confidence).
The third issue arises the combination of active learning with SVMUM. As discussed in Section 3, SVMUM is used for classification in order to address the problem of imbalanced data. However, for active learning purposes, the SVM margins for tokens in unlabelled documents is computed with respect to the standard SVM model, because SVMUM is actually obtained by solving a standard SVM and therefore those unlabelled examples which are close to the standard SVM classifier would be important for improving the current SVMUM model in the next round of learning. As a matter of fact, we did also experiment with computing the margin with respect to SVMUM for active learning and the results were clearly worse than those using the standard SVM margin, which verified our conjectures above.
We will discuss these three issues in more detail in the experiments presented below.
6 Experiments
6.1 Experimental data sets
We evaluated SVMUM and SVM active learning on three IE benchmark corpora covering two different IE tasks – named entity recognition (CoNLL-2003) and template filling (Seminars and Jobs). CoNLL-2003Footnote 7 is the most recent corpus for English named entity recognition. The Seminars and Jobs corporaFootnote 8 have been used to evaluate active learning techniques for IE, thus enabling a comparison with previous work: (Finn and Kushmerick Reference Finn and Kushmerick2003), (Cali. Reference Califf1998) and (Ciravegna et al. Reference Ciravegna, Dingli, Petrelli and Wilks2002).
In detail, we used the English part of the CoNLL-2003 shared task data set, which consists of 946 documents in the training set, 216 document in the development set and 231 documents in the test set, all of which are Reuters news articles. The corpus contains four types of named entities – person, location, organization and miscellaneous.
In the other two corpora domain-specific information was extracted into a number of slots. The Jobs corpus includes 300 software related job postings and 17 slots encoding job details, such as title, salary, recruiter, computer language, application and platform. The Seminars Corpus contains 485 seminar announcements and four slots – start time (stime), end time (etime), speaker and location of the seminar.
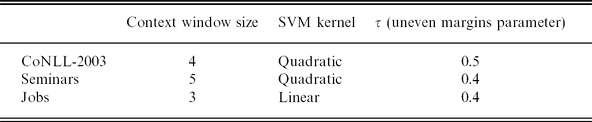
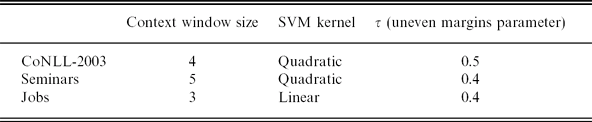
Unless stated otherwise, the experiments in this paper use the SVMUM parameter settings derived empirically in (Li et al. Reference Li, Bontcheva, Cunningham, Niranjan, Winkler and Lawerence2005a). In particular for the uneven margin parameter τ, we tried several values on the CoNLL-2003 development set and on the whole data for the other two data sets and found the most suitable value for each corpus. Table 1 presents the values of three important parameters: the size of the context window, the SVM kernel type and the uneven margins parameter, used in our experiments.
The values of the three key SVM parameters used in the experiments on the three data sets
6.2 Experiments with SVMUM
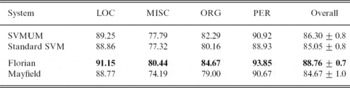
Named entity recognitionTable 2 compares the two learning algorithms: SVMUM and the standard SVM on the CoNLL-2003 test set, together with the results of two other systems, which participated in the CoNLL-2003 shared task: the highest scoring system (Florian et al. Reference Florian, Ittycheriah, Jing and Zhang2003) and the SVM-based system (Mayfield et al. Reference Mayfield, McNamee and Piatko2003). We employed the bootstrap resampling method to compute the confidence intervals for the results of our systems. The same method had been also used to compute the confidence interval for the results of the participating systems of the CoNLL-2003 shared task (Tjong Kim Sang and Meulder Reference Tjong Kim Sang and Meulder2003).
Results on the CoNLL-2003 corpus: F-measure (%) per entity type and overall micro-averaged F-measure. The 95% confidence intervals for results of the two participating systems are also presented – Florian achieved the best results among all participating systems, whereas Mayfield is also based on SVM. The best performance figures for each entity type and overall appear in bold

As can be seen, our SVMUM approach performs significantly better than the participating Mayfield SVM-based system. However, the two systems differ from each other not only in terms of SVM models used but also in other aspects such as linguistic features. Therefore, in order to make a fair comparison between SVMUM and the standard SVM algorithm, we ran additional experiments comparing the two and using the same features. As can be seen in Table 2, even under the same experimental settings SVMUM still outperforms the standard SVM model.
Nevertheless, it should be noted that our SVMUM results are still lower than the best Florian system and the second-best CoNLL-2003 system (see Tjong Kim Sang and Meulder Reference Tjong Kim Sang and Meulder2003), while outperforming the remaining 14 shared task participants. The best system used four different machine learning algorithms and combined their results in a sophisticated way (Florian et al. Reference Florian, Ittycheriah, Jing and Zhang2003). In contrast, our system is only based on one learning algorithm (SVMUM) and therefore one could expect that the scores could be improved if we combine SVMUM with other learning approaches. The second best system did use only one maximum entropy classifier, but it differs in utilising both global and local features. Similar to our approach, local features are based on the current token and its context. In addition, global features were derived from the whole document. For example, one type of such a feature was to check whether or not the first occurrence of a given token was initially capitalised. In contrast, our SVMUM system just uses local features and therefore loses out, because as shown in (Chieu and Ng Reference Chieu and Ng2002b), global features alone can improve F-measure by 2–3 per cent.
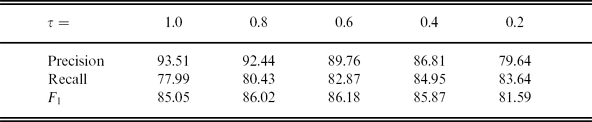
In addition to comparing our results to previous works, we also studied the effect of the uneven margins parameter on SVMUM's performance. Table 3 presents the results for several different values. The results are broken down into precision, recall and F 1, in order to also show the effect of the uneven margins parameter on balancing precision and recall.
Comparison of different values of the uneven margins parameter of SVMUM: results on the CoNLL-2003 corpus, Precision (%), Recall (%) and F1 (%)
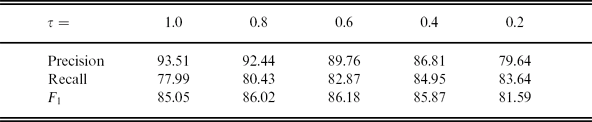
As discussed earlier, an uneven margins parameter τ = 1.0 corresponds to the standard SVM. From the results we can see that it results in imbalanced precision and recall, i.e. high precision and low recall. The τ parameter allowed the system to achieve more balanced precision and recall – a τ less than 1 will decrease the bias term of the SVM model and hence increase recall. For example, comparing τ = 0.6 to 1.0, precision decreases by 4 points but recall increases by 5 points, and as a result, F 1 increases overall. Secondly, when τ changes from 0.8 to 0.4, precision decreases and recall increases, but F 1 does not change much (within 0.5 point), showing that F 1 is not very sensitive to the τ value, as long as it is not very small or large.
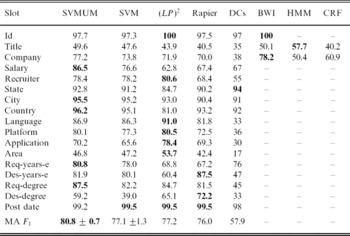
Template filling. The effect of the uneven margins parameter on SVM performance was also evaluated on the jobs corpus and, in addition, SVMUM is compared to several other state-of-the-art learning systems, including the rule-based systems Rapier (Cali. Reference Califf1998), (LP)2 (Ciravegna Reference Ciravegna2001) and BWI (Freitag and Kushmerick Reference Freitag and Kushmerick2000), a statistical system HMM (Freitag and Kushmerick Reference Freitag and Kushmerick2000) and a double classification system (Sitter and Daelemans Reference Sitter and Daelemans2003). In order to make the comparison as informative as possible, the same settings are adopted in our experiments as those used by (LP)2, which previously reported the highest results on this data set. In particular, the results are obtained by averaging the performance in ten runs, using a random half of the corpus for training and the rest for testing. Only basic linguistic features are used: token form (namely the token itself), capitalisation information, token types (namely word, number and punctuation), and lemmas, because the same linguistic features were used by the other systems, e.g. (LP)2.
Table 4 presents the F 1 measure per slot and also the overall macro-averaged F 1. It should be noted that the majority of previous systems only reported per slot F-measures, without overall results. However, an overall measure is useful when comparing different systems on the same data set, so a macro-averaged F 1 for these systems was computed from their per-slot F 1.
Comparison of SVMUM against standard SVM and other systems on the Jobs corpus: F 1 (%) on each entity type and overall performance as macro-averaged (MA) F 1. The 95% confidence interval for MA F 1 of SVMUM is also given. The highest per slot score and overall performance appear in bold

Table 4 presents the results of our SVMUM system, the standard SVM algorithm, and the other six systems which have been evaluated on the Jobs corpus. Note that results on all 17 slots are available only for three of those systems: Rapier, (LP)2 and double classification. The results of all six systems, except SVM and SVMUM, are taken from the publications cited above.
The results show that the overall performance of SVMUM is better than that of the standard SVM model as well as the other three fully evaluated systems. In more detail, SVMUM outperforms SVM in all but two of the template slots (area and post-date). The double classification system has much worse overall performance than our approach and the other two fully evaluated systems, despite having obtained the best result on one of the slots. The HMM-based system was evaluated only on two slots and while it achieves the best result on one of them, it has a significantly worse performance on the other. BWI obtained better results than SVMUM on three slots, but due to lack of results on the other slots, it is impossible to compare the two algorithms on the entire Jobs data set.
Impact of corpus size on performance. One of the hypotheses of this paper is that the uneven margins parameter is even more helpful on smaller training sets, because the smaller the training set, the more imbalanced it could be. For instance, each document in the jobs corpus provides typically only one positive example per slot and the tokens not belonging to any slot vastly outnumber the annotated tokens.
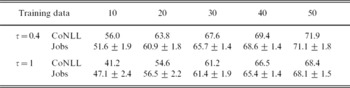
Therefore in order to verify this conjecture, we carried out experiments starting with a small number of training documents and gradually increased the corpus size. Table 5 shows the results of the standard SVM and SVMUM on different number of training documents from the CoNLL-2003 and Jobs data sets, respectively. Unsurprisingly, the performance of both SVMs improves consistently as more training documents are used. However, much more importantly, the smaller the size of the training set, the greater the difference between the SVM and SVMUM results, which verifies the hypothesis above.
The performances of the SVM system with small training sets: macro-averaged F1(%) on the CoNLL-2003 (test set) and Jobs. The SVMUM (τ = 0.4) is compared to the standard SVM model with even margins (τ = 1). The 95% confidence intervals for the Jobs data set are also presented, showing the statistical significance of the results

6.3 Experiments with the different tagging schemes
As discussed in Section 4.2, we formalise the IE task as classification based on the BL entity tagging scheme. Other commonly used tagging schemes are BIO and BIOLU and a comparison between these and the BL scheme also appears in Section 4.2. There we also hypothesised that a BL-based IE system is more efficient and effective than those based on BIO or BIOLU.
Here we present the experiments on the CoNLL-2003 corpus to substantiate this claim. For this comparison we used exactly the same features and SVMUM settings, except for label O as will be explained below. We also adopted the Viterbi algorithm to do post-processing for the experiments using BIO and BIOLU (see Section 4.2 for details on why Viterbi cannot be used with the BL scheme). To make a fair comparison, the experiments for BIO and BIOLU also used the first and second stages of the post-processing for the BL scheme after doing the Viterbi searching, namely checking consistency of token labels and using the entity's length information, as explained in Section 4.3.
From some initial experiments with the BIO and BIOLU schemes, using the same SVMUM settings as for the BL approach, we found that precision is very high (about 0.97) but recall is very low (about 0.20), meaning that most named entities are not identified, because the confidence scores for the non-entity tokens (the O label) are too high in comparison to the scores for the tokens belonging to an entity. Therefore, we needed to decrease the scores for non-entity in order to employ the Viterbi searching algorithm to recognize more named entities correctly. After several experiments based on the development set we found that a very low value of tau (−6) for the label O gave a good balance between precision and recall and the best F 1 on the development set. Hence we used it in the experiments discussed next.
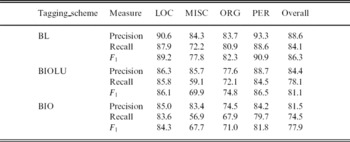
Table 6 presents the results on the CoNLL-2003 corpus for the three tagging schemes. In a nutshell, the results for the BL scheme are much better than those for the other two schemes on each named entity type as well as overall. BIOLU obtains better results than the BIO scheme.
Performance comparison of the different tagging schemes: recognition results on the CoNLL-2003 test data set, Precision (%), Recall (%) and F 1 (%)

Table 7 shows the training and testing times for each tagging scheme. The testing time is the time taken to apply the SVM models to both the development and test data sets. We can see that the BL scheme takes less training and testing times than the other two schemes, and BIO took less time than BIOLU. Note that the running times shown here are for SVM with a quadratic kernel. If a linear kernel is used, these times can be reduced significantly, but the comparative ranking of the three schemes would remain unchanged.
Running times on the CoNLL-2003 corpus for different tagging schemes

The experimental results discussed above verify our conjecture about IE efficiency using the three tagging schemes, namely that the BL scheme obtains the best results and has the lowest training and testing times. Hence the BL scheme is adopted in our other experiments presented in this paper.
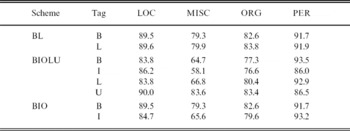
In order to investigate how difficult it is to recognise the different entity tokens, Table 8 presents results for each type of tag in the three tagging schemes. We can see that the entity boundary tokens (namely the B and L tags) are easier to recognise in comparison to the middle tokens (the I tag) in most cases, indicating that the boundary entity tokens are more characteristic than the middle ones. The other more subtle issue is whether one should regard single-token entities as being both a beginning token and end token, or alternatively, single-token entities should be represented as an independent class. We can see from the BIOLU results that for the BIOLU scheme the single-token entity class (namely tag U) gave better results than the B and L classes on three of the four entity types. However, if at the same time we compare the results for the B and L tags for the BL and BIOLU schemes, considering the single-token entity as an independent class in the BIOLU scheme made the recognition of the B and L tags much harder than regarding the single-token entity as being both the B and L tags in the BL scheme. As a consequence, overall the BL scheme is more effective in recognising named entities than the BIOLU scheme, as shown in Table 6. Last, but not least, regarding single-token entities as separate begin and end tags is also more efficient computationally, because it cuts the need to train a separate classifier for such entities only. Hence, overall, regarding single-token entities as separate beginning and end entity tokens is a better choice than regarding the token in a single-token entity as one independent class.
Performance comparison of different tagging schemes: results for each individual tag on the test data set of the CoNLL-2003 corpus, F1(%).

6.4 Experiments with SVM active learning
As already discussed in Section 5, active learning starts off by selecting several examples to train an initial model, then in each round more examples are added to the training set.
For the CoNLL-2003 corpus, the initial training documents were chosen randomly from the provided training set and in each active learning round further examples were selected from the remaining documents in that set. The results reported in this paper are on the Test Set.
For each of the other two corpora (Seminars and Jobs), the initial training set was chosen randomly from the whole corpus and each active learning loop selected samples from the remaining documents. Then all documents not used for training were used for testing. All results reported below are the average from ten runs.
The first experiments below use entire documents as samples. The other two types of samples – token and token with context – are discussed in the last part of this subsection.
6.4.1 Active learning versus random selection
The first comparison is between SVM active learning and a random selection baseline. For all three data sets (CoNLL-2003, Seminars and Jobs), two documents were chosen as the initial training set and then each active learning loop expanded this set by adding the document with the smallest average confidence. The average confidence of a document was calculated using the confidence for 5 tokens on both CoNLL-2003 and Seminars corpora and 2 tokens on the Jobs corpus (see Section 6.4.3 on how these values were obtained).
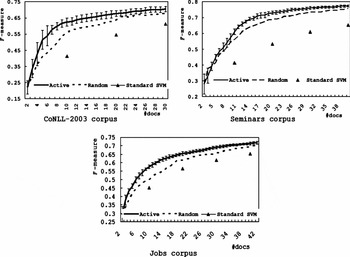
Figure 2 presents the learning curves for SVM active learning and random selection on the three data sets. Both used SVMUM. The results for the standard SVM with random selection are also presented at some data points for comparison. A learning curve shows the performance trend of a system evaluated on the test set when more and more labelled documents are added to the training set.
Learning curves respectively on the three data sets: the overall F1 plotted against different numbers of documents in the training set. Active learning (denoted Active in the graphs) is compared with random selection (denoted Random) for the SVMUM algorithm. The results for the standard SVM model with random selection (Standard SVM) are also presented for comparison. The error bars show the 95% confidence intervals, which were computed from the 10 runs for each experiment. For clarity, only the error bars for active learning are plotted.

Firstly, as expected, the results of active learning are clearly better than those of random selection on all three data sets. It is also worth noting that again SVMUM performs significantly better than the standard SVM with random selection.
Secondly, the gap between active learning and random selection widens after the first few learning loops, however, the difference is data set dependent, i.e. smaller on some sets than on others. The learning curves become flat after approximately 20 loops for both active learning and random selection.
Thirdly, for clarity, only the confidence intervals for active learning are plotted in Figure 2. As a matter of fact, the confidence intervals for random selection are bigger than the corresponding ones for active learning at almost all data points on all three data sets, showing that the results of active learning are more stable.
Finally, results on comparing the standard SVM active learning and SVMUM active learning are presented in Section 6.4.2 next, see Table 10. In brief, the conclusion is that SVMUM with active learning outperforms the standard SVM, both with random selection and active learning.
6.4.2 Comparison of SVMUM active learning against other systems
This section compares SVMUM active learning to other approaches, using the seminars corpus as a benchmark, due to the fact that the majority of previous work has reported results on this data set. For instance, (Finn and Kushmerick Reference Finn and Kushmerick2003) evaluated several active learning techniques based on the (LP)2 rule learning algorithm. Table 9 compares the results of SVMUM active learning against those presented in (Finn and Kushmerick Reference Finn and Kushmerick2003), under similar experimental settingsFootnote 9.
Comparisons of our results with previous best results and the upper bounds: the overall F1 (%) on the Seminar corpus

We can see that SVMUM active learning has much better performance than the best results achieved by rule-based active learning discussed in (Finn and Kushmerick Reference Finn and Kushmerick2003). In fact, our active learning results are close to the optimal results, which were estimated as the upper bound on the performance of any selection strategy.
On the Jobs data set, the SVMUM active learning results are better than the active learning method based on Rapier (Cali. Reference Califf1998). For example, with 40 training documents, the overall F 1 of our active learning approach is 0.71, higher than Rapier's corresponding figure (around 0.64).
Vlachos Reference Vlachos2004 applied SVM active learning on the CoNLL-2003 corpus for named entity recognition, using the same learning algorithm and similar NLP features. However, there are two main differences between his experiments and ours. The first one is that (Vlachos Reference Vlachos2004) learned one binary SVM classifier for each entity type (to discriminate the tokens belonging to any of the entities of that type from all other tokens), while we train two binary classifiers for each entity type (see Section 4). The second difference is that (Vlachos Reference Vlachos2004) used the standard SVM algorithm while we use SVMUM.
Table 10 compares our experimental results respectively using the standard SVM and SVMUM against the corresponding results of the standard SVM with and without active learning, as reported in (Vlachos Reference Vlachos2004). First, active learning clearly outperforms passive learning in both cases, confirming the effectiveness of SVM active learning. Secondly, the difference in the results of the standard SVM in our system and those reported by (Vlachos Reference Vlachos2004) is due to the different experimental settings, particularly in learning one versus two binary classifiers per entity type. However, the results using SVMUM in our experiments were significantly better than the results of the standard SVM in both our experiments and those in (Vlachos Reference Vlachos2004), showing the advantage of the SVMUM model. Last but not least, the best results are obtained again when active learning is combined with SVMUM.
Comparison of our experimental results on the CoNLL-2003 corpus with those presented in (Vlachos Reference Vlachos2004) (which we estimated from Figure 5.5 (the min curve) in Vlachos Reference Vlachos2004): Micro-averaged F1 (%). “AL + SVMUM” refers to SVM active learning with an SVMUM model. “SVM” and “SVMUM” respectively refers to the standard SVM and the SVMUM using random selection. The highest score appears in bold

6.4.3 Parameters of SVMUM active learning
As discussed in Section 5, three parameters impact the performance of SVMUM active learning. The first one is the number of tokens used for computing the average confidence of a document, namely m 0 in Equation (4). As there may be some outliers in a classification problem, using one token could lead to an unstable performance. On the other hand, if many tokens are used, the tokens with large margins would overwhelm the informative tokens with smaller margins. Table 11 presents the results with different values of m 0 for the Seminars and Jobs data sets. We can see that too small or too large value of m 0 produces worse results than using a value between 3 and 5.
Different number of tokens used for computing the average confidence of document: macro averaged F1 (%) with the 95% confidence interval for the two data sets Seminars and Jobs. In each experiment total number of training documents was 20

The second parameter is the number of initial documents randomly chosen for training, namely n 0. On the one hand, the smaller n 0 is, the earlier we can take advantage of active learning. On the other hand, since active learning uses the current model to choose the next examples, too few initial examples could result in a bad SVM model which in turn would be harmful to the quality of the selected examples. Table 12 shows the results for n 0 = 1, 2, 4 and 10, respectively. n 0 = 2 obtained the best result for Seminars and n 0 = 4 for the Jobs corpus. However, there seems to be no significant difference between the results on the Jobs data set.
Different number of initial training document for SVM active learning: macro averaged F1 (%) with the 95% confidence interval on two data sets – Seminars and Jobs. In each experiment the total number of training documents was fixed as 20

The last parameter discussed here is the number of documents n selected in each active learning loop. If each loop chooses only one document prior to re-training the model, then the results will be more accurate than those obtained by selecting two or more documents at a time. On the other hand, the more documents are selected in one loop, the fewer loops would be needed in order to reach a given performance target. In other words, if the second best example is not much less informative than the best one in one active learning loop, then we may use the second best example as well as the first one, in order to save computation time. Table 13 shows that n = 1 gave slightly better results than n = 2 or 3 for both data sets, but the computation time for n = 2 was half of that for n = 1 while still achieving similar performance.
Different number of documents selected in one active learning loop: macro averaged F1 (%) with the 95% confidence interval for the two data sets Seminars and Jobs. In each experiment total number of training documents was 20

6.4.4 Granularity of active learning samples
As discussed in Section 5, IE active learning for IE can select in each loop either the entire document, or only one or more tokens. The drawback of selecting complete documents in each loop is that the user must annotate them from beginning to end, which could be quite a substantial task on large documents. Therefore, compared to full document samples, if token or text fragment sampling can be used, then it could save a great deal of manual annotation time in each active learning loop. Consequently, this section compares the performance of token and text fragment sampling against full document sampling.
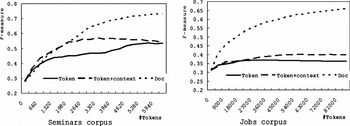
Figure 3 plots the learning curves for using a token, text fragment and complete documents as the samples. Two training documents were used to obtain the initial model, prior to starting sample selection. For both token and text fragment sampling, each learning loop used 5 and 2 tokens/fragments respectively for the Seminars and Jobs data sets. The text fragment size was 11 tokens on both corpora. Figure 3 reports the results of the three sample types on the same the number of tokens from the test set.
Learning curves for active learning using three types of sample on the two data sets, respectively.

Surprisingly the results using document samples are the highest and text fragment samples perform better than tokens in most cases. However, it is worth noting that the performance of both token- and fragment-level sampling achieves better performance than full document sampling during the initial active learning stages of the Seminars corpus. The learning curves for token samples become flatter in the later stage, compared to the curve for full document samples. The learning curves for text fragments are even worse – they decrease after some learning loops. One possible explanation for the poor results of token- and fragment-level sampling is that the token- or fragment-level sampling may cause over-fitting of the learned model to the selected samples and decrease the model's capability of generalisation, whereas the document-level sampling selected more balanced instances and generated the models with much better generalisation capability.
7 Conclusions
This paper investigated two techniques for enhancing the standard SVM model to deal with imbalanced training data and the difficulty in obtaining human-annotated examples, which are two problems that frequently arise in NLP tasks. In comparison to other methods dealing with these problems, our approach not only achieves state-of-the-art performance but is also computationally efficient, which make it attractive to real-world applications.
The paper presented a new approach to deal with imbalanced training data by introducing the uneven margins parameter in the SVMUM model. We also investigated SVM active learning and the different strategies that can be used in order to reduce the required human input – sampling at document-, token- and text fragment-level.
As both SVMUM and SVM active learning only require solving the standard binary SVM problem and then apply some simple transformations, they are simpler and computationally more efficient than some other SVM-based methods for dealing with imbalanced data such as multi-class SVM and transductive SVM, which implement and solve more complex optimisation problems. At the same time, our approach is also more effective than other methods based on transforming the training data, which makes it overall more appropriate for real-world applications, many of which tend to have hundreds of classes and thousands or millions of instances.
In this paper SVMUM and SVM active learning were evaluated independently of each other and also in combination, by applying them to two information extraction tasks: named entity recognition and template filling. The results demonstrate clearly that SVMUM outperforms the standard SVM model and also that SVM active learning outperforms random sampling. Moreover, when the two approaches are combined, the system outperforms other state-of-the-art methods evaluated on the same benchmark IE datasets.
In addition, we also evaluated the token based classification framework for IE with three different entity tagging schemes. We found that the BL scheme, which tags only the first token and last token of an entity, gave more accurate recognition results and was more computationally efficient than other two commonly used tagging schemes which tag every token in document.
On the basis of the results reported here and previous work, we believe that SVMUM and other techniques studied in this paper could bring similar performance improvements to NLP tasks other than IE. Similarly, the SVMUM active learning is applicable to most NLP problems. For instance, we are starting experiments with applying SVMUM and active learning to opinion analysis and Chinese word segmentation.
One avenue of future work is to investigate enhancing the multi-class SVM (see e.g. Tsochantaridis et al. Reference Tsochantaridis, Hofmann, Joachims and Altun2004) to deal with imbalanced training data and the transductive SVM (TSVM, see e.g. Collobert et al. Reference Collobert, Sinz, Weston and Bottou2006) to exploit unlabelled data, and compare and/or combine them with the methods discussed in this paper.
Another avenue of research is to investigate further the three sampling strategies used by active learning. As discussed in Section 6.4.4, document-level sampling resulted in a good learning curve, while token-level sampling requires significantly lower annotation effort during each active learning round. The combination of the two types of sampling, e.g. using token-level examples in several consecutive learning rounds then using document-level examples in one or two subsequent rounds, would probably strike a good balance between system accuracy and annotation time.
Acknowledgments
This research was partially supported by the EU-funded MUSING (http://www.musing.eu/) and SEKT projects (http://www.sekt-project.com). We would like to thank the anonymous reviewers for their valuable suggestions on improving the paper, in particular the suggestion about comparing the IE frameworks based on different entity tagging schemes.