


1. Introduction
This paper explores a new and efficient algorithm for computing the three-dimensional stress and velocity fields in glaciers and ice sheets including the role of normal deviatoric stress gradients. The algorithm is based on a two-dimensional version developed by Reference MullerMuller (1991). A set of field equations and boundary conditions in a consistent approximation of first order in the aspect ratio of the ice mass can be solved using the method of lines and a simple iteration procedure. The algorithm is effective for a wide range of stress-strain-rate relations (flow laws), as long as only deviatoric and shear stresses are involved. Temperature-dependence of the flow rate may be introduced through a temperature-dependent rate factor.
The mechanics and thermodynamics of an ice mass constitute a Stokes problem, where the geometry and the temperature field evolve with time, but the velocity and stress fields are quasi-stationary. This allows one to calculate the flow as a steady-stale field for a given transient geometry and transient viscosity field at a given time. In this work, the evolution of the geometry and of the temperature field are not considered. The viscosity field is, of course, the result of transient evolution of other internal fields. such as the temperature, moisture Content, impurities and crystal size.
It is generally assumed that deviatoric stress gradients are negligibly small for the modelling of the overall behaviour of large ice sheets, although it is admitted that this may not be true near ice divides and near ice margins. However, attempts to model ice-sheet evolution over several glacial-interglacial cycles demand a fast algorithm. This consideration forces more restrictive approximations Reference MahaffyMahaffy, 1976; Reference HertenchiHerterich, 1988: Reference Huy-brechtsHuy-brechts, 1992), such as the shallow-ice approximation rigorously established by Reference HutterHutter (1983). On the other hand, Reference Dahl-JensenDahl-Jensen (1989) showed that longitudinal deviatoric stress and shear stress ate both of lead order for plane-strain transverse section of the Greenland ice sheet and neither one can be neglected. The same holds even more for glaciers with larger aspect ratios than ice sheets, where deviatoric stress gradients account for important features, such as crevassing and wavy-surface topography.
Obviously, there is no single algorithm optimal for each application and numerical methods must be chosen according to the type of Study. The advantage of the numerical scheme promoted in this study is its simplicity and easy application for an interesting range of ice-sheet and glacier situations. To demonstrate this, the algorithm is applied in a simple synthetic ice-sheet geometry and is also used m simulate infinitely long parallel-sided slabs. A scaling tailored to the type of geometry reduces the number of parameters and thus allows the performance of the algorithm to be investigated for a wide range of sizes and aspect ratios.
2. Governing Equations
2.1 Field equations
Ice is treated as an incompressible viscous fluid, Its mechanical properties may depend on other fields of physical quantities, such as temperature and stress. The geometry of the ice mass is defined by the upper free surface S = S(x,y) and the basal surface B = B(x,y) in Cartesian coordinates (x,y,z) with the z axis pointing opposite to the direction of gravity. The equation for mass continuity then becomes

where u, v and w are the velocity components in the x,y and z directions, respectively, and for linear momentum


where ρ is the density of ice. g is the acceleration of gravity and τxx, τyy, τzz, τxz, τyz and τxy are the components of the symmetric Cauchy stress tensor τij. Glacier ice is generally treated as a non-Newtonian fluid with a stress strain-rate relation of the form


where σij = τij − (1/3)τkkδij is the deviatoric stress tensor and σxx. and σyy are the normal deviatoric stress components. Due to the incompressiblity condition in Equation (2.1), an additional equation relating ∂w/∂z to σzz is redundant and can be omitted. The term AF(·) represents a flow law. In this study, a flow law of the form (Reference NyeNye. 1953; Reference GlenGlen. 1958; Reference MeierMeier. 1958)

is used, where T is the effective stress (second invariant of the deviatoric stress tensor), µ is the viscosity and µ0 = 1/ΑΤ0 n−1 is the viscosity in the limit of vanishing stress. The rate factor A is usually assumed to depend exclusively on temperature. The absence of pressure-dependence, e.g. considered in Reference Weertman, Whalley, Jones and GoldWeertman (1973), is crucial for the applicability of the algorithm introduced below. Substituting Equations (2.5) and (2.6) into Equation (2.1) yields

which is easier to handle than Equation (2.1) in the numerical integration scheme described in sections 3.1 and 3.2. For the upper free surface S = S(x,y), the boundary conditions for stress are


where

are the components of the normal Vector n pointing outward from the ice and P is the pressure on the outer side of the surface. Note, in this simple form, the vector n is not a unit vector. In the case of a grounded ice sheet with no basal melt or freezing and no isostatic uplift, basal motion is to a good approximation parallel to the bed

in the case of sliding, and u=v=w = 0 in the case of non-sliding conditions.
2.2 Scale analysis
To arrive at a consistent simplified set of equations, we need to estimate the order of magnitude of the various terms in the equations. To this end. we introduce a scaling for spatial variables x, y, z, S and B.,

the velocity components u, v, and w,

the stress components τij, σkk and the pressure P,

and for the rate factor A

where {L} and {H} denote the characteristic horizontal and vertical extents of the ice sheet, respectively, A0 is a typical rate factor, and

Scaling the continuity Equation (2.11), the stress Equations (2.2)–(2,4) and the constitutive Equations (2.5)–(2.9) yield


and the surface-boundary conditions for stress in Equations (2.12)–(2.14) in the scaled form are


To eliminate the normal Cauchy stresses in Equations (2.22)–(2.24), we follow the usual procedure (see e.g. Reference Hetterich, Van der Veen and OerlemansHerterich, 1987) by deleting terms of order O(ϵ2) in Equation (2.24) and integrating the truncated equations from


Using Equation (2.32) and the relation between Cauchy stresses and deviatoric stresses in the form

in Equation (2.33) and dropping terms of order O(ϵ2) yields


We differentiate Equations (2.35) and (2.36) and substitute the result in Equations (2.22) and (2,23), respectively, to obtain


Similarily, eliminating


Finally, we get eight independent Equations (2.37), (2.38), (2.21) and (2.25)–(2.29) for the eight unknown field variables


3. Numerical Scheme
3.1 Coordinate transformation
The numerical scheme used for integrating the above set of first-order equations was developed by Reference MullerMuller (1991) for the two-dimensional plane-strain approximation, and is extended here for the three-dimensional case. We apply a coordinate transformation (Reference PhillipsPhillips, 1957; Reference JenssenJenssen, 1977)

which maps the local ice thickness on to unity (Fig. Fig. 1). Equations (2.37), (2.38), (2.21) and (2.25)–(2.29) are transformed to


with the newly introduced variables


and the abbreviations


The quantities Cx and Cy correspond to the inclinations in the


Typical ice-sheet shape (a) and the transformed shape (b) by mapping the ice thickness on to unity. The grid is uniform in the transformed coordinates.

3.2. Integration
Introducing a discrete grid (Fig. 1) and approximating the


This integration, started at ζ = 0 with some prescribed basal values for shear stresses and velocity components, does not automatically satisfy the surface boundary conditions in Equation (3.14). In order to solve the boundary-value problem, the proper basal values for


which corresponds to the shallow-ice approximation of the basal shear stresses. With these assumptions, the algebraic Equations (3.7)–(3.9) can be solved for the basal values of


which generally do not meet the boundary conditions in Equation (3.14). The iteration is carried out by subsequently choosing new values


where βx and βy are chosen iteration parameters.
It is interesting to note that the solution for


and can be integrated separately after the iteration has converged. In the rest of this paper, the scaled Equations (3.2)–(3.9) are used. The unscaled version of these equations can be recovered by setting ϵ = 1 and using the unscaled variables instead of the scaled ones.
3.3. Plane-strain approximation
Let us assume that no quantity depends an ỹ, then ∂/∂ỹ ≡ 0. From Equation (2.26), it then follows that


with the new variable

and the abbreviation

The transformed boundary condition for stress at the free surface is

The iteration scheme is the same as for the three-dimensional case. An initial choice is

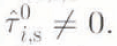
which corresponds to the shallow-ice approximation of the basal shear stress. With this shear stress and the prescribed values for the basal-velocity components, Equation (3.24) is used to calculate the basal value for


where β is the iteration parameter.
4. Performance Testing of the Algorithm
4.1 Stability and convergence pattern
Reference MullerMuller (1991) provided a detailed analysis of the accuracy and stability of the two-dimensional algorithm for a Navier-Stokes fluid. He gave a criterion for the convergence of the iteration scheme

where M is the number of grid points in the horizontal direction, and {H} and {L} are the vertical and horizontal extents of the ice mass, respectively. Equation (4.1) suggests a strong dependence of the convergence range on the aspect ratio ϵ = {H}/{L} and the chosen longitudinal grid resolution


The aim of the iteration is to approach the surface-boundary condition


Convergence/divergence patterns for various iteration parameters: (a) β = 0.065, (b) 0.09, (c) 0.096, (d) 0.105 and (e) 0.28, The example corresponds to the scaled plane-strain cross-section as shown in Figure 2 and with an aspect ratio ϵ = 0.05. With the chosen grid resolution


4.2 Scale length
A given scaled geometry,


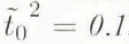
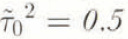
It seems reasonable to assume that the largest basal shear traction occurring in ice sheets and glaciers of a wide variety of shapes and sizes does not appreciably exceed 105 Pa. It is informative to reduce the set of shallow-ice masses with a given scaled shape


for the shallow ice approximation. Similarly, with Equation (2.18), it follows that u ∝ ϵ−1, and w is independent of ϵ. Applying this result in Equation (3.24) yields

which indicates the growing importance of the normal deviatoric stress with growing aspect ratio ϵ. A Limiting basal shear traction of 105 Pa now implies that even continent-size ice sheets cannot become thicker than a very few kilometres. On the other hand, this also implies the known fact that smaller ice masses tend to have larger aspect ratios, which makes the application of the described numerical algorithm more difficult; thus the iteration is slower for smaller glaciers than for larger ice caps and ice sheets.
This pattern is illustrated in the following numerical experiments using a simple synthetic geometry. As an example, a fourth-order parabola was chosen (Fig. 3) to represent the scaled images of the surface and basal profiles. These profiles were used in two ways. In the plane-strain approximation, they represent the geometry of a plane cross-section through an ice mass. In a second set of numerical experiments, these profiles are rotated around the

Figure 4 shows the scaled values of the basal shear stress and the longitudinal deviatoric stress at the surface, and Figure 5 shows the velocity components at the surface for the plane-strain approximation. Figures 6 and 7 show the same quantities but for the radial section along the ỹ = 0 plane of the three-dimensional geometry. As can be expected, the shear stress and the radial velocity component in the shallow-ice approximation are the for the plane-strain approximation and for the circular three-dimensional geometry. The differences between plane-strain and three-dimensional solutions of the first-order shear-stress and horizontal-velocity components are also small. However, the differences between plane-strain and the three-dimensional case are signif-icant for the radial deviatoric stress and the vertical-velocity component, which is mainly due to the spreading effect of the circular ice mass. Furthermore, deviatoric stress components and the vertical-velocity component strongly depend on the aspect ratio.
Scale values for {H} = 11.694/ϵ and {L} = {H}/ϵ for given ϵ for a plane-strain ice mass with scaled shape as shown in Figure 3, if the maximum occurring basal shear stress is 105 Pa. The smallest possible number of iteration steps; n, the corresponding best choice for the iteration parameter β, and the largest residual


The cylindrical symmetry of the assumed three-dimensional geometry should be reflected in the results for stress and velocity components. This is used to test the influence of grid size and the resulting polygonal margin of the circular ice mass. The solutions for the vertical-velocity component w and the total horizontal velocity vh 2 = u2 +v2 must be cylindrical. It is interesting to note that the same is true for the quadratic forms τrz 2 = τxz 2 + τyz 2 and σrr 2 = σyy 2 + σxx 2 + σxxσyy + τxy 2. It is straight forward to show that the quantity σrz is indeed an invariant under rotations of the coordinate system around the z axis and the same holds for σrr, since the sum τrz 2 + σrr 2 equals the square of the effective stress, i.e. the second invariant of the deviatoric stress tensor. This invariance is not a result of the cylindrical symmetry of the chosen ice mass but is generally valid. Figure 8 shows a contour plot of the basal τrz for the circular ice sheet with cross-section as shown in Figure 3. The contours are close to circles except for a narrow marginal zone, where they seem to be influenced slightly by the polygonal shape of the margin.
Basal shear stress



Horizontal velocity component ῦ and vertical velocity component


4.3 Plane-strain parallel-sided slab
In this section, the effect of longitudinal strain on the stress components is re-investigated (Reference CollinsCollins, 1968; Reference NyeNye. 1969; Reference BuddBudd, 1970; Reference Hutter and OlunloyoHutter, 1980) by applying the first-order algorithm to a plane-strain parallel-sided slab geometry. This simple geometry is chosen to separate the effect of longitudinal strain from effects due to changes in ice thickness or longitudinal variations in the ice temperature. The coordinate system (x, z) is chosen to lie parallel to the slab direction with the z axis pointing perpendicular to the slab. The momentum equations are


where α is the inclination angle of the slab normal with respect to the direction of gravity. The same procedure as described in section 2.2 yields the corresponding first-order stress equation

For the parallel-sided slab with surface S ≡ H and base B ≡ 0, we get ∂S/∂x = 0.
The slab is defined by its thickness H and its inclination angle α, which suggests a somewhat different scaling than used in the previous sections:


where A0 is a typical rate factor. For an isothermal slab, A ∂ A0 , Equations (4.6) and (3.22)–(3.24) in scaled form are again with the flow law of Equation (2.10). For the slab geometry, the scaling alone yields a set of equations suitable for the first-order algorithm and the only remaining parameter is


Contour plot of


For a parallel sided slab, the characteristic longitudinal length scale {L}, and thus the aspect ratio ϵ, can be defined by H/{L} = ϵ = sin α. With this, the stability criterion in Equation (4.1) becomes

The stability of the iteration does not depend on the slab inclination, as also can be concluded from the scaled Equations (4.10)–(4.13), which no longer contain the angle α. Moreover, convergence could only be reached for


4.4 Effect of longitudinal strain
In the shallow-ice approximation, the shear stress is independent of longitudinal strain. This is no longer true for the first-order approximation. A look at the first-order equations for a Navier-Stokes fluid

reveals an interesting relation between longitudinal velocity variations and shear stress. With Equation (4.15), the algebraic Equation (4.13) becomes linear in


To avoid a singularity in the shear stress,


On the other hand, for a Navier Stokes fluid, the shear stress only deviates from she shallow-ice shear stress if the longitudinal gradient of the velocity field also changes with


a change in ῦ0 is also equivalent to a shift of the velocity Geld parallel to the


To study the effect of longitudinal strain on the stress field, the shear stress and the longitudinal deviatoric stresses were calculated as a function of the prescribed longitudinal variations of the basal-velocity field. The algorithm was used to solve Equations (4.10)–(4.13) for a non-linear flow law (Equation (2.10) and n = 3. Vertical profiles of stress and velocity components were prescribed as boundary Conditions at the upper and lower ends; of the slab with finite length. Near these ends, zones with no longitudinal strain were defined by prescribing constant basal-velocity components. Between these zones, the basal-velocity components were varied as required for the specific study.
A constant longitudinal gradient of the sliding velocity, Equation (4.17), was assumed in a first set of numerical experiments. A typical result is illustrated in Figure 9. The longitudinal stress at the surface of the slab remains zero in the homogeneous zones and is constant in the zone where sliding velocity increaser; linearly. The shear stress only varies slightly in the two positions where the longitudinal gradient of the sliding velocity changes but is unaffected in places where the longitudinal sliding gradient is constant. This confirms the pattern suggested by Equation (4.16)for a Navier-Stokes fluid., in so far as shear stress is undisturbed in this case and Equations (4.18) and (4.19) still hold. The dependence of the longitudinal stress on the longitudinal sliding gradient is depicted in Figure 10.
The shear velocity, ῦs − ῦb, also depends on the longitudinal gradient of the basal velocity. This is a result of the non-linear flow law (Equation (2.10), which contains the effective stress and thus, the longitudinal deviatoric stress


This cannot hold anymore in the case of a longitudinally changing sliding gradient. In the following example, a sliding velocity is a quadratic function of


Typical result for the dimensionless basal shear stress (solid line) and dimensionless longitudinal deviatoric stress at the surface of the slab versus longitudinal spatial coordinates


Dimensionless longitudinal deviatoric stress at the surface of the slab versus dimensionless longitudinal sliding gradient


Dimensionless shear velocity ῦs − ῦb at the surface of the slab versus dimensionless longitudinal sliding gradient




5. Conclusions and Discussion
The numerical algorithm developed by Reference MullerMuller (1991) for calculating stress and velocity fields in two-dimensional (plane-strain) grounded ice masses also takes into account the effects of the normal deviatoric stresses. The algorithm was extended to three dimensions and its applicability was examined for various situations. It works efficiently for large ice-sheet configurations and the necessary iteration to match the stress-boundary conditions at the surface converges rapidly. However, the efficiency decreases with increasing horizontal spatial resolution and with increasing aspect ratio, corresponding to a smaller ice mass. Compared with the isothermal case, the introduction of temperature layering also slows the iteration.
The algorithm can become unstable for an ice geometry having a large aspect ratio or a grid with too fine a longitudinal spatial step. Such instabilities often originate where horizontal gradients in surface or bed topography are large. Instabilities can arise in different parts of the algorithm: (1) the ODE integrator (e.g. Runge-Kutte scheme) may become unstable if the vertical grid size is inadequate, (2) the root finder (e.g. Newton-Raphson scheme) may become stalled or run away, and (3) the iteration procedure may diverge. The third cause is most frequent and limits the range of applicability of the algorithm. If convergence can be reached, the best choice for the iteration parameter to achieve fastest convergence must be found by experiment for each geometry and aspect ratio.
Dimensionless basal shear stress (lower graph), longitudinal deviatoric stress at the surface of the slab (solid line in upper graph) and dimensionless sliding velocity ῦb/10 (long-dashed line) versus longitudinal spatial coordinate


The limits of applicability of the algorithm were explored and this points the direction for future research. The value of the method could he greatly enhanced if the horizontal resolution of the discretization grid could be improved. This is an essential prerequisite addressing such interesting questions as the stress field near a calving front, and the patchy basal stress and velocity field of sliding glaciers, where the characteristic size of the patchiness may be smaller than the average ice thickness (personal communication from G, K. C, Clarke).
The inclusion of floating ice shelves would necessitate a hybrid iteration procedure. In the ice-shelf part, the shear traction vanishes not only at the upper ice surface but at the floating base. To adjust to this situation, it would be necessary to specify the velocity at the floating base and shoot to satisfy the stress-boundary condition at the upper surface. As shown in section 4.4, the relation of the stress field to the basal velocity field is weak and more complex than the relation of the stress field to the basal shear stress. This makes the iteration difficult for the floating parts and, thus far, no converging iteration procedure has been found. Reference Van der Veen, Van der Veen and OerlemansVan der Veen (1987) introduced an iteration scheme usable for both grounded and floating parts of an ice mass. However, the applied vertical averaging of the longitudinal stress may be a viable option For floating ice shelves but may be difficult to justify for grounded glaciers.
Despite the above-mentioned limitations, the algorithm works efficiently for an interesting range of ice-sheet and glacier configurations. Its coding is very simple, which makes its application very flexible. The required input is the surface and basal geometry, and the basal velocity. In contrast to other numerical schemes incorporating deviatoric stress gradients, it is not necessary to start the iteration with an initial guess for the whole stress and velocity fields. The only necessary input is the rate factor, or equivalently, the temperature field, which may be supplied from other sources. The required initial guess for the basal shear traction can easily be calculated if the shallow-ice approximation is used or it can be taken from the previous time-step if the code is incorporated into a transient ice-sheet model. The computation time for one iteration step is comparable to the computation time for the shallow-ice approximation of the velocity field. For ice caps and ice sheets of intermediate (100 km) to large size, the algorithm usually converges within less than ten steps. The number of iteration steps drops to one or two for each time-step, if the surface geometry is not changing fast and the result of the previous time-step is used as a starting point. Thus, the algorithm can he readily incorporated in a thermo-mechanically coupled transient ice-sheet model.
Acknowledgements
This work was done while on leave at the Department of Geophysics and Astronomy, University of British Columbia, Vancouver. The author wishes to thank G. K. C. Clarke, S. Marshall and U. Fischer for stimulating discussions. G. K. C. Clarke reviewed an earlier version of the paper and helped to improve it substantially. A. Ohmura generously made the sabbatical leave possible. G. Wanner, Department of Mathematics, University of Geneva, supported the development of the algorithm in his Institute.



